POLICY FRAMEWORK FOR THE TRANSITION
←
→
Page content transcription
If your browser does not render page correctly, please read the page content below
POLICY FRAMEWORK FOR THE TRANSITION
TO A LOW-EMISSION ENERGY MATRIZ IN THE
 ECONOMIC AND SOCIAL DEVELOPMENT OF
             NICARAGUA
                                               Dr. Paul Oquist
           Member of the Standing Committee of Climate Finance
              for Latin America and the Caribbean (Nicaragua)
                  Minister-Private Secretary for National Policy,
                         Presidency of the Republic of Nicaragua

        Brussels, Belgium, 16 October 2013                     1
EXPANSION AND TRANSFORMATION OF THE
        ENERGY MATRIX: 25% RENEWABLE IN 2007
          TO 90% IN 2020 (US$2.9 Mil Millones DFI)

                                                                                                                                                                       Non renovables: 10%
                                                                                                                           No renovables: 6%
                             6.000
                                                                                                                                                                                             FUEL OIL, 10.2%

                                             8 TO 12 HOUR                                                                                                                                     Biomass, 4.2%

                             5.000           DAILY                                                                                                                                            Wind, 9.8%
                                                                                                                                               FUEL OIL, 6.4%
                                             RATIONING                                                                                          Biomass, 5.1%
                                             2006-2007                                                                                          Wind, 12.1%
                             4.000
Generación eléctrica (GWH)

                                                                         Non renewable: 64%                                                                                                  Geothermal, 27.5%

                                                                                                                                                                   Renewable: 90%
                                                                                                                Renovables: 94%
                                     Non renewable:

                             3.000                                                                                                             Geothermal, 35.7%
                                                      DIESEL OIL, 8.0%
                                                                                              FUEL OIL, 64.2%
                                          75%

                             2.000
                                                      FUEL OIL, 66.6%
                                                                                                                                                                                             Hydro, 47.3%
                                                                          Renewable: 36%

                                                                                              Biomass, 6.8%
                                                                                               Wind, 6.6%                                      Hydro, 40.7%
                             1.000
                                       Renewable:

                                                        Biomass, 8.4%                          Geo, 14.3%
                                          25%

                                                        Geo, 6.1%
                                                       Hydro, 10.8%                           Hydro, 8.0%
                                 -
                                                        2007                                   2012                                              2017                                         2022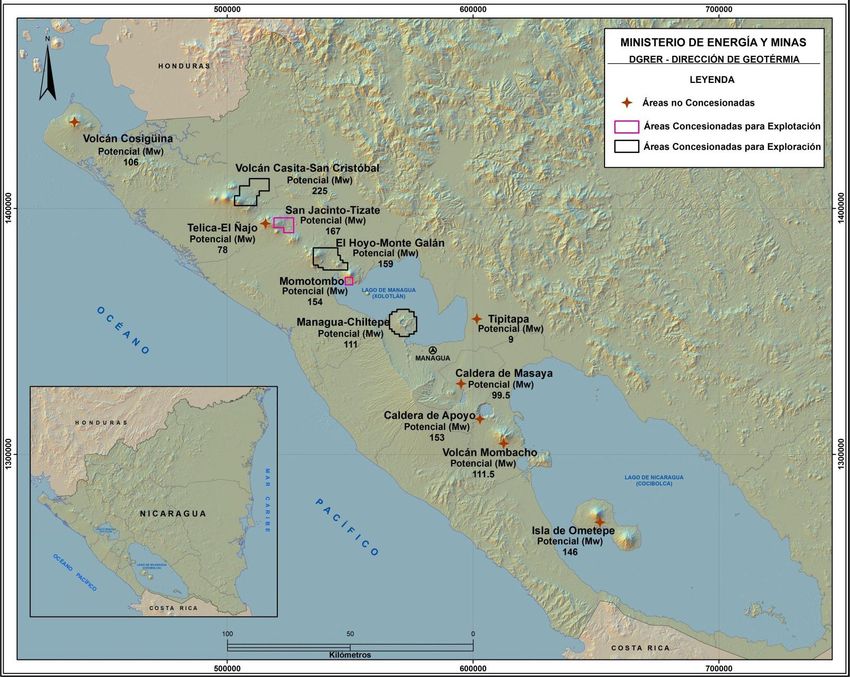
NICARAGUA'S ENERGY PROJECTS
                                            SOLAR PANELS
                                            MICRO AND SMALL
      GEOTHERMAL                            HYDROELECTRIC
San Jacinto-Tizate (72MW)                   PROJECTS FOR
   Casita-San Cristóbal
                                            ISOLATED AREAS
            (35MW)
(107MW; US$ 585.59 mill)                                            TUMARÍN HYDROELECTRIC
                                                                         PLANT, RAAS
                                                                    253 MW; US$ 1,100 Billion
                                                                            (2018)

San Jacinto-Tizate

                                                              Other Hydroelectric Projects:
 Solar Project in La
                                                              Larreynaga(17.2 MW, US67.9 mill)
 Trinidad, Diriamba                                           Hydropantasma (12MW, US$37.4 mill)
                                                               El Diamante (5MW, US$13.4 mill)
                             Eolo (Rivas) (44MW,
                                                              (34MW, US$118.7 million)
                             US$105.9 mill)
                             Blue Power (Rivas)
                             (40MW, US110mill)
                             ALBA Rivas (Rivas)
                             (40MW, US$87 mill)                                               3
                             (124 MW; US$ 302.9 million)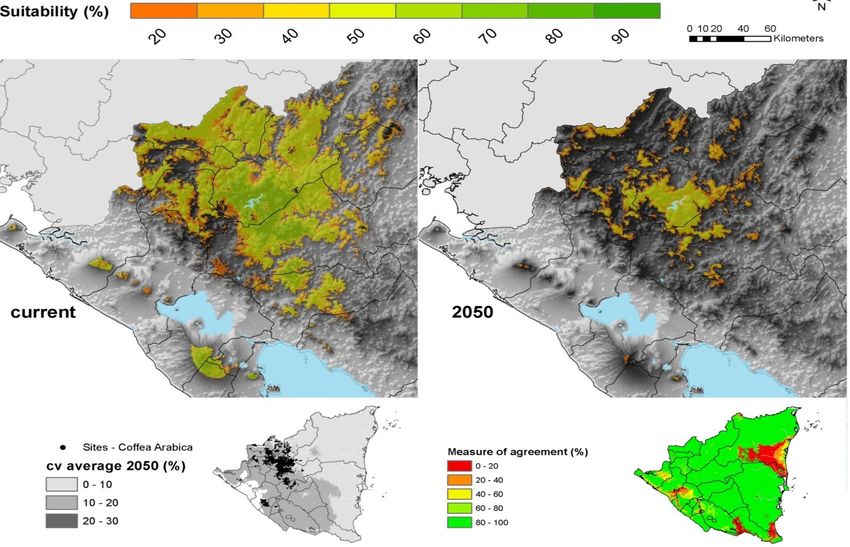
BIOMASS
• Projects based on agribusiness
  residue and urban waste:
   ELECTRICITY GENERATION
    • Sugarcane by products
    • Urban waste for energy ,
      including diesel from plastic

                                      • Ingenio Nicaragua Sugar Estates
                                        (Current): 30 MW
                                      • Ingenio Monterrosa (Current): 30MW
                                      • CASUR –Benjamín Zeledón Sugarmill
                                        (2015): 24MW; US$24.8 millons
                                      • Montelimar Sugarmill (2016): 30MW;
                                        US$27.8 millons
                                       2012-2016: 54MW* y US$52.6 Millones
                                                  TOTAL: 114 MW
*in season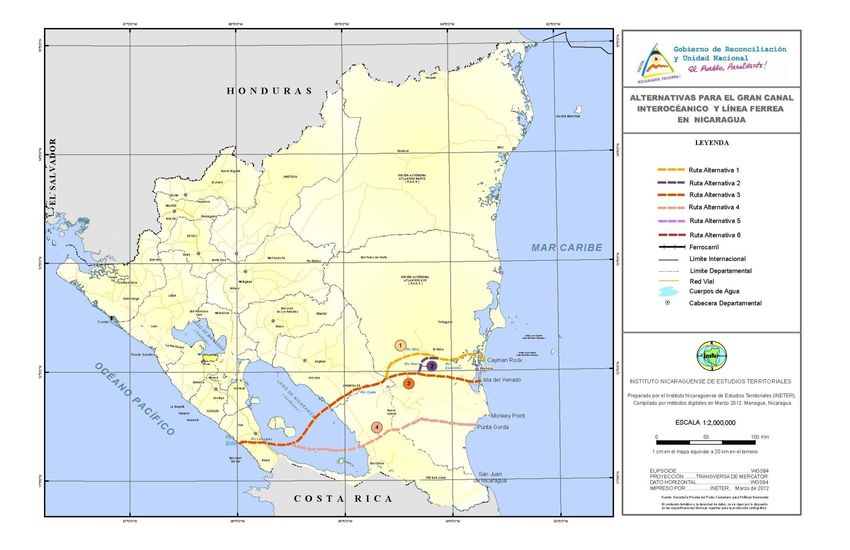
NICARAGUA CONTINUE TAKING ADVANTAGE                                                                                                      3
OF RENEWABLE ENERGY POTENTIAL

 HYDRO - 2,000 MW

 GEO - 1,500 MW

 WIND - 800 MW

 BIO - 200 MW

                                               ESTIMATED
                                                          *                             EFFECTTIVE INSTALLED CAPACITY
                          TYPE OF GENERATION   POTENTIAL*     INSTALLED CAPACITY (MW)                                 EXPLOITATION PCT (%)
                                                                                                     (MW)
                                                  (MW)
                                   Hydro          2,000                104.8                        100                     5.24%
                                 Geothermal       1,500               153.54                       99.3                     10.24%
                                   Wind            800                141.60                       70.8                     17.7%
                                  Biomass          200                115.80                        60                      57.9%
                                   TOTAL          4,500               515.74                       330.1                    11.46% 5
Source: Ministry of Energy and Mining.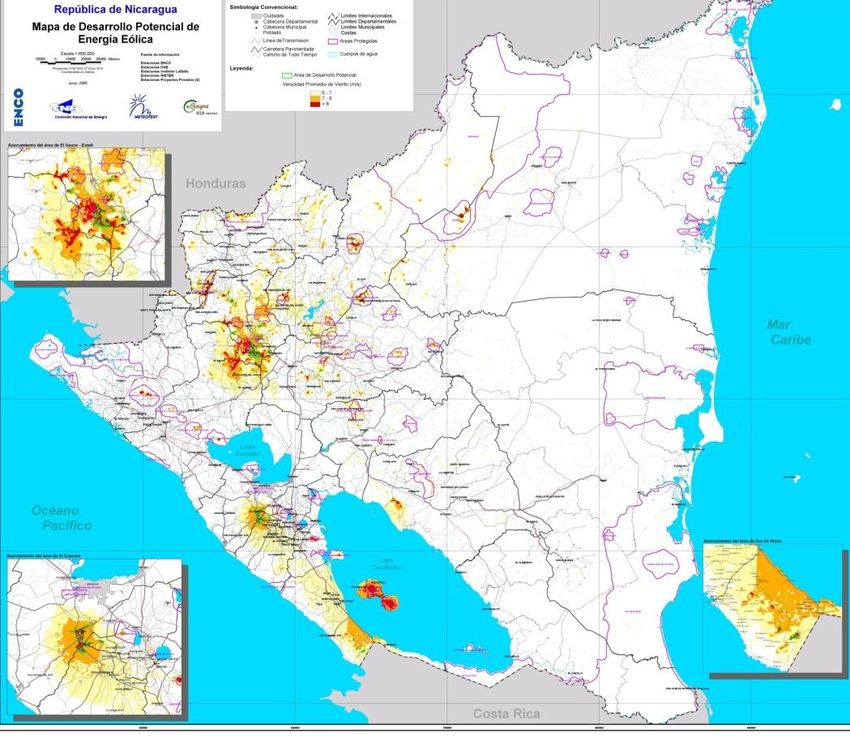
PENESER: Increase in the                                                       Rural Electrification by Extension of Networks
          coverage of electricity
         service in Nicaragua (%)                                                       WesternSector
                                                                                                            Noth Sector1
                                                                                                            600 projects
                                                                                         700 projects
90                                                                         85,1                                            RAAN & RAAS 120
                                                                    83,1
85                                                           81,6                                                              projects
                                                      79,4
80                                             75,4
75                                      72,4
                                                                                                                               Eastern Sector
                                 68,5                                                                                           640 projects
70                        65,6
                   63,4
65                                                                                      Managua 200
            60,4
                                                                                          projects
     57,6
60

55                                                                                          South Sector
                                                                                            360 projects
50
     2006 2007 2008 2009 2010 2011 2012 2013 2014 2015 2016

       NATIONAL PRIORITIZED
     RESEARCH PROJECT ON LOW                                                      Sites in studies
                                                                                  for Small
      COST RENEWABLE ENERGY                                                       Hydroelectric
           FOR ISOLATED                                                           Plants (SHP)

     COMMUNITIES AND TOWNS
                                                                                                                                                6
COMPLEJO INDUSTRIAL “EL SUPREMO
PROYECTO SIEPAC            SUEÑO DE BOLÍVAR”
                                  • Refinería con capacidad de
                                    procesamiento de 140,000 b/d;       Inversión
                                    US$3.6 mil millones                 Total
                                                                        Complejo
                                  • Industria Petroquímica: US$2.8      Industrial:
                                    mil millones                        US$6,700
                                                                        millones

              1794
                                                       •Oleoducto Monkey Point-
                                                       Puerto Sandino: US$270
                                                       millones

                                                       •Proyecto GLP: US$25.9
                                                       millones

                              Planta de Distribución de
                             Combustible Miramar 1.08
                            millones de barriles; US$ 306               Complejo de
                                      millones                       almacenamiento
                                                                          en Corinto

                                                                                7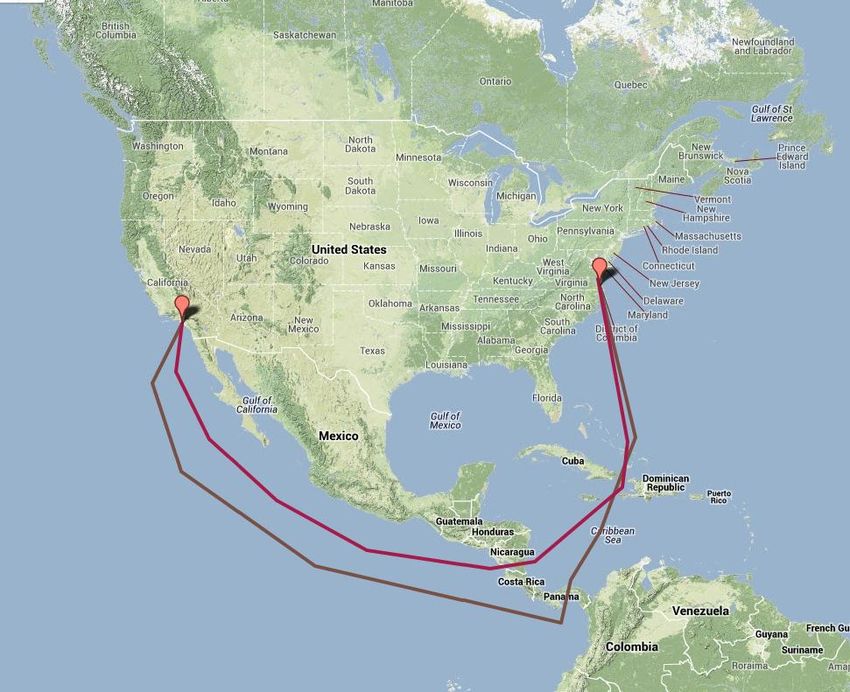
SAVING BY REDUCING OIL IMPORTS DUE TO
          RENEWABLE ENERGY PROJECTS
                   2013-2020
6.000.000                                                           700,0

                                                                    600,0
5.000.000

                                                                    500,0
4.000.000

                                                                    400,0
3.000.000                                                                   Barriles
                                                                    300,0   Millones US$

2.000.000
                                                                    200,0

1.000.000
                                                                    100,0

       0                                                            0,0
            2013   2014   2015   2016   2017   2018   2019   2020
• Brasil presenta la puntuación
  más alta con 2.64.
• Nicaragua ocupa el segundo
  lugar con una puntuación total
  2.13, en gran medida debido a
  que encabezó la lista en
  términos de inversiones en
  energía limpia y disponibilidad
  de microcréditos verdes.
• Panamá fue tercero con una
  marca de 1,97, gracias a un
  importante esfuerzo en la
  gestión de las emisiones de
  gases de efecto invernadero y
  por tener un marco facilitador
  acogedor.

                                    9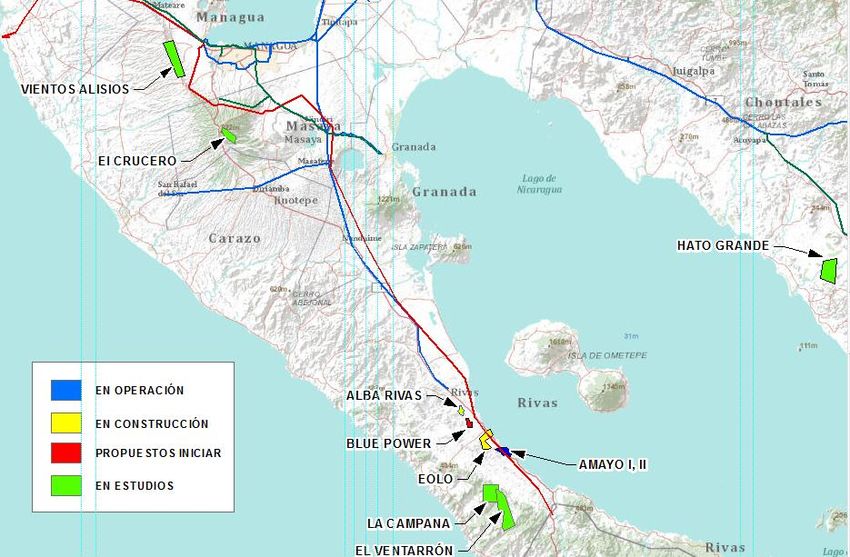
POLICY FRAMEWORK:
NATIONAL HUMAN DEVELOPMENT PLAN 2007/2016

OBJECTIVE:
ECONOMIC GROWTH WITH
MACROECONOMIC STABILITY,
JOB CREATION,
POVERTY AND INEQUALITY REDUCTION,
BOTH ECONOMIC AND GENDER
                                        10
Economic growth and
macroeconomic
stability
• Economic growth Nicaragua leading economic
above 5% in 2011 and growth in Centralamerica
2012
1 digit inflation High export growth: Investment record: More
+19% in 2012/2011 than 3 times that in 2006
Exports doubled between
2012 and 2006 11Fiscal stability
Increased work
High International Reserves: 2.4 times Constant reduction of
the monetary base, allows free exchange
Sustainable fiscal deficit
and currency stability national debt
Formal employment Fewer unemployment
More work: 48.2% more
growth: 52.8% more people
than in 2006
registered than in 2006 12POVERTY REDUCTION
General poverty measured by consumption Extreme poverty measured by consumption
20%
18% 17,20% INIDE
48,3%
16% 15,10%
45,8% 14,60%
14%
FIDEG
42,5% 12%
9,70%
10% 9,00%
8,20%
7,60%
8%
6%
2001 2005 2009 2001 2005 2009 2010 2011 2012
General and extreme poverty measured Greater reduction in rural zones
by income (Percentages) Urbano Rural Less than US$2
Less than US$1.25 a day Less than US$2 PP*
31,6 51,4 PP* a day
a day Less than US$1.25
21 35,7
11,2 20,5
15,9
5,5 10,7 9,8
3,8 1,5
EMNV EMNV Variación EMNV EMNV Variación
EMNV EMNV Variación EMNV EMNV Variación
2005 2009 -5,7 2005 2009 -2,3 -6,1
2005 2009 -9,8 2005 2009
-10,6
-15,7
13INEQUALITY REDUCTION IN NICARAGUA AND LAC
Percentage variation of GINI coefficient in Latin America and the Caribbean 6,60
2005-2009
0,38 0,88
-0,34
-3,99 -3,04 -3,03 -2,46 -1,13
-6,20 -6,04 -5,84
-8,60
-9,80 REDISTRIBUTION POLICIES
• Free health and education: US$ 845.38/year, plus U.S. $ 625.40 in special
cases (surgeries, chronic illness, pregnancy)
-15,10 • Increased minimum real wage +40.67%
Source: ECLAC GINI income in
• Subsidies: US$ 1,110.40/year
Nicaragua
Public Transportation: US$ 321.08/year
2005 0.51
Drinking water: US$ 53.51/year
2009 0.46
House electricity: US$ 160.54/year
GINI consumption ENABAS Food: US$ 200.68/year
2005 0.41* Christian Socialist and Solidarity US$ 374.59/year
Bonus:
2009 0.37*
• Capitalization of poor families:
2010 0.35**
Zero Hunger: Until US$ 1,500.00, average: US$710.00
2011 0.34**
Zero Usury : US$ 250.00 14
*INIDE; **FIDEGMAYOR EQUIDAD DE GÉNERO
Unión Interparlamentaria sobre el porcentaje de mujeres Índice Mundial de Brecha de Género 2012
en los Parlamentos del mundo -Foro Económico Mundial-
Puesto País
Cuba y Nicaragua son los únicos países latinoamericanos
1 Islandia
entre los 10 primeros del mundo con mayor participación
2 Finlandia
de mujeres en sus parlamentos nacionales.
3 Noruega
4 Suecia
Nicaragua pasó del 18.5% en 2006 al 42.3% en 2012
5 Irlanda
6 Nueva Zelanda
LOS 10 PRIMEROS PAÍSES 7 Dinamarca
8 Filipinas
RWANDA (56.3%) 9 Nicaragua
ANDORRA (50.0%) 10 Suiza
CUBA (45.2%) 11 Holanda
SUECIA (44.7%) 12 Bélgica
SEYCHELLES (43.8%) 13 Alemania
FINLANDIA (42.5%) 14 Lesoto
NICARAGUA (42.3%) 15 Letonia
SUDÁFRICA (42.3%) 16 Sudáfrica
HOLANDA (40.7%) 17 Luxemburgo
ISLANDIA (39.7%) 18 Reino Unido
19 Cuba
20 Austria
Nueva Ley: 50%-50% en Asamblea Nacional (llevará
a Nicaragua al segundo lugar mundial) y para Nicaragua sube del lugar 90 en 2007, al
alcaldes, vice alcaldes y concejales número 9 en 2012
15INVESTMENT PORTAFOLIO
US$ 10.9 BILLION IN 2012-2016
ELECTRONICS
MANUFACTURING MINING EXPLORATION
US$ 600 MILLION US$ 359.4 MILLION
TOURISM OIL EXPLORATION
US$ 555 MILLION US$ 353.6 MILLION
TELECOMUNICATIONS PORTS US$ 281 MILLION
US$ 2,018.3 MILLONES
AGROINDUSTRY
REFINERY “SUPREME US$ 334.3 MILLION
DREAM OF BOLÍVAR” HIGHER ECONOMIC
US$ 3,880.4 MILLION GROWTH TO REDUCE FREE ZONES
POVERTY AND US$ 644.6 MILLION
EXPANSION AND ERADICATE EXTREME
TRANSFORMATION OF THE OTHERS
ENERGY MATRIX POVERTY
US$ 121 MILLION
US$ 1,742.0 MILLION 5%, 8%, 10+%
US$2.9B (2007-2020)
THE GRAND INTEROCEANIC CANAL OF NICARAGUA US$ 40 BILLION
16THE INTEROCEANIC GRAND CANAL OF NICARAGUA:
MULTIMODAL LOGISTIC CENTER FOR REGIONAL AND GLOBAL
TRADE
1. A Ship 2. A Port on 3. A port on 4. A Dry Canal 5.A Pipeline
Canal joining the Caribbean the Pacific that is a to connect
the Caribbean coast coast railway the Caribbean
Sea and the between the and the
Pacific Ocean two ports Pacific
6. A Free Trade 7. A Free Trade 8. An 9. Additional 10. A global
Zone on the Zone on the International infrastructure project to
Caribbean Pacific coast Airport required by the ensure
coast (or two…) others Projects integration and
coordination of
all subprojectsTHE WORLD NEEDS A LARGER CANAL
TRIPLE E TYPE SHIPS DOMINATE WORLD SEABORNE TRADE
World seaborne trade Exports of goods in the world, by value,
(Millions of TM) 2000-2020
14.000 12.572
Source: HKND-Group.com
12.000 10.529
10.000 8.839
8.000
6.000 246.5%
3.585 Global maritime
4.000 traffic will grow
2.000 42.2% between
2011 and 2025
0
1988 2011 2019 2025
From US$ 19.9 trillion to US$35.6 trillion in 2020
Transiting the
Panama Canal By 2030 post-Panamax
today vessels could represent
60-70% of world trade
Can transit the
Panama Canal after large ships are displacing smaller
expansion ships in all trade routes due to cost
efficiencies of larger ships
Can not transit by US Army Corps of Engineers, 2012
Panama Canal even
after expansion
18BUQUES DE CONTENEDORES DEL TIPO
MAERSK TRIPLE E
• 400 metros de largo , 59 metros de manga, 73 metros de altura, 12.6 metros
de calado
• Demasiado grande para canal de Panamá
20-30% REDUCTION IN
COST OF METRIC
TONNE SHIPPED
50% REDUCTION
IN GREEN HOUSE
GAS EMISSIONS
PER TONNE
DISEÑO DE BUQUE MAERSK TRIPLE E
19Firms contracted by HKND
The 5th environmental and
Second largest guvernmental
social consultant
construction company of China
World's most
prestigious Advice and strategic
consulting firm government relations
worldwide.
•Group of Xuzhou
Construction
Machinery (XCMG)
•No. 7 construction
machinery industry
of China
•China Ocean
Shipping (Group)
Company (COSCO);
•World leader in
shipping
The 9th law firm by
•International
MEC Mining. income in world Shipping Container
Australia. Marine of
Communications with the China(CIMC);
Open pit
financial media (Bloomberg, •The world's largest
mining and manufacturer of
civil Financial Times, among others) shipping containers
engineering
•National Corporation
Civil Engineering, of China Building
based in Belgium; Washington-based Materials (CNBM)
Specialized in locks and Public relations •Major industry group
of building materials of
canals China
PRIVATE PRIVATE MULTILA ..And other investorS when
BANK OF
HKND ALBA
EQUITY INVESTME TERAL feasibility studies are
FUNDS NT BANK BANKS concluded
20From Financial Times article:
“The public face of the U.S. $ 40 billion to boost relations
between China and Latin America”
“It is one of the largest proposed
infrastructure projects in the world. Only
the feasibility study would cost $ 900
million. And when finished, the Nicaragua
Canal should reduce transportation costs
for shipping oil from Latin America to China.
“At this time, 4,000 people, including
McKinsey staff, British environmental
consultancy ERC, the U.S. firm Kirkland, and
research institutes belonging to the CRC,
who are working on the feasibility study. Mr.
Wang said that HKND could cover with its
own funds, the operating cost up before the
start of the works, scheduled for late 2014”
21GDP GROWTH: NICARAGUA AND PANAMA
Nicaragua's economic growth with Grand Canal
16 (U.S. $ Millions / Variation Percentage) 30.000
14,4
14 PIB 24.889,5
11,9 22.165,5 25.000
Crecimiento
12
19.409,9
10,3 10,1 20.000
10 16.630,9 8,8
8 13.847,2 15.000
12.109,0
10.507,7 11.243,3
6 9.636,2 5,5
8.586,7 5,0 10.000
5,4 5,2
4
3,6
5.000
2
0 0
2010 2011 2012 2013 2014 2015 2016 2017 2018 2019
Economic Growth in Panama Canal expansion
45 (GDP U.S. $ Billion, Growth in Percent) 41,49 14
40 PIB en US$ miles de millones (Eje 12,11 36,25 12
Izquierdo)
10,85
35 31,32 10,67
Crecimiento (Eje derecho) 10,12 10
30 27,05 8,98
8,53 23,00 24,16
25 7,52 7,45
8 %
7,19 19,79
20 17,14 6
14,18 15,47
15 11,62 11,81 12,27 12,934,21
3,86 4
10
2,72
2,23 2
5
0,57
0 0
2000
2001
2002
2003
2004
2005
2006
2007
2008
2009
2010
2011
2012
2013
Fuente: FMI
22
Notice of the extension The economic crisisMODEL BASED ON CHRISTIAN VALUES, SOCIALIST IDEALS AND SOLIDARITY
PRACTICES
CAPACITY BUILDING
RECOVERING RESTORATION
VALUES KNOWLEDGE AND OF RIGHTS
OVERCOMING BUILDING
EXCLUSION & SKILLS FOR INCLUSION &
TRAINING AND
VICIOUS DEVELOPMENT SCIENCE, VIRTUOUS
SKILLS
CIRCLES DEVELOPMENT, TECHNOLOGY CIRCLES
TECHNOLOGY AND AND INNOVATION
LANGUAGES
POVERTY AND
INEQUALITY
REDUCTION PROGRAMS,
CITIZEN POWER CAPITALIZATION
AND PUBLIC AND SUBSIDIES
PARTICIPATION
MACROECONOMIC
STABILITY AND
ECONOMIC GROWTH WAGE
GRAND ALLIANCE CONSENSUS; 1
WORKERS- DIGIT INFLATION;
PRODUCERS AND HIGH RESERVES,
ENTREPRENEURS FREE EXCHANGE
-GOVERNMENT AND DEBTS
REDUCTION
SOCIAL COHESION
AND DYNAMIC,
POSITIVE
JOB CREATION PRODUCTIVE INVESTMENTS
INVESTMENT CHALLENGE:
CHALLENGE: LOWER COST OF LIVING CLIMATE ENERGY INVESTMENTS WORLD
CLIMATE
PUBLIC SAFETY INFRAESTRUCTURE ECONOMY
CHANGE
PROTECTION OF MOTHER EARTH AND
ADAPTATION TO CLIMATE CHANGE 23SURVEY OF COST OF LIVING IN LATIN THE BEST PUBLIC SAFETY IN CENTRAL
AMERICA: MANAGUA IN NICARAGUA AMERICA
(POSITION 213) ONE OF THE CITIES WITH
Homicide Rates in Central America
LOW COST OF LIVING 91,6 (per 100,000 inhabitants)
84,0
2011 2012
69,2
38,5
34,0
30,0
15,4 18,0
12,6 11,0 10,0 8,9
Honduras Guatemala El Salvador Panamá Nicaragua Costa Rica
Vehicular theft in Central America
8.095
7.334 2010 2011
5.475 5.222
3.800
3.130 2.811
1.035
366 720 387 272
Guatemala Honduras Costa Rica El Salvador Panamá Nicaragua
Safety Index 2012: Nicaragua is the
second safest country in Central
America and the third in Latin
America
24
Source: Economist Intelligence Unit (EIU), 2012 Security Risk ReportGlobal Climate Risk Index GERMANWATCH
25THANK YOU
26CLIMATE CHANGE REFUGEES
Villa Dignidad, Sabana Grande, Managua
ADAPTATION Villa Dignidad: 935 families (5,600
persons) in risk situations due to
•New human settlements floods in 2011, left refuges for new
homes in Villa Dignidad.
•New infraestructure FINANCED WITH NATIONAL
•Reconversion of agricultural BUDGET AND ALBA FUNDS
economy
•Dry zone transformation
27ENVIRONMENTAL ADAPTATION AGENDA
Stopping deforestation
(between 50 and 70 thousand Stop
hectares per year), and sedimentati
strengthen reforestation (15 on present
and future
000 ha per year). of Lake
Nicaragua
Stop the advance of the agricultural
frontier (cutting of forest for
agriculture)
• Protection of local populations from
Integrated watershed management flood or drought.
(massive reforestation, reinjection • Environmental monitoring, climate and
of water, biodiversity protection) integrated health.
Strengthening • ECLAC estimates that in 2011
of protected
Nicaragua had adaptation
needs over USD 1,900 Million.
areas— 20%
territory
The Canal is a water project whose viability depends on water, massive reforestation and
watershed management.
28THANK YOU
29ENABLING ENVIRONMENT
MODEL BASED ON CHRISTIAN VALUES, SOCIALIST
IDEALS AND SOLIDARITY PRACTICES
OVERCOMING EXCLUSION AND THE VISCIOUS
CIRCLES THAT TRAP FAMILIES IN POVERTY AND
CONTRIES IN UNDERDEVELOPMENT BY
CONSTRUCTING INCLUSION AND VIRTUOUS,
SYNERGYSTIC CIRCLES THAT GENERATE SOCIAL
COHESION
Major Challenge: Always human development
30INVESTMENT OPPORTUNITIES IN HYDROPOWER
Centrales en Operación
- Santa Bárbara
- Centroamérica
- Las Cañas
- El Sardinal
- El Wawule
- Siempre Vivas
- Salto Grande
Proyectos en Construcción
- Pantasma
- Larreynaga
- Tumarín
Proyectos con Licencia
- Salto Y-Y
- Piedra Puntuda
- El Diamante
Proyectos Candidatos
- Boboké
- Copalar Bajo
- Consuelo
- Pajaritos
- La Estrella
- Valentín
- Piedra Fina
- Brito
- Corriente
Volcán Casitas SanLira
Cristóbal. Fuente: INETER
31GEOTHERMAL POTENTIAL ESTIMATED AT 1,500 TO 2,000 MW
32WIND POTENTITAL IN NICARAGUA
INVESTMENT OPPORTUNITIES
IN WIND PROJECTSMAP OF SOLAR RADIATION IN NICARAGUA
POVERTY REDUCTION
   General poverty measured by consumption                            Extreme poverty measured by consumption
                                                               20%
                                                               18%                17,20%                    INIDE
                              48,3%
                                                               16%     15,10%
         45,8%                                                                                 14,60%
                                                               14%
                                                                                                                            FIDEG
                                                  42,5%        12%
                                                                                             9,70%
                                                               10%                                    9,00%
                                                                                                                    8,20%
                                                                                                                             7,60%
                                                               8%
                                                               6%
         2001                 2005                2009                  2001      2005       2009       2010        2011     2012

     General and extreme poverty measured                              Greater reduction in rural zones
            by income (Percentages)                                  Urbano         Rural                       Less than US$2
Less than US$1.25 a day                   Less than US$2 PP*
                                  31,6                                                                  51,4    PP* a day
                                          a day                Less than US$1.25
                                            21                                                                       35,7

  11,2                                                               20,5
                                                                                                    15,9
                5,5                                                             10,7                            9,8
                                                                3,8         1,5
 EMNV       EMNV      Variación   EMNV    EMNV    Variación
                                                                EMNV        EMNV       Variación    EMNV        EMNV        Variación
  2005       2009        -5,7      2005    2009                                        -2,3                                  -6,1
                                                                 2005        2009           -9,8     2005        2009
                                                    -10,6
                                                                                                                                -15,7

                                                                                                                              35
CLIMATE CHANGE EFFECTS
EL NIÑO: AVERAGE PRECIPITATION (May-July) LOSSES 2005-2012 HURRICANES
• 560,000 Mz. of
basic grains
• 9% of the area
planted
• US$ 206.3 million
average annual loss
• 3.52 percentage
points of GDP
CHANGE IN THE SUITABILITY OF COFFEE FOR THE YEAR 2050
LA NIÑA: RANGE OF PRECIPITATION DECILE (May-October)
36PETROCARIBE MECHANISM
Nicaragua has a guaranteed supply
BANK OF ALBA 100% of its oil needs, with 25
(Venezuela)
years deferred payment with two-
year grace period and 2% interest
than half of the oil bill.
CORRESPONDEN With half deferred funds invested
T BANK OF ALBA
(CARUNA R.L) 62% in socio-productive projects
that stimulate the economy and
allow the returns to amortize
payments in the form and time.
The other 38% is used to fund
social projects not returnable, fully
or partially.PETROCARIBE ACCORD FINANCING
PETROCARIBE/ALBA-TCP (millons de dollares)
2007 2008 2009 2010 2011 2012
Annual 184.9 461.0 443.0 533.0 609.3 765.6
Acumulated 184.9 645.9 1,088.9 1,621.9 2,231.2 2,996.8
PETROCARIBE/ALBA-TCP OIL ACCORDS (millions USD)
900
800 765,6
700
609,3
600
533,0
500 461,0 443,0
400
300
184,9
200
100
0
2007 2008 2009 2010 2011 2012
Fuente: BCNCANAL ROUTES
US$ 9.8 BILLION IN 2012-2016
ELECTRONICS
MANUFACTURING MINING EXPLORATION
US$ 600 MILLION US$ 359.4 MILLION
TOURISM OIL EXPLORATION
US$ 555 MILLION US$ 353.6 MILLION
TELECOMUNICATIONS PORTS US$ 281 MILLION
US$ 2,018.3 MILLON
AGROINDUSTRY
REFINERY “SUPREME US$ 334.3 MILLION
DREAM OF BOLÍVAR”
HIGHER ECONOMIC FREE ZONES
US$ 3,880.4 MILLION
GROWTH THAT
US$ 644.6 MILLION
EXPANSIÓN AND CONTRIBUTES TO
TRANSFORMATION OF ERADICATE EXTREME OTHERS
THE ENERGY MATRIX POVERTY US$ 121 MILLION
US$ $ 1,742.0 MILLION
THE GRAND INTEROCEANIC CANAL OF NICARAGUA US$ 40 MIL MILLONES:
Wet and dry Canal, Airport, Railway, Free Zones in the Caribbean and Pacific, and Pipeline 39WORLD SEABORNE TRADE
GEOGRAPHICAL PROXIMITY
Norfolk – Long Beach route
(Distances between Panama Canal and Grand Canal
of Nicaragua)
Long Norfolk,
Beach, VA
CA
Time saving by the Nicaraguan Canal: Up
to 12 trips instead of 9 Route by Nicaragua is
943 Km (509 Mi) closer
– Venezuela-Japan: 14.4 days
– New York-Japan: 10.9 days
– Chile-Netherlands: 11.4 days
Ruta por
– Chile-New York: 11.1 days Gran Canal
de
– Brazil-California: 4 days Nicaragua:
Ruta por
7,955 Km
Canal de
(4,295 Mi)
Monetary saving by the Nicaraguan Panamá:
8,898 Km
Canal: Up to US$ 2 million per round trip (4,804 Mi)
40PANAMA CANAL EXPANSION: MAIN IMPACTS ON ECONOMY
GDP Panama: Actual data and projections with and Employment trends with and without expansion
without Expansion (Percentage Points) of the Canal
14
12,1 Con expansión
12
10,7 sin Expansión
10
8,53
8 7,5
6,7
6,0 6,0
6
3,6 3,8 3,8 3,8 3,8 3,8 3,8
4 2,9 3,2
2
2025: 252,437 new additional employments
0
2000 2005 2006 2007 2010 2012 2015 2020 2025
Source: PCA, ECLAC & IMF Extreme Poverty in Panama
(Percentage Points)
Panama: Government income increase 20
300 compared to 2006 17,6
18
(Cumulative percentage variation) 255 15,7 15,3 15,3
16
250
214 14 12,2
196 11,5
200 12 10,4
176
155 10
150 137 8
118
6
100 83
4
60
38 41 2
50 24
0
0 2006 2007 2008 2009 2010 2011 2012
2007 2008 2009 2010 2011 2012 2013 2014 2015 2016 2017 2018 General poverty was reduced from 38.3% in 2006 to 25.8% in 41
2012
Source: Ministry of Economy of Panamá & IMFINTEROCEANIC GRAND CANAL OF NICARAGUA: MAIN ECONOMIC IMPACTS
EXPECTED IN NICARAGUA
Nicaragua's Economic Growth with and without Canal FORMAL EMPLOYMENT IN NICARAGUA 2012-2018
16 Nicaragua (con Canal)
(Percentage Points) 15,1
5th year (2018) 1.927.527
14 Nicaragua 12,6 2.000.000
• More formal jobs than
12 10,8 10,7 1.800.000 casual ones. 1.608.402
+1,264,535
10 9,2 1.600.000 • 51.10% in 2018
• 20.79% in 2012 1.303.783
+945,410
8 1.400.000
5,4 5,2 1.200.000 1.018.581
+640,791
6 5,0 4,5 4,7 4,9
4,0 4,2 4,0 4,0 848.630
3,6 1.000.000
+355,589
4
800.000 623.458 662.992
+185,638
2
600.000
0
400.000
-2 2007 2008 2009 2010 2011 2012 2013 2014 2015 2016 2017 2018
+6.3 +10.4 +7.7 +6.7 +5.2 200.000
-2,2
-4 Source: PEF, IMF & Own estimates -
Begins 2012 2013 2014 2015 2016 2017 2018
construction General Poverty in Nicaragua Extreme Poverty in Nicaragua
(Percentage points) (Percentage points)
The increase in revenue, would be a source of funding to fight 403.583 people out of
The multiplier effect
poverty. general poverty by
will further reduce
2018
extreme poverty in
later years
2013 2018
2012 Estimated Projected
income US$ Income
16.46% of GDP 1,897.40 US$ 4,081.25 353.935 people
million million out of extreme
poverty by 2018
+115.10% more than 2013
We are working with ECLAC to estimate the effects of the Grand Interoceanic Canal on all sectors of the Nicaraguan economy, on
42
Central America and South America.GDP GROWTH: PANAMÁ AND NICARAGUA
GDP growth of Nicaragua with Canal
PIB US$ Miles de Millones Crecimiento
30,00 16,0%
15,1% 24,80 14,0%
25,00
12,6% 21,81 12,0%
20,00 10,8% 18,82 10,7%
15,87 9,2%10,0%
15,00 12,96 8,0%
10,50 11,13
6,0%
10,00
5,2% 4,2% 4,0%
5,00
2,0%
0,00 0,0%
2012 2013 2014 2015 2016 2017 2018
GDP growth of Panamá with Canal Expansíon
45 (PIB US$ Miles de Millones, Crecimiento en Porcentaje) 41,49 14,0
40 PIB en US$ miles de millones (Eje 12,11 36,25
10,85 12,0
35 Izquierdo)
31,32 10,67
Crecimiento (Eje derecho) 10,12 10,0
US$ 30 27,05
8,53 8,98
Miles de 23,00 24,16 8,0
Millones
25
7,19 7,52
19,79 7,45 %
20 17,14 6,0
14,18 15,47
15 11,62 11,81 12,27 12,934,21
3,86 4,0
10
2,72
2,23 2,0
5
0,57
0 0,0
2000
2001
2002
2003
2004
2005
2006
2007
2008
2009
2010
2011
2012
2013
Expansión Fuente: FMI
announcement Economic crisis 43COMPANIES CONTRACTED BY HKND
HKND
CHINA RAILWAY
CONSTRUCTION
CORPORATION
LIMITED (CRCC)
ENVIRONMENT BANK OF ALBA
MCKINSEY & AL RESOURCES
MULTILATERAL BANKS CO. MANAGEMENT
(ERM)
HKND
Eutelsat McLarty
OTHERS IN FUTURE, WHEN PRIVATE EQUITY FUNDS
FEASIBILITY STUDIES ARE HARBOUR
COMPLETED KIRKLAND & GROUP
ELLIS LLP.
PRIVATE INVESTMENT
BANK
44FIRMS CONTRACTED BY HKND
Top 10
Second largest Most prestigious Fifth global High-level Most prestigious
state-owned consulting firm in the environmental intervention; firm in Chicago.
construction world. and social Fifth most
Advice on prestigious law firm
company in China; consulting firm,
100 offices in 50 government in USA.
ranked by EHS
countries and 17,000 relations around Ninth largest firm by
Journal.
Sixth construction employees the world. revenue in the
worldwide; More than 140 world.
contractor in the Founded in 1998.
offices in 39 Offices in Chicago,
world; Clients: AT & T, BBC, Its President and
countries, and Hong Kong, London,
Railways, General Electric, CEO is Thomas
more than 5,000 LA, NY, Munich,
highways, Johnson & Johnson, "Mack" McLarty,
workers. Shanghai and
buildings, Siemens, Home former Chief of
Depot, Bank of It has worked with the White House Washington, DC.
municipal utilities,
England, Mitsubishi, more than 50% of Staff during the Clients: General
water services,
the city of Chicago, the Fortune Global Clinton Motors, Motorola,
electricity,
the UK Government, 500. Administration. Apple, Intel,
bridges, tunnels
and airports, etc. the Government of Samsung Electronics,
Mexico and Taiwan. Siemens.
45FIRMS CONTRACTED BY HKND
Public relations Public Eutelsat based in Paris, Civil Engineering, MEC Mining,
firm based in Relations with founded in 1977. based in Belgium; Australia.
Washington DC. economic 31 communications It specializes in Open pit mining
Management, media satellites. hydraulic locks and and civil
critical public (Blommberg, canals, including engineering.
Financial 4,500 television
relations and channels and 1,000 feasibility Design of
communications Times, others). assessment and
radio stations. excavations,
consultancies. 104 countries conceptual design. disposal area,
on five Other services: fixed
Clients: and mobile Worked locks for assistance in
Biotechnology continents. the Panama Canal equipment
telecommunications,
Industry, Pfizer, Access to TV share markets, expansion; selection, cost
Shure, Revolution resources of corporate networks, Antwerp, Belgium; estimation and
Health Group. the best public and broadband Seville, Spain. planning.
Founded in 2001 relations firms markets for Internet
by Joel Johnson. in the world. service
CEO is Michel de Rosen.From Financial Times article:
“The public face of the U.S. $ 40 billion to boost relations
between China and Latin America”
“It is one of the largest proposed
infrastructure projects in the world. Only
the feasibility study would cost $ 900
million. And when finished, the Nicaragua
Canal should reduce transportation costs
for shipping oil from Latin America to China.
“At this time, 4,000 people, including
McKinsey staff, British environmental
consultancy ERC, the U.S. firm Kirkland, and
research institutes belonging to the CRC,
who are working on the feasibility study. Mr.
Wang said that HKND could cover with its
own funds, the operating cost up before the
start of the works, scheduled for late 2014”
47Economic growth and
macroeconomic
stability
• Economic growth Nicaragua leading economic
above 5% in 2011 and growth in Centralamerica
2012
1 digit inflation High export growth: Investment record: More
+19% in 2012/2011 than 3 times that in 2006
Exports doubled between
2012 and 2006 48POLICY FRAMEWORK:
NATIONAL HUMAN DEVELOPMENT PLAN 2007/2016
OBJECTIVE:
ECONOMIC GROWTH WITH
MACROECONOMIC STABILITY,
JOB CREATION,
POVERTY AND INEQUALITY REDUCTION
49Fiscal stability
Increased work
High International Reserves: 2.4 times Constant reduction of
the monetary base, allows free exchange
Sustainable fiscal deficit
and currency stability national debt
Formal employment Fewer unemployment
More work: 48.2% more
growth: 52.8% more people
than in 2006
registered than in 2006 50POVERTY REDUCTION
General poverty measured by consumption Extreme poverty measured by consumption
20%
18% 17,20% INIDE
48,3%
16% 15,10%
45,8% 14,60%
14%
FIDEG
42,5% 12%
9,70%
10% 9,00%
8,20%
7,60%
8%
6%
2001 2005 2009 2001 2005 2009 2010 2011 2012
General and extreme poverty measured Greater reduction in rural zones
by income (Percentages) Urbano Rural Less than US$2
Less than US$1.25 a day Less than US$2 PP*
31,6 51,4 PP* a day
a day Less than US$1.25
21 35,7
11,2 20,5
15,9
5,5 10,7 9,8
3,8 1,5
EMNV EMNV Variación EMNV EMNV Variación
EMNV EMNV Variación EMNV EMNV Variación
2005 2009 -5,7 2005 2009 -2,3 -6,1
2005 2009 -9,8 2005 2009
-10,6
-15,7
51INEQUALITY REDUCTION IN NICARAGUA AND LAC
Percentage variation of GINI coefficient in Latin America and the Caribbean 6,60
2005-2009
0,38 0,88
-0,34
-3,99 -3,04 -3,03 -2,46 -1,13
-6,20 -6,04 -5,84
-8,60
-9,80 REDISTRIBUTION POLICIES
• Free health and education: US$ 845.38/year, plus U.S. $ 625.40 in special
cases (surgeries, chronic illness, pregnancy)
-15,10 • Increased minimum real wage +40.67%
Source: ECLAC GINI income in
• Subsidies: US$ 1,110.40/year
Nicaragua
Public Transportation: US$ 321.08/year
2005 0.51
Drinking water: US$ 53.51/year
2009 0.46
House electricity: US$ 160.54/year
GINI consumption ENABAS Food: US$ 200.68/year
2005 0.41* Christian Socialist and Solidarity US$ 374.59/year
Bonus:
2009 0.37*
• Capitalization of poor families:
2010 0.35**
Zero Hunger: Until US$ 1,500.00, average: US$710.00
2011 0.34**
Zero Usury : US$ 250.00 52
*INIDE; **FIDEGMAYOR EQUIDAD DE GÉNERO
Unión Interparlamentaria sobre el porcentaje de mujeres Índice Mundial de Brecha de Género 2012
en los Parlamentos del mundo -Foro Económico Mundial-
Puesto País
Cuba y Nicaragua son los únicos países latinoamericanos
1 Islandia
entre los 10 primeros del mundo con mayor participación
2 Finlandia
de mujeres en sus parlamentos nacionales.
3 Noruega
4 Suecia
Nicaragua pasó del 18.5% en 2006 al 42.3% en 2012
5 Irlanda
6 Nueva Zelanda
LOS 10 PRIMEROS PAÍSES 7 Dinamarca
8 Filipinas
RWANDA (56.3%) 9 Nicaragua
ANDORRA (50.0%) 10 Suiza
CUBA (45.2%) 11 Holanda
SUECIA (44.7%) 12 Bélgica
SEYCHELLES (43.8%) 13 Alemania
FINLANDIA (42.5%) 14 Lesoto
NICARAGUA (42.3%) 15 Letonia
SUDÁFRICA (42.3%) 16 Sudáfrica
HOLANDA (40.7%) 17 Luxemburgo
ISLANDIA (39.7%) 18 Reino Unido
19 Cuba
20 Austria
Nueva Ley: 50%-50% en Asamblea Nacional (llevará
a Nicaragua al segundo lugar mundial) y para Nicaragua sube del lugar 90 en 2007, al
alcaldes, vice alcaldes y concejales número 9 en 2012
53ENABLING ENVIRONMENT
MODEL BASED ON CHRISTIAN VALUES, SOCIALIST
IDEALS AND SOLIDARITY PRACTICES
OVERCOMING EXCLUSION AND THE VISCIOUS
CIRCLES THAT TRAP FAMILIES IN POVERTY AND
CONTRIES IN UNDERDEVELOPMENT BY
CONSTRUCTING INCLUSION AND VIRTUOUS,
SYNERGYSTIC CIRCLES THAT GENERATE SOCIAL
COHESION
Major Challenge: Always human development
54MODEL BASED ON CHRISTIAN VALUES, SOCIALIST IDEALS AND SOLIDARITY
PRACTICES
CAPACITY BUILDING
RECOVERING RESTORATION
VALUES KNOWLEDGE AND OF RIGHTS
OVERCOMING BUILDING
VICIOUS SKILLS FOR VIRTUOUS
TRAINING AND
CIRCLES DEVELOPMENT SCIENCE, CIRCLES
SKILLS
DEVELOPMENT, TECHNOLOGY
TECHNOLOGY AND AND INNOVATION
LANGUAGES
POVERTY AND
INEQUALITY
REDUCTION PROGRAMS,
CITIZEN POWER CAPITALIZATION
AND PUBLIC AND SUBSIDIES
PARTICIPATION
MACROECONOMIC
STABILITY AND
ECONOMIC GROWTH WAGE
GRAND ALLIANCE CONSENSUS; 1
WORKERS- DIGIT INFLATION;
PRODUCERS AND HIGH RESERVES,
ENTREPRENEURS FREE EXCHANGE
-GOVERNMENT AND DEBTS
REDUCTION
SOCIAL COHESION
AND DYNAMIC,
POSITIVE
JOB CREATION PRODUCTIVE INVESTMENTS
INVESTMENT CHALLENGE:
CHALLENGE: LOWER COST OF LIVING CLIMATE ENERGY INVESTMENTS WORLD
CLIMATE
PUBLIC SAFETY INFRAESTRUCTURE ECONOMY
CHANGE
PROTECTION OF MOTHER EARTH AND
ADAPTATION TO CLIMATE CHANGE 55SURVEY OF COST OF LIVING IN LATIN THE BEST PUBLIC SAFETY IN CENTRAL
AMERICA: MANAGUA IN NICARAGUA AMERICA
(POSITION 213) ONE OF THE CITIES WITH
Homicide Rates in Central America
LOW COST OF LIVING 91,6 (per 100,000 inhabitants)
84,0
2011 2012
69,2
38,5
34,0
30,0
15,4 18,0
12,6 11,0 10,0 8,9
Honduras Guatemala El Salvador Panamá Nicaragua Costa Rica
Vehicular theft in Central America
8.095
7.334 2010 2011
5.475 5.222
3.800
3.130 2.811
1.035
366 720 387 272
Guatemala Honduras Costa Rica El Salvador Panamá Nicaragua
Safety Index 2012: Nicaragua is the
second safest country in Central
America and the third in Latin
America
56
Source: Economist Intelligence Unit (EIU), 2012 Security Risk ReportYou can also read