Polar Capital Funds plc Emerging Market Stars Fund Northern Powerhouse - Northern Powerhouse Summit
←
→
Page content transcription
If your browser does not render page correctly, please read the page content below

Polar Capital Funds plc
Emerging Market Stars Fund

Northern Powerhouse
February 2019

“The Sustainable Emerging
Market Fund”

This presentation is for one-on-one use with non-US professional investors only.
Not for onward distribution.
www.polarcapital.co.uk
                                                                                   22/01/2019
Introduction – Emerging Market Stars Fund

                                                   • Emerging markets, fundamental, stock picking, long only
                                                   • High conviction portfolio of typically 45–65 stocks
         Product
                                                   • Targeting 3% annual excess (net of fees) on a 3-year rolling basis
      characteristics
                                                   • High active share
                                                   • Growth and valuation mindset with a quality bias and ESG integration

                                                   • Experienced team of five investment professionals with extensive emerging
                                                      markets knowledge
       Team and
                                                   • Each team member has individual responsibilities while working collaboratively
    decision-making
                                                   • Strong analytical platform
                                                   • Lead portfolio manager is the final decision maker

                                                   • Stock-picking approach
                                                   • Long-term mindset while considerate of the medium term
             Value                                 • ESG fully integrated into the fundamental analysis
          proposition                              • Strong emphasis on valuation (EVA approach) and thorough due diligence process
                                                   • Long-proven track record with top-quartile performance
                                                   • Deliver sustainable shareholder value generation
 Source: Polar Capital.

This presentation is for one-on-one use with non-US professional investors only. Not for onward distribution.                         2
Please refer to the Important Information at the end of this presentation.
Investment Team
Jorry Rask Nøddekær                                                                         •   MSc Economics and Finance (Aarhus University)
Head of EM & Asia team
Lead Portfolio Manager                                                                      •   19 years’ experience
                                                                                            •   BankInvest, New Star, F&C, Nordea Asset Management

Michael Wang                                                                                •   BSc Economics (Yale University)
Deputy Portfolio Manager
                                                                                            •   MPhil (Cambridge University) and D.Phil Candidate (Oxford University)
                                                                                            •   CFA
                                                                                            •   16 years’ experience
                                                                                            •   ING-Barrings, Morgan Stanley Research, Amiya Capital, Nordea Asset Management

Jerry Wu                                                                                    •   BSc Economics (Peking University)
Portfolio Manager/Analyst
                                                                                            •   MSc Management (London Business School)
                                                                                            •   CFA
                                                                                            •   8 years’ experience
                                                                                            •   BlackRock Investment Management, Generation Investment Management,
                                                                                                Nordea Asset Management

Peter Andersen                                                                              •   MSc Economics and Finance (Aarhus University)
Analyst
                                                                                            •   Passed all three levels of the CFA programme
                                                                                            •   6 years’ experience
                                                                                            •   Jyske Markets, Nordea Asset Management

Andy Chen                                                                                   •   BSc Accounting and Finance (Lancaster University)
Head of Research, China
                                                                                            •   MPhil Real Estate Finance (Cambridge University)
(Based in Shanghai)
                                                                                            •   10 years’ experience
                                                                                            •   Laxey Partners

This presentation is for one-on-one use with non-US professional investors only. Not for onward distribution.                                                                   3
Please refer to the Important Information at the end of this presentation.
Mindset And Process Structure
We identify companies that we believe will generate significant Delta (                                                                          ) in
Economic Value Added (EVA) relative to current market expectations

                                                                         3. EVA Valuation
                                                                     EVA valuation approach
                                                            (Identify what is priced in by the market)

                                                                                 EVA GAP
                                                                          (Shareholder Value)

                    1. Pockets of Growth                                                                               2. EVA Creation Factors
                   Looking for structural growth                                                                  The company’s competitiveness within the
                  areas and the companies that                                                                  industry – analysing company strategies and
                       can capitalise on it                                                                     the opportunities for EVA creation – including
                                                                                                                   integrated ESG analysis, identifying the
                                                                                                                 Sustainability Delta (    ) for the company

 Source: Polar Capital.

This presentation is for one-on-one use with non-US professional investors only. Not for onward distribution.                                                    4
Please refer to the Important Information at the end of this presentation.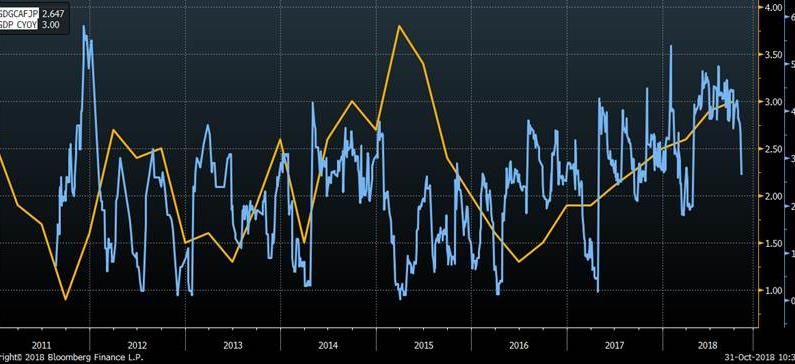
Process
                                                                                                Research and
           Idea Generation                           Research and
                                                                                               Stock Selection                  Portfolio Construction
        Finding our Pockets of                      Stock Selection
                                                                                                 Valuation &                           and Risk
                Growth                            Finding EVA creators
                                                                                              identifying upside

                                                        Demographics                 Technology                  Politics &        Sustainability
                                                                                                                Globalisation

                                                                        Industry Dynamics                  Country Growth
                                                                                                             Dynamics

                                                     Consumer         Urbanisation      Investment          Rising Disp.        Monetary &
                                                    Preferences                            Cycle              Income            Fiscal policy

                                 We search for Pockets of Growth across emerging markets
 Source: Polar Capital.

This presentation is for one-on-one use with non-US professional investors only. Not for onward distribution.                                            5
Please refer to the Important Information at the end of this presentation.
Process
                                                                                                Research and
           Idea Generation                           Research and
                                                                                               Stock Selection               Portfolio Construction
        Finding our Pockets of                      Stock Selection
                                                                                                 Valuation &                        and Risk
                Growth                            Finding EVA creators
                                                                                              identifying upside

Industry key success factors – the EVA Creation Wheel
The Sustainability Delta
The longer-term sustainability of the business model is essential for the EVA creation
We conduct a full Sustainability assessment – including a detailed analysis of Material
ESG factors – but as part of an integrated company analysis
We have developed a proprietary model to analyse and identify the Sustainability Delta
for a company around its stakeholders
The key factors being:
• Impact to Progress
• Material ESG Issues
• Business Ethics                                                                                               Impact to progress (35%)
• Full integration comes through key input to the EVA model
       • Sustainability of operations
              • → Fade factor
       • Risk – risk to operations as well as reputational risk
              • → WACC adjustment                                                            Business                                       Material ESG
                                                                                            ethics (15%)                                    issues (50%)
 Source: Polar Capital.

This presentation is for one-on-one use with non-US professional investors only. Not for onward distribution.                                              6
Please refer to the Important Information at the end of this presentation.
Process
                                                                                                       Research and
           Idea Generation                               Research and
                                                                                                      Stock Selection                        Portfolio Construction
        Finding our Pockets of                          Stock Selection
                                                                                                        Valuation &                                 and Risk
                Growth                                Finding EVA creators
                                                                                                     identifying upside

Valuation: exploiting the EVA Gap – what is in the price?                                                                    EVA generation

• Focus on long-term fundamentals – key drivers analysed in our EVA Creation                                                                                                         EVA
  Wheel model                                                                                                                                                                        Gap
                                                                                                                                                              Market view
• The EVA delta is often revealed over the company’s capital allocation process
  (Capex/investment cycle)

• Comes with uncertainty, risk and plays out over the full investment
                                                                                                                                                                            Time/Scenarios
  cycle – foundation for finding our under-priced EVA delta

• Our analysis from the EVA Creation wheel model gives us a better forecast of
  the future outcome of the company's growth strategies and opportunities                                                    EVA valuation levels (V1, V2, and V3)
Distribution curve from the EVA modelling                                                                                     7,000,000

• Better understand risk/reward outcomes                                                                                      6,000,000

                                                                                                                              5,000,000
• Where do we have a different view from the market?
                                                                                                                              4,000,000
• Detailed forecasting with a long-term focus but we acknowledge we do
                                                                                                                              3,000,000
  not have perfect foresight – work with an EVA distribution curve
                                                                                                                              2,000,000
• V2: Key valuation level – pricing our key growth drivers
                                                                                                                              1,000,000

• V1: What is the valuation if we are too optimistic on growth                                                                        -
                                                                                                                                             V1       V2    V2       V2         V2       V3    V3       V3         V3
• V3: Is there “up-side risk” from future growth opportunities                                                                                      growth margin capital
                                                                                                                                                                  intensity
                                                                                                                                                                                       growth margin capital
                                                                                                                                                                                                     intensity
 Source: Polar Capital. References to future returns are not promises or estimates of actual returns Polar Capital may achieve. Forecasts contained herein are for illustrative purposes only and does not constitute
 advice or a recommendation. Forecasts are based upon subjective estimates and assumptions about circumstances and events that have not and may not take place.

This presentation is for one-on-one use with non-US professional investors only. Not for onward distribution.                                                                                                           7
Please refer to the Important Information at the end of this presentation.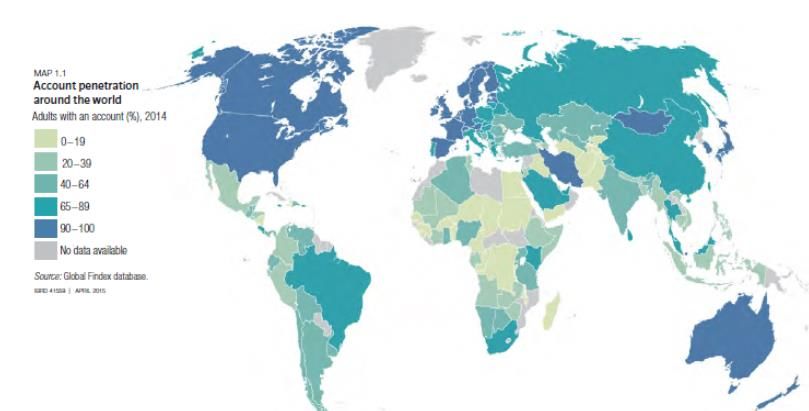
Process
                                                                                                Research and
           Idea Generation                           Research and
                                                                                               Stock Selection     Portfolio Construction
        Finding our Pockets of                      Stock Selection
                                                                                                 Valuation &              and Risk
                Growth                            Finding EVA creators
                                                                                              identifying upside

The Star companies in Emerging Markets

                      We believe in the Next Generation approach for long-term sustainable growth
                                            and shareholder value generation
 Source: Polar Capital.

This presentation is for one-on-one use with non-US professional investors only. Not for onward distribution.                               8
Please refer to the Important Information at the end of this presentation.
Process Structure – Summary
                                                                                                                                          Number of stocks

                                                                                                                                            ~1200 → ~500

                                                                                                                                             ~500 → ~300

                                                                                                                                             ~300 → ~150

                                                                            Portfolio weights
                                                                            Risk / Reward                                                   Portfolio of 45-65 stocks
                                                                                                                                             Portfolio construction –
                                                                                                 1.75-2.0%       Max 3.5%                   balance growth v valuation
                                                                                                 overweight      overweight
                                                                                                                                                and focus on risk

                                                                                                                1.25%-
                                                                                                0.75-1.25%      1.75%
                                                                                                overweight    overweight

                                                                                                                              Liquidity
 Source: Polar Capital.

This presentation is for one-on-one use with non-US professional investors only. Not for onward distribution.                                                            9
Please refer to the Important Information at the end of this presentation.
Past Performance With Strategy: Nordea 1 – Emerging Stars Equity Fund (BI-USD)

Performance relative to peer group – as at 31 December 2017

                                                                                                           Nordea 1 – Emerging Stars Equity BI USD

                                                                                                           MSCI EM NR USD

                                                                                                           EAA Fund Global Emerging Markets Equity

 Source: © 2018 Morningstar, Inc. All Rights Reserved as of 08.01.2018. European Open End Funds database, Morningstar EAA OE Global Emerging Market Equity category. Period under consideration:
 16.04.2011 - 31.12.2017. Performance in USD. The performance represented is historical; past performance is not a reliable indicator of future results and investors may not recover the full
 amount invested. The value of shares can greatly fluctuate as a result of the sub-fund’s investment policy and cannot be ensured.

 Source: 1. The Nordea 1 – Emerging Stars Equity BI USD Fund was managed by Jorry Nøddekær who had primary responsibility as portfolio manager for the Fund from inception in April 2011 until February
 2018. The comparisons represented herein are included for illustrative purposes only and investors must read the Polar Capital – Emerging Market Stars prospectus prior to making a decision to invest.
 2. Performance based on BI USD. Past performance is not indicative or a guarantee of future results.

This presentation is for one-on-one use with non-US professional investors only. Not for onward distribution.                                                                                              10
Please refer to the Important Information at the end of this presentation.
Past Performance With Strategy: Emerging Stars Equity Strategy (Gross Of Fees) Return attribution since inception Source: Nordea Investment Management AB and Barra Global Equity Model. Period under consideration: 16.04.2011 – 29.12.2017. The performance represented is historical; past performance is not a reliable indicator of future results and investors may not recover the full amount invested. There can be no warranty that an investment objective, targeted returns and results of an investment structure is achieved. Comparison with other financial products or benchmarks is only meant for indicative purposes. Please note that the attribution shown above refers to the Nordea Emerging Stars Equity Strategy (gross of fees). This presentation is for one-on-one use with non-US professional investors only. Not for onward distribution. 11 Please refer to the Important Information at the end of this presentation.
Nordea 1 - Emerging Stars Equity Fund (BI-USD)
16 April 2011 – 31 December 2017

                                                                                                                                           January → end-February 2016:
                                                                                                                                           Underperform by ~ - 580bp
                                                                                                                                           China and India growth
                                                                                                        April → mid-August 2015:           scare and Value rally
                                                                                                        Underperform by ~ - 350bp
                                                         June → end-August 2013:                        China growth scare / RMB
                                                         Underperform by ~ - 320bp                      devaluation
                                                         Taper event (all “growth
               Late January → mid-March 2012:            assets” hit hard)
               Underperform by ~ - 280bp
               Growth scare / China scare

        Historically we have had a strong rebound in relative performance after these event of underperformance
        where the underperformance has been driven by “Macro-Economics/Risk aversion” and/or style factors.
 Data Source - © 2018 Morningstar, Inc.. All Rights Reserved as of 08.01.2018. European Open End Funds database, Morningstar EAA OE Global Emerging Market Equity category. Period under consideration:
 16.04.2011 - 31.12.2017. Performance is in USD. The performance represented is historical; past performance is not a reliable indicator of future results and investors may not recover the full amount
 invested. The value of shares can greatly fluctuate as a result of the sub-fund’s investment policy and cannot be ensured.

This presentation is for one-on-one use with non-US professional investors only. Not for onward distribution.                                                                                              12
Please refer to the Important Information at the end of this presentation.
Performance Update
Long-term performance with strategy Launch of Polar Capital
Emerging Market Stars Fund –
29 June 2018
165
155
145
135
125
115
105
95
85
75
65
Apr-11 Sep-11 Feb-12 Jul-12 Nov-12 Apr-13 Sep-13 Feb-14 Jul-14 Dec-14 May-15 Oct-15 Mar-16 Aug-16 Dec-16 May-17 Oct-17 Sep-18
Emerging Stars Equity Strategy MSCI Emerging Markets Total Return Index
Source: Bloomberg, 31 December 2018. Share classes used are as follows: April 2011 to 31 December 2017 – Nordea 1 – Emerging Stars Fund (BI share class), 1 July 2018 to 31 December 2018 – Polar
Capital Emerging Market Stars fund (I USD Share Class). Performance is quotes Net of Fees. Benchmark is MSCI Emerging Markets Total Return Index (USD). The Polar Capital Emerging Market Stars Fund
was launched on 29 June 2018, this is denoted by the orange line on the graph above. Note: No performance data between 31 December 2017 to 1 July 2018. Past performance is not indicative or a guarantee
of future results.
This presentation is for one-on-one use with non-US professional investors only. Not for onward distribution. 13
Please refer to the Important Information at the end of this presentation.Performance Update
Long-term performance with strategy
Long-term performance for the Emerging Market Stars Strategy – Contribution analysis (Gross of Fees)1
2011** 2012 2013 2014 2015 2016 2017 2018***
Active Return (gross of fees) 2.68% 6.91% 5.50% 10.40% 2.97% -3.57% 10.95% -5.85
(Stratgey - MSCI EM)
Attribution Analysis*
Stock Selection - (Sector) 1.88% 6.04% 3.10% 4.06% 2.12% -2.55% 5.50% -1.84%
Asset Allocation (sector) 0.80% 0.87% 2.46% 6.34% 0.85% -1.02% 5.45% -4.01
Stock Selection - (Country) 1.22% 10.41% 9.08% 4.66% 0.35% -1.84% 12.38% -4.24%
Asset Allocation - (Country) 1.46% -3.50% -3.53% 5.74% 2.62% -1.73 -1.43% -1.61
Long-term for performance for Strategy – Contribution analysis:
Over the longer-term we have retained a strong and significant stock selection effect – consistent with our
process and ambitions.
Source: Nordea Asset Management and Polar Capital, 31 December 2018. Share classes used are as follows: April 2011 to 31 December 2017 – Nordea 1 – Emerging Stars Fund (BI share class), 1 July 2018
to 31 December 2018 – Polar Capital Emerging Market Stars fund (I USD Share Class). Performance is quotes Net of Fees. Benchmark is MSCI EM Total Return (USD). *Attribution analysis is on the back of
GICS classification. **The Strategy (back then the Nordea Emerging Stars Fund) was launched in April 2011. ***The Strategy – The Polar Capital Emerging Market Stars Fund was launched on 29 June 2018.
Note: No performance data between 31 December 2017 to 1 July 2018. Past performance is not indicative or a guarantee of future results.
This presentation is for one-on-one use with non-US professional investors only. Not for onward distribution. 14
Please refer to the Important Information at the end of this presentation.Sustainability Reporting
Own “Sustainability Delta model”
Polar Capital Emerging Market Stars sustainability map
The aim of the model is to give valuable insight into a
given companies Sustainability profile and be able to
quantify it into an EVA framework – thereby having
full integration in the process
The Sustainability Delta model aims to identify
companies that are on an improving trend from a
sustainability perspective – but still have an
acceptable level of internal process’s in place in
terms of being able to handle material ESG issues
and have a good business ethics
The blue dots are the holding in the Polar Capital
Emerging Market Stars Fund. The red dots are just
there as a reference points showing examples of
companies that score in a way where we see weak or
direct negative contribution to EVA creation and
thereby impact the evaluation of the company in a
negative way, and thereby disqualify it as a potential
investment into this Fund
Source: Polar Capital, 31 December 2018. It should not be assumed that recommendations made in future will be profitable or will equal performance of the securities in this document. A list of all
recommendations made since the Fund’s inception are available upon request. All opinions and estimates constitute the best judgment of Polar Capital as of the date hereof, but are subject to change without
notice, and do not necessarily represent the views of Polar Capital.
This presentation is for one-on-one use with non-US professional investors only. Not for onward distribution. 15
Please refer to the Important Information at the end of this presentation.Sustainability Reporting
Impact-Cubed – measuring impact at the portfolio level
We do believe this is a very high score and does
show the strong sustainability profile and positive
impact our investment process has.
Source: Impact-Cubed, 31 December 2018. Benchmark is MSCI Emerging Markets Total Return Index (USD).
This presentation is for one-on-one use with non-US professional investors only. Not for onward distribution. 16
Please refer to the Important Information at the end of this presentation.Sustainability Reporting MSCI ESG IVA – ESG profile of the portfolio using MSCI ESG data • Generally a good ESG score in aggregate • Bias to BBB rated companies • Want to find the “delta” – the companies that are improving • We do often find the biggest “delta” situations in the BB and B segment • Reliance Industries and Alibaba are currently two of our biggest “delta” cases – significant opportunities for EVA creation in the future • Energy and Base-material normally very high risk from an ESG perspective – Antofagasta and Oil Search scores very well Source: Polar Capital and MSCI IVA Research, as at 31 December 2018. It should not be assumed that recommendations made in future will be profitable or will equal performance of the securities in this document. A list of all recommendations made within the immediately preceding 12 months is available upon request. All opinions and estimates constitute the best judgment of Polar Capital as of the date hereof, but are subject to change without notice, and do not necessarily represent the views of Polar Capital. Benchmark is MSCI Emerging Markets Total Return Index (USD). This presentation is for one-on-one use with non-US professional investors only. Not for onward distribution. 17 Please refer to the Important Information at the end of this presentation.
Electrification / Renewable Energy Gas revolution Emerging consumer
Sustainability Reporting Financial Services penetration &
Inclusion
New Semiconductor Paradigm Data & 5G mobile revolution
Data and Data Centre revolution Specialty Pharma Medical Service Urban livestyle
UN SDGs Smart mobility MedTech EV & Electrification Digital living
Electrification / Renewable
Electrification Energy Energy
/ Renewable
Gas revolution
Gas revolution Emerging consumer
Emerging consumer
Electrification / Renewable Energy Gas revolution Emerging consumer
Financial Services
Financial penetration
Services &
penetration &
Financial Services penetration & New Semiconductor Paradigm Paradigm Data & 5G mobile
New Semiconductor Data &revolution
5G mobile revolution
Inclusion Inclusion New Semiconductor Paradigm Data & 5G mobile revolution
Inclusion
Samsung Chroma
SDI Silergy
Ate
Data and Data
Dataand
Centre
andDatarevolution
Data Centre
Centre revolution
revolution Specialty Pharma
Specialty
Specialty PharmaPharma Medical Service
Medical Service
Medical Service Urban
Urban livestyle
livestyle Urban livestyle
Parag Milk Shenzhen
Foods Inovance
Environmental Related Technology
Smart
Smart mobility
Smart mobility
mobility MedTech
MedTech MedTech EV & Electrification
EV Electrification
EV & Electrification Digital livingliving Digital living
Digital
BYD Antofagasta
Oil Search Land Mark
Optoelectronics
Naspers
Microport BB
Scientific Seguridade
SK Hynix
China
Medical NMC
ASPEED Samsung Chroma
Notre Dame Alibaba Ping An Technolog SDI Samsung Silergy Ate Chroma
Intermedica AIA Advanced 21 Vianet Samsung SDI Silergy Silergy
Chroma
Ceramic X Ate
SDI Ate
Grupo SM
Financiero Investments
Social Related Banorte Prestige
Estates Economic Growth and
ICI Bank
Productivity Parag Milk Shenzhen
Tencent Foods Parag Milk Inovance
PSG Group FirstRand John Keells
Parag Milk
Environmental Related Shenzhen
Shenzhen
Holdings Foods
Environmental RelatedTechnology Inovance
Housing
Development China
Vincom
Retail
eMemory
Technology 51job
Sberbank
Positive Foods
Neutral
Environmental Related Inovance
Technology NegativeTechnology
Finance Resources
Sanjiu
Medical
Reliance
Industries
Itau
Unibanco
TSMC
89% BYD 11% Antofagasta 0%
Samsung BYD Antofagasta
Apollo Electronics BYD Antofagasta
Hospitals
89% of our investments have exposure to UN SDGs
Oil Search Land Mark
Optoelectronics
Oil Search Land Mark
Oil Search Land Mark Optoelectronics
Source: Polar Capital, 31 December 2018. It should not be assumed that recommendations made in future will be profitable or will equal performance of the
Naspers A list of all securities in this document.
Optoelectronics
recommendations made since the Fund’s inception are available upon request. All opinions and estimates constitute the best judgment Naspers
of Polar Capital as of the date hereof, but are subject to change without
notice, and do not necessarily represent the views of Polar Capital. Naspers
Microport BB
Scientific Seguridade
Microport BB
This presentation is for one-on-one use with non-US professional investors only. Not for onward distribution. Microport
Scientific
Scientific
BB
China
Seguridade SK Hynix
18
Please refer to the Important Information at the end of this presentation. Seguridade
Medical NMC SK Hynix
China
Medical NMC SK Hynix
ASPEED
China
Notre Dame Alibaba Ping An
NMC Technolog
Medical
Intermedica Advanced 21 Vianet
AIA ASPEEDOutlook For Emerging Markets And EM Stars
Reasons to like EM now as a long term investor
• Key PoG: 5G and Data Centre revolution - connectivity
• ACX, 21Vianet, LandMark Opt., Aspeed
• TSMC, Samsung Electronics, SK Hynix
It should not be assumed that recommendations made in future will be profitable or will equal performance of the securities in this document. A list of all recommendations made since the Fund’s inception are
available upon request. All opinions and estimates constitute the best judgment of Polar Capital as of the date hereof, but are subject to change without notice, and do not necessarily represent the views of Polar
Capital.
This presentation is for one-on-one use with non-US professional investors only. Not for onward distribution. 19
Please refer to the Important Information at the end of this presentation.ACX – Hidden 5G Gem
• ACX specialises in the design and manufacture of RFFE components
which is central to connectivity technology
• The company has high exposure to a fast growing industry, has a very
strong and defensible industry position and runs its business sustainably
• The market valuation offers a very attractive risk/reward profile
• Increasing number of connected devices and technology complexity
in the 5G era is driving significant growth for the RFFE industry
• As technology complexity increases so do the barriers to entry and
the number of companies capable of delivering reliable solutions falls
• Combined these factors create a strong Pocket of Growth and
significant EVA generation opportunities
Company exposure to
PoG
• ACX has strong exposure deriving its profits from wireless technology,
Business Ethics
10
Industry Positioning its industry position is attractive as it is a niche leader with good
8
optionality to expand into modules
Impact to progress 6 Optionality
4
• Strong pricing power, operational leverage from a vertical integrated
2
business model, high capital efficiency and protective barriers to entry
•
Material ESG issues Pricing Power
0 Very low balance sheet risk, very high quality of management but high
exposure to a cyclical end market
Industry risk Cost structure
• The company scores well on material ESG issues with the only detractor
being slightly below global CG standards. They have mandatory training
Invested capital
Quality of management
efficiency in business ethics and good overall impact to progress score as wireless
Balance sheet risk Barriers to entry technology fits well with sustainability trends
Valuation EVA Fade
600 90% • Very attractive risk/reward with only limited downside in our V1 scenario
500
80%
70%
and significant upside in both our V2 and V3 scenarios
•
60%
400
50% Given our EVA wheel analysis we view the market as too negative on the
300
40%
30%
level and sustainability of the company's EVA generation, and the market
200 20%
fades the EVA too fast in our opinion
10%
•
100
0%
We see ACX as a STAR company, with strong exposure to a fast-growing
-
V1 V2 growth V2 margin V2 capital
intensity
V2 V3 growth V3 margin V3 capital
intensity
V3 market, a very attractive and defensive industry position and they run
ROIC-WACC model ROIC-WACC implied
51% 104%
their business sustainably
Source : Polar Capital. Upside : -15%
Source: Polar Capital, Qualcomm Technologies, Advanced Ceramics X. It should not be assumed that recommendations made in future will be profitable or will equal performance of the securities in this
document. A list of all recommendations made since the Fund’s inception are available upon request. All opinions and estimates constitute the best judgment of Polar Capital as of the date hereof, but are subject
to change without notice, and do not necessarily represent the views of Polar Capital. Forecasts contained herein are for illustrative purposes only and does not constitute advice or a recommendation. Forecasts
are based upon subjective estimates and assumptions about circumstances and events that have not and may not take place.
This presentation is for one-on-one use with non-US professional investors only. Not for onward distribution. 20
Please refer to the Important Information at the end of this presentation.Outlook For Emerging Markets And EM Stars
Reasons to like EM now as a long term investor
• Key PoG: EV revolution and automounts driving
• Chroma ATE, KingPak, Samsung SDI, BYD, Shenzhen Inovance, Antofagasta
It should not be assumed that recommendations made in future will be profitable or will equal performance of the securities in this document. A list of all recommendations made since the Fund’s inception are
available upon request. All opinions and estimates constitute the best judgment of Polar Capital as of the date hereof, but are subject to change without notice, and do not necessarily represent the views of Polar
Capital.
This presentation is for one-on-one use with non-US professional investors only. Not for onward distribution. 21
Please refer to the Important Information at the end of this presentation.Samsung Electronics – Cheap Global Leader
• Samsung Electronics is global technology and scale leader in the
manufacturing of DRAM and NAND flash memory semiconductors
• As the global leader in an indispensable technology area, Samsung
Electronics has good exposure and a strong position in a fast-growing market
• The current market price offers an attractive risk reward profile
• The number and diversity of devices for data creation is growing rapidly with
the development of the IoT ecosystem. This is fuelling strong demand for
storage and processing technology
• The supply side for memory semiconductors has consolidated significantly
especially in DRAM due to increasing technology complexity and capital
intensity
• These factors create a strong Pocket of Growth and significant EVA
generation opportunities for the rightly positioned companies
Company exposure to
PoG
• Samsung Electronics has good exposure to memory as a leader but is a
Business Ethics
10
Industry Positioning
diversified company. They are the strongest positioned company within the
8 memory industry, and they have great optionality in terms of synergies with
Impact to progress 6 Optionality their other business areas
4
• As the market leader, Samsung has good pricing power and given the high
#1 NAND
2
Material ESG issues Pricing Power capital intensity the cost structure produces a lot of operational leverage. The
0 producer
invested capital efficiency is good with strong working capital management
Industry risk Cost structure • No balance sheet risk, strong management team with individual segment
heads but high exposure to cyclical end markets
Quality of
Barriers to entry
management
Invested capital • Business Ethics is improving, they are managing ESG risks well and their
Balance sheet risk
efficiency products contribute to progress
100,000
Valuation EVA Fade
• We see a very attractive risk reward profile, and even if we remove all our
25%
80,000 20%
assumptions around optionality and take a "business as usual" view we still
60,000
15% get upside from the current market price
10%
40,000
5% • Given our EVA wheel analysis and our differentiated view of the sustainability
20,000 0%
of the memory market growth, we believe that market is way too bearish on
2018
2020
2022
2024
2026
2028
2030
2032
2034
2036
2038
2040
2042
2044
2046
2048
2050
2052
2054
2056
-5%
0
-10%
the EVA generation capabilities of Samsung Electronics, as our analysis
-20,000
-15% shows the current price implies that Samsung will destroy value long-term
ROIC-WACC model ROIC-WACC implied
Upside: 2% 57% 106% • We see Samsung as a STAR company given their world leading technology
and industry position and their active improvement in ESG related areas
Source: Polar Capital, Samsung Electronics. It should not be assumed that recommendations made in future will be profitable or will equal performance of the securities in this document. A list of all
recommendations made since the Fund’s inception are available upon request. All opinions and estimates constitute the best judgment of Polar Capital as of the date hereof, but are subject to change without
notice, and do not necessarily represent the views of Polar Capital. Forecasts contained herein are for illustrative purposes only and does not constitute advice or a recommendation. Forecasts are based upon
subjective estimates and assumptions about circumstances and events that have not and may not take place.
This presentation is for one-on-one use with non-US professional investors only. Not for onward distribution. 22
Please refer to the Important Information at the end of this presentation.Samsung SDI – Leading Battery Maker
• Rising penetration of EVs combined with a higher focus on renewable
energy production is driving a significant demand for lithium-ion battery
technology
• As requirements for battery technology increases in terms of energy
density and cost effectiveness we expect the industry to consolidate
around a few winning players
• Combining these factors creates a strong Pocket of Growth and
significant EVA generation opportunities for the rightly positioned
companies
Exposure to PoG
10
Business Ethics Industry Positioning • SDI has strong exposure to pockets of growth as most of their revenue
8 and profits are from battery technology. Their industry position is strong in
Impact to progress 6 Optionality our view and they have good optionality to expand their business in ESS
4 • Low pricing power but a very attractive cost structure with significant
2 operational leverage. Barriers to entry are rising and invested capital
Material ESG issues Pricing Power efficiency is good
0
• Some balance sheet risk as the company is investment mode, high
quality of management but high exposure to a cyclical end market
Industry risk Cost structure
• The company scores show progress on its material ESG issues but is still
lacking in some areas. They have mandatory training in business ethics
Management Quality Barriers to entry and good overall impact to progress score as battery technology fits well
Balance sheet risk Invested capital efficiency
with sustainability trends
Valuation • Samsung SDI is a lithium-ion battery manufacturer supplying batteries for
500,000
450,000 automotive and Energy Storage Systems (ESS) and consumer
400,000 electronics
350,000
300,000
• The company has high exposure to a fast-growing industry, has a very
250,000 strong and defensible industry position and a product that fit well with
200,000 sustainability trends.
150,000
100,000 • The market valuation is offering a very attractive risk reward profile.
50,000
0
-50,000 V1 V2 growth V2 margin V2 capital V2 V3 growth V3 margin V3 capital V3
intensity intensity
Upside: -26% 45% 90%
Source: Polar Capital, Avicenne Energy. It should not be assumed that recommendations made in future will be profitable or will equal performance of the securities in this document. A list of all recommendations
made since the Fund’s inception are available upon request. All opinions and estimates constitute the best judgment of Polar Capital as of the date hereof, but are subject to change without notice, and do not
necessarily represent the views of Polar Capital. Forecasts contained herein are for illustrative purposes only and does not constitute advice or a recommendation. Forecasts are based upon subjective estimates
and assumptions about circumstances and events that have not and may not take place.
This presentation is for one-on-one use with non-US professional investors only. Not for onward distribution. 23
Please refer to the Important Information at the end of this presentation.Outlook For Emerging Markets And EM Stars
Reasons to like EM now as a long term investor
• Key PoG: India Financial Inclusion and Property (Indian middle-class evolving and urbanisation)
• HDFC, ICICI Bank, Phoenix Mills, Prestige Estate
Mortgage markets in India
Source: European Mortgage Federation, HOFINET & HDFC estimates for India. All opinions and estimates constitute the best judgment of Polar Capital as of the date hereof, but are subject to change without
notice, and do not necessarily represent the views of Polar Capital.
This presentation is for one-on-one use with non-US professional investors only. Not for onward distribution. 24
Please refer to the Important Information at the end of this presentation.Phoenix Mills – Mall King In India
• Phoenix Mills is one of the absolute leading - if not the leading - Mall company
EVA Valuation •in India.
Phoenix
It ownMills
keyis one
Mall of the
assets absolute
in Mumbai andleading – cities
other key if notinthe that– Mall
leading
the India
Impact to
Material ESG issues companies in India. It owns key Mall assets in Mumbai and other
are fast growing. Phoenix Mills also own a property development business with key cities in
progress significant potential,
India which andgrowing.
are fast owns Hotels and operates
Phoenix Mills alsocommercial centresdevelopment
own a property in
Mumbai
business with significant potential, owns Hotels and operates commercial
ockets Industry key
growth
Business Ethics
success factors
• Wecentres in Mumbai
truly believe Phoenix Mills is a future STAR company
• We truly believe Phoenix Mills is a future STAR company
3. Valuation • • India
India
hashas
oneone
of theofmost
the most interesting
interesting social social demographics
demographics developments
developments as the as
the country
country seem toseem
be at atounique
be at point
a unique
in timepoint in young
where time where young population,
population,
urbanisation,
urbanization, uplift
uplift in theinservice
the economy,
service economy,
and a moveand a move
towards an towards an
"international consumer
"international consumer lifelife
style" will will
style" drive hugehuge
drive opportunities to capitalize
opportunities on on
to capitalise
Pockets 2. Industry Key thethe
new emerging
new emergingconsumer.
consumer
Growth Success Factors
• • Land in key
Land central
in key city locations
central are scarce
city locations and barriers
are scarce to entry to
and barriers in the
entryMall
in the Mall
business
businessareare
highhigh
limiting supply,supply,
– limiting and place
andthe earlythe
place movers
early and operators
movers and operators
with deep knowledge of the industry in a very strong position.
with deep knowledge of the industry in a very strong position
Company exposure •
Phoenix Mills is very well positioned to take advantages of the new emerging
to PoG
3. Valuation B usiness E thics
10
Indust ry P ositioni ng
consumer trends and increased spending power given is location and brand
8 • Phoenix
value Mills
of its is very -well
Malls positioned
a clear leadingtointake advantages
catching of the
the new newurban
young emerging
consumer
consumer trends and increased spending power given is location and brand
Im pact t o progress 6 Opt ionalit y
• value
Theofbusiness
its Malls model
- a clear- leading
owning inand running
catching theMalls - offersurban
new young very consumer
high operational
4
#1 NAND leverage. Phoenix Mills has over the last decade been developing the key
Pockets 2. Industry Key • The business model - owning and running Malls - offers very high operational
f Growth Success Factors 2 Mall assets - now
Millswe believe monetising
last decadewill come with a significant uplift in
Mat erial E S G issues P ri cing Power
producerleverage. Phoenix has over the been developing the key Mall
0 ROIC (Tenant mix and rental revision with incremental large improvements
assets - now we believe monetizing will come with a significant uplift in ROIC in
margins)
(Tenant mix and rental revision with incremental large improvements in
Impact to Progress
• margins)
Indust ry risk Cost st ructure
Phoenix Mills manages its stakeholder relationships well - no material ESG
• Phoenix
risk Mills manages its stakeholder relationships well - no material ESG risk
Material ESG Qualit y of Invested capit al
• • ItsIts
managem ent eff iciency
Business balance
Ethics
issues balance sheetsheet is geared
is geared - but
- but given given FCF
the future theprofile
futureweFCF profile we are
are comfortable
B alance sheet risk B arriers t o entry
comfortable
Valuation
Valuation EVAEVA Fade
Fade • We see a very attractive Return / Risk profile for Phoenix Mills, with a strong
1,200 1,200
30%
25%
• Weprofile
upside see a very attractive
relative Return
to the / Risk profile
downside for Phoenix
risk should the Mills,
growthwith a
profile not
3. Valuation 1,000
25%
20% strong upside profile relative to the downside risk should the growth
1,000
800
20% materialise.
profile not materialize.
15%
15%
600
• We see upside coming from increased revenue profile, but also a large uplift
• We see upside coming from increased revenue profile, but also a large
800
10%
400 10%
600
200
5% from uplift
margin expansion
from and future
margin expansion andreduced capital capital
future reduced insensitivity as theasheavy
insensitivity
1. Pockets 2. Industry Key 5%
0%
investments
the heavy have been taken
investments haveupfront
been taken upfront
2019
2021
2023
2025
2025 2027
2027 2029
2031
2033
2035
2037
2035 2039
2037 2041
2043
2045
2047
2049
2045 2051
2047 2053
2049 2055
2057
-
of Growth Success Factors 400 -5%
0%
• Looking at the
• Looking implied EVAEVAprofile
profile-- as wellasaslooking
looking at factors like Cap
2019
2021
2023
2029
2031
2033
2039
2041
2043
2051
2053
2055
2057 at the implied as well at factors like Cap
ROIC-WACC model
200 ROIC-WACC implied
-5%
RateRate
(as (as a check)we
a check) we see
see aalarge
largedegree
degreeof safety on the
of safety onupside for the for the
the upside
Upside: -12% 37% 76% company
-
V1 V2 growth V2 ma rgin V2 ca pital V2 V3 growth V3 ma rgin V3 ca pital V3
ROI C-W ACC model ROI C-W ACC impl ied
company
Source: Polar Capital. It should not be assumedintensi
thatty
recommendations
intensi ty
made in future will be profitable or will equal performance of the securities in this document. A list of all recommendations made since the
urce: Polar Capital. Upside: -7% 35% 72%constitute the best judgment of Polar Capital as of the date hereof, but are subject to change without notice, and do not necessarily
Fund’s inception are available upon request. All opinions and estimates
represent the views of Polar Capital. Forecasts contained herein are for illustrative purposes only and does not constitute advice or a recommendation. Forecasts are based upon subjective estimates and
assumptions about circumstances and events that have not and may not take place.
This presentation is for one-on-one use with non-US professional investors only. Not for onward distribution. 25
Please refer to the Important Information at the end of this presentation.Outlook For Emerging Markets And EM Stars
We are constructive! EM relative to DM 12m forward price to
earnings ratio and dividend yield1
• Emerging markets are cheap now
• Expectations are low – we have already seen significant cuts to
EPS by analysts and multipliers have contracted
• Emerging markets do not have massive imbalances
• Emerging markets currencies are very cheap
• There is room for policy action
‒ Fiscal
‒ Monetary
MSCI NJA, Latam and EMEA
I/B/E/C consensus +12m PER expectation1
• India looks most “safe” – but not cheap
• North Asia very cheap – but there are risks
Source: Polar Capital, unless otherwise stated. 1. MB/E/S, MSCI, Credit Suisse research. All opinions and estimates constitute the best judgment of Polar Capital as of the date hereof, but are subject to change
without notice, and do not necessarily represent the views of Polar Capital.
This presentation is for one-on-one use with non-US professional investors only. Not for onward distribution. 26
Please refer to the Important Information at the end of this presentation.Outlook For Emerging Markets And EM Stars
Case in point – SK Hynix
Polar Capital EM Stars team: EVA valuation on SK Hynix – very
favourable distribution curve from future forecasted EVA
SK Hynix (Price to Book and RoE)1 generation2
Huge disconnect between future return profile and asset value relative to current market pricing!
Source: 1. Bloomberg, 31 December 2018. 2. Polar Capital, 31 December 2018. It should not be assumed that recommendations made in future will be profitable or will equal performance of the securities in this
document. A list of all recommendations made since the Fund’s inception are available upon request.
This presentation is for one-on-one use with non-US professional investors only. Not for onward distribution. 27
Please refer to the Important Information at the end of this presentation.Emerging Markets: Asset Class With Huge Opportunities
Turning points for EM The US twin deficits (current account deficit plus fiscal
• US growth and the US$ → ~ 1Q19E – 2Q19E deficit) LEADS the US$ by two years. The gap has
– Stronger US$ Risk for EM is overplayed in our view widened and is challenging the strong US$ view for
the elevated USD1
– We see likelihood of a stable to potentially falling US$
– EPS growth fading (spread to EM will narrow/close)
• Liquidity will come back into the system → ~ 1Q19E - 2Q19E
– Fed will ease off and liquidity contraction move the other way
– US growth slowing and low inflation – the Fed see we are in an asset
based world
• China – we will get a soft landing → ~ 4Q18E – 2Q19E
– Debt levels are high – but we believe it can be managed
– No “real” trade war / inject liquidity into the economy
– China will stimulate
• Trade / Geo-politics → ~ 4Q18E – 1Q19E
2
– Base case we do not get a trade war – everybody will lose out (Trump
way of doing a deal!)
– USA or China – do not take this “battle of global leadership” now
• Investor and sell-side analysts “capitulation” → ~ 3Q18 - 1Q19E
– 2019E & 2020E EPS are getting rebased now
• Technology cycle turn around → ~ 1Q19E – 2Q19E
– Inventory cycle to clear by ~ 2Q19E
– 2020 → Next big technology super cycle (5G, Data, connectivity)
Source: 1. BofA Merrill Lynch Global Research, BIS, Bloomberg. Note: Dotted line denotes Bloomberg forecast for 2018-2020. 2. Bloomberg, 31 October 2018. All opinions and estimates constitute the best
judgment of Polar Capital as of the date hereof, but are subject to change without notice, and do not necessarily represent the views of Polar Capital.
This presentation is for one-on-one use with non-US professional investors only. Not for onward distribution. 28
Please refer to the Important Information at the end of this presentation.Outlook For Emerging Markets And EM Stars
Portfolio positioning and conviction
Our view on where we are different from peers (on best judgement from views on Bloomberg)
Top ~ 20 positions The "tails" Large underweight / non-held stocks
Relative higher weighting / Tencent SM Investments China Construction Bank
Not uncommen stocks Ping An Yandex China Mobile
AIA Antofagasta Baidu
Samsung Electronics NetEase Petrobras
Banorte Vale
ICBC
Relative low differentiation Alibaba Banco Bradesco
(still OW positions) TSMC Hon Hai
Itau Bank of China
Naspers Infosys
HDFC CNOOC
TCS
Notredame Intermedica Chroma ATE JD.COM
Very diffientiating names Reliance Industries Parag Milk Lukoil
(the stock name and/or its weighting) NMC Healtcare Advanced Ceramic X HDFC Bank
Samsung SDI Microport OTP
Apollo Hospitals 51Jobs CSPC Pharmaceutical
Oil Search Kingpak Hindustan Unilever
ICICI Bank BR Malls
SK Hynix Phoenix Mills
CD Projekt Silergy
eMemory
21Vianet
Prestige Estate
Aspeed
LandMark opt.
Vincom Retail
John Keells
PSG
Mail.ru
China Medical Systems
Source: Polar Capital and Bloomberg, 31 December 2018. It should not be assumed that recommendations made in future will be profitable or will equal performance of the securities in this document. A list of
all recommendations made since the Fund’s inception are available upon request. All opinions and estimates constitute the best judgment of Polar Capital as of the date hereof, but are subject to change without
notice, and do not necessarily represent the views of Polar Capital.
This presentation is for one-on-one use with non-US professional investors only. Not for onward distribution. 29
Please refer to the Important Information at the end of this presentation.Why Polar Capital Emerging Market Stars Fund?
We believe our STAR process will generate alpha:
• Disciplined process and experience team to invest in
growth opportunities in Emerging Markets
• Strong fundamental believe in Economic Value Added
(EVA) as the driver for long term shareholder value
generation
• Identify growing companies with mis-priced EVA
profiles - centred on our own proprietary research and
disciplined EVA valuation-based approach
• Full sustainability integration with focus on companies
impact to progress and managing of material ESG
issues
• Concentrated portfolio of high conviction stock picks
• Strong track record with process and strategy
• Time to be constructive on growth opportunities in
emerging markets
We believe our “STAR” investment philosophy & process will lead to
“sustainable shareholder value generation”
Source: Polar Capital. All opinions and estimates constitute the best judgment of Polar Capital as of the date hereof, but are subject to change without notice, and do not necessarily represent the views of Polar
Capital.
This presentation is for one-on-one use with non-US professional investors only. Not for onward distribution. 30
Please refer to the Important Information at the end of this presentation.Important Information
Polar Capital
16 Palace Street
London SW1E 5JD
Important Information: This document is provided for the sole use of the intended recipient and is not a financial promotion. It shall not and does not constitute an offer or solicitation of an offer to make an
investment into any fund managed by Polar Capital. It may not be reproduced in any form without the express permission of Polar Capital and is not intended for private investors. This document is only made
available to professional clients and eligible counterparties. The law restricts distribution of this document in certain jurisdictions; therefore, it is the responsibility of the reader to inform themselves about and
observe any such restrictions. It is the responsibility of any person/s in possession of this document to inform themselves of, and to observe, all applicable laws and regulations of any relevant jurisdiction. It is not
designed to contain information material to an investor’s decision to invest in Polar Capital Funds Plc – Emerging Market Stars Fund. SUCH INFORMATION, INCLUDING RELEVANT RISK FACTORS, IS
CONTAINED IN THE FUND’S OFFER DOCUMENT WHICH MUST BE READ BY ANY PROSPECTIVE INVESTOR.
Statements/Opinions/Views: All opinions and estimates constitute the best judgment of Polar Capital as of the date hereof, but are subject to change without notice, and do not necessarily represent the views
of Polar Capital. This material does not constitute legal or accounting advice; readers should contact their legal and accounting professionals for such information. All sources are Polar Capital unless otherwise
stated.
Third-party Data: Some information contained herein has been obtained from third party sources and has not been independently verified by Polar Capital. Neither Polar Capital nor any other party involved in or
related to compiling, computing or creating the data makes any express or implied warranties or representations with respect to such data (or the results to be obtained by the use thereof), and all such parties
hereby expressly disclaim all warranties of originality, accuracy, completeness, merchantability or fitness for a particular purpose with respect to any data contained herein.
Holdings: Portfolio data is “as at” the date indicated and should not be relied upon as a complete or current listing of the holdings (or top holdings) of the Fund. The holdings may represent only a small
percentage of the aggregate portfolio holdings, are subject to change without notice, and may not represent current or future portfolio composition. Information on particular holdings may be withheld if it is in the
Fund’s best interest to do so. It should not be assumed that recommendations made in future will be profitable or will equal performance of the securities in this document. A list of all recommendations made
within the lesser of the fund inception or the immediately preceding 12 months is available upon request. This document is not a recommendation to purchase or sell any particular security. It is designed to
provide updated information to professional investors to enable them to monitor the Fund.
Benchmarks: The following benchmark index is used: MSCI Emerging Markets Net TR Index. This benchmark is generally considered to be representative of the investment universe. This benchmark is a
broad-based index which is used for comparative/illustrative purposes only and has been selected as it is well known and easily recognizable by investors. Please refer to www.msci.com for further information on
this index. Comparisons to benchmarks have limitations as benchmarks’ volatility and other material characteristics may differ from the fund. Security holdings, industry weightings and asset allocation made for
the Fund may differ significantly from the benchmark. Accordingly, investment results and volatility of the fund may differ from those of the benchmark. The indices noted in this document are unmanaged,
unavailable for direct investment, and are not subject to management fees, transaction costs or other types of expenses that the fund may incur. The performance of the index reflects reinvestment of dividends
and, where applicable, capital gain distributions. Therefore, investors should carefully consider these limitations and differences when evaluating the comparative benchmark data performance. Information
regarding indices is included merely to show general trends in the periods indicated and is not intended to imply that the fund was similar to the indices in composition or risk.
Regulatory Status: Polar Capital LLP is a limited liability partnership number OC314700. It is authorised and regulated by the UK Financial Conduct Authority (“FCA”) and is registered as an investment adviser
with the US Securities & Exchange Commission (“SEC”). A list of members is open to inspection at the registered office, 16 Palace Street, London, SW1E 5JD. FCA authorised and regulated Investment
Managers are expected to write to investors in funds they manage with details of any side letters they have entered into. The FCA considers a side letter to be an arrangement known to the investment manager
which can reasonably be expected to provide one investor with more materially favourable rights, than those afforded to other investors. These rights may, for example, include enhanced redemption rights,
capacity commitments or the provision of portfolio transparency information which are not generally available. The Fund and the Investment Manager are not aware of, or party to, any such arrangement whereby
an investor has any preferential redemption rights. However, in exceptional circumstances, such as where an investor seeds a new fund or expresses a wish to invest in the Fund over time, certain investors have
been or may be provided with portfolio transparency information and/or capacity commitments which are not generally available. Investors who have any questions concerning side letters or related arrangements
should contact the Polar Capital Desk at the Administrator on (+353) 1 434 5007. The Fund is prepared to instruct the custodian of the Fund, upon request, to make available to investors portfolio custody
position balance reports monthly in arrears.
This presentation is for one-on-one use with non-US professional investors only. Not for onward distribution. 31
Please refer to the Important Information at the end of this presentation.Important Information
Polar Capital
16 Palace Street
London SW1E 5JD
Information Subject to Change: The information contained herein is subject to change, without notice, at the discretion of Polar Capital and Polar Capital does not undertake to revise or update this information
in any way.
Forecasts: References to future returns are not promises or estimates of actual returns Polar Capital may achieve. Forecasts contained herein are for illustrative purposes only and does not constitute advice or
a recommendation. Forecasts are based upon subjective estimates and assumptions about circumstances and events that have not and may not take place.
Performance/Investment Process/Risk: Performance is shown net of fees and expenses and includes the reinvestment of dividends and capital gain distributions unless otherwise stated. Factors affecting
fund performance may include changes in market conditions (including currency risk) and interest rates and in response to other economic, political, or financial developments. The Fund’s investment policy
allows for it to enter into derivatives contracts. Leverage may be generated through the use of such financial instruments and investors must be aware that the use of derivatives may expose the Fund to greater
risks, including, but not limited to, unanticipated market developments and risks of illiquidity, and is not suitable for all investors. Those in possession of this document must read the Fund’s Prospectus for further
information on the use of derivatives. Past performance is not a guide to or indicative of future results. Future returns are not guaranteed and a loss of principal may occur. Investments are not insured by the
FDIC (or any other state or federal agency), or guaranteed by any bank, and may lose value. No investment process or strategy is free of risk and there is no guarantee that the investment process or strategy
described herein will be profitable.
Allocations: The strategy allocation percentages set forth in this document are estimates and actual percentages may vary from time-to-time. The types of investments presented herein will not always have the
same comparable risks and returns. Please see the private placement memorandum for a description of the investment allocations as well as the risks associated therewith. Please note that the Fund may elect
to invest assets in different investment sectors from those depicted herein, which may entail additional and/or different risks. Performance of the Fund is dependent on the Investment Manager’s ability to identify
and access appropriate investments, and balance assets to maximize return to the Fund while minimizing its risk. The actual investments in the Fund may or may not be the same or in the same proportion as
those shown herein.
Country Specific disclaimers: In the United States the Fund shall only be available to or for the account of U.S. persons (as defined in Regulation S under the United States Securities Act of 1933, as amended
(the "Securities Act")) who are "qualified purchasers" (as defined in the United States Investment Company Act of 1940, as amended (the "Company Act")) and "accredited investors" (as defined in Rule 501(a)
under the Securities Act). The Fund is not, and will not be, registered under the Securities Act or the securities laws of any of the states of the United States and interests therein may not be offered, sold or
delivered directly or indirectly into the United States, or to or for the account or benefit of any US person, except pursuant to an exemption from, or in a transaction not subject to, the registration requirements of
such securities laws. The securities will be subject to restrictions on transferability and resale. The Fund will not be registered under the Company Act.
Country Specific disclaimers: This document has not been registered as a prospectus with the Monetary Authority of Singapore. Accordingly, this document and any other document or material in connection
with the offer or sale, or invitation for subscription or purchase, of Shares may not be circulated or distributed, nor may Shares be offered or sold, or be made the subject of an invitation for subscription or
purchase, whether directly or indirectly, to persons in Singapore other than (i) to an institutional investor Pursuant to Section 304 of the Securities and Futures Act, Chapter 289 of Singapore (the “SFA”) or (ii)
otherwise pursuant to, and in accordance with the conditions of, any other applicable provision of the SFA. The Prospectus and Information Memorandum are available to download at www.polarcapital.co.uk
alternatively; you can obtain the latest copy from the Polar Capital Investor Relations team. The Fund is a collective investment scheme but is not authorised under Section 104 of the Securities and Futures
Ordinance of Hong Kong by the Securities and Futures Commission of Hong Kong. Accordingly the distribution of this document, and the placement of interests in Hong Kong, is restricted. This document may
only be distributed, circulated or issued to persons who are professional investors under the Securities and Futures Ordinance and any rules made under that Ordinance or as otherwise permitted by the
Securities and Futures Ordinance
Country Specific disclaimers: Polar Capital LLP (Investment Manager) is exempt from the requirement to hold an Australian financial services licence in respect of the financial services it provides to wholesale
investors in Australia and is regulated by the Financial Conduct Authority of the UK under UK laws which differ from Australian laws.
This presentation is for one-on-one use with non-US professional investors only. Not for onward distribution. 32
Please refer to the Important Information at the end of this presentation.You can also read


