Pocket Guide to Large Truck and Bus Statistics 2021 - Federal ...
←
→
Page content transcription
If your browser does not render page correctly, please read the page content below

2021
Pocket Guide to
Large Truck and Bus Statistics
To access a printable version of this guide, please visit:
www.fmcsa.dot.gov/safety/data-and-statistics/commercial-motor-
vehicle-facts. For more information about this publication, contact:

E-mail:   FMCSA_Host@dot.gov

Mail:     Federal Motor Carrier Safety Administration
          Office of Analysis, Research, and Technology
          1200 New Jersey Avenue, SE
          6th Floor
          Washington, DC 20590

Information Service:
          Phone: 1-800-832-5660

RRA-21-004
December 2021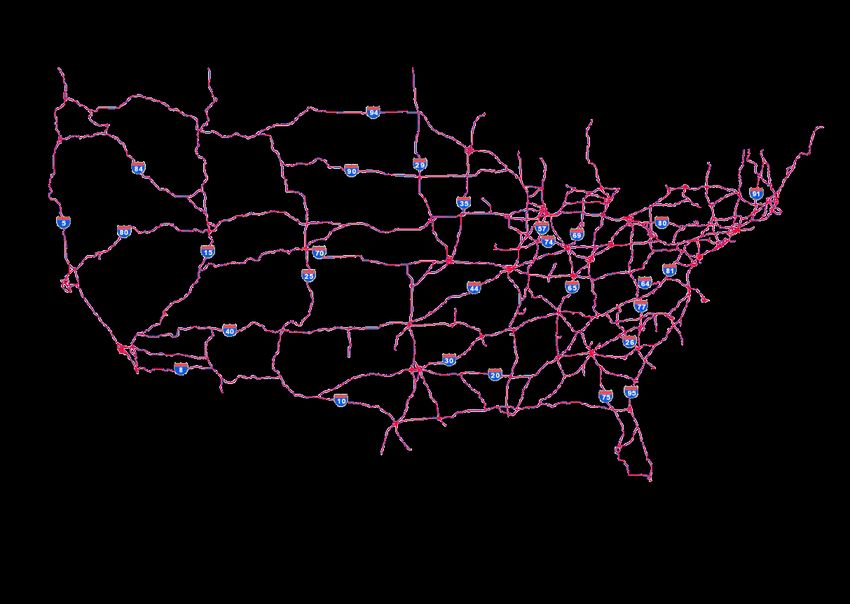
2021
Pocket Guide to
Large Truck and Bus Statistics

December 2021
Introduction
The primary mission of the Federal Motor Carrier Safety
Administration (FMCSA) is to reduce crashes, injuries, and
fatalities involving large trucks and buses. In carrying out its
safety mandate, FMCSA develops and enforces data-driven
regulations that balance motor carrier safety with efficiency.
For more information about the Agency and its safety-based
initiatives, please visit www.fmcsa.dot.gov.

Contents
The Motor Carrier Management Information System......... 6
Section 1. Overview: Large Trucks and Buses................... 7
Section 2. Inspections and Violations.................................18
Section 3. Investigations.....................................................26
Section 4. Crashes.............................................................32
Section 5. Data Quality.......................................................48
Section 6. Grant Programs.................................................52
Section 7. Agency Resources.............................................56
Glossary and List of Acronyms...........................................57

4      2021 Pocket Guide to Large Truck and Bus Statistics
Locations of Fatal Large Truck and Bus
Crashes, 2019

                                                                                                                                                                       Maps.com, National Atlas of the United States, Sources: Esri, HERE, Garmin,
                                                                                     Fatal Large Truck and Bus Crash

                                                                                                                                         Fatal Large Truck Crash
                                                                                                                       Fatal Bus Crash
                                                                        Crash Type

Note: In 2019, there were 4,696 fatal crashes involving large trucks and buses.
Data Source: National Highway Traffic Safety Administration (NHTSA), Fatality Analysis
Reporting System (FARS).

		                     2021 Pocket Guide to Large Truck and Bus Statistics                                                                                         5
The Motor Carrier Management Information System FMCSA created and maintains the Motor Carrier Management Information System (MCMIS). MCMIS contains information on the safety performance of commercial motor carriers (large trucks and buses) and hazardous materials (HM) carriers subject to the Federal Motor Carrier Safety Regulations (FMCSRs) and Hazardous Materials Regulations (HMRs). This system contains crash, census, inspection, and investigation files created to monitor and develop safety standards for commercial motor vehicles (CMVs) operating in interstate commerce. The crash file includes information on all trucks and buses involved in reportable crashes. The census file includes descriptive information on every motor carrier in MCMIS and is updated weekly. FMCSA analyzes motor carrier self-reported MCMIS registration data and applies filters to identify and remove inaccurate entries to avoid over- or under-estimating values. The inspection file contains data from State and Federal inspection actions involving motor carriers operating in the United States. Most of the inspection data included in MCMIS are collected at the roadside by State personnel under the Motor Carrier Safety Assistance Program (MCSAP). The investigation file includes data from warning letters and on-site and off-site investigations and reviews conducted on motor carriers that transport property or passengers in interstate or intrastate commerce. Most of the investigation data is captured on-site during the examination of a motor carrier’s operations by a safety investigator. 6 2021 Pocket Guide to Large Truck and Bus Statistics
1. Overview: Large Trucks and Buses
In 2019, among the 276,491,174 total registered vehicles in
the United States, 10,160,433 were single-unit trucks (straight
trucks), 2,925,210 were combination trucks (tractor-trailers),
and 995,033 were buses. Also in 2019, there were 3,261.8
billion vehicle miles traveled (VMT) by all motor vehicles. Large
trucks traveled 300.1 billion of those miles (9.2 percent of the
total), and buses traveled 18 billion of those miles (0.6 percent
of the total).

FMCSA regulates all motor carriers that operate in interstate
commerce, and certain requirements for motor carriers and
commercial motor vehicles (CMVs) that transport hazardous
materials (HM) in intrastate commerce. As of December 2020,
637,721 interstate motor carriers and intrastate HM motor
carriers had recent activity operating in the United States:
• 373,238 were for-hire carriers
• 201,807 were private carriers
• 59,609 were both for-hire and private carriers
•   3,067 were neither for-hire nor private carriers
   		     (e.g., Government).

FMCSA regulates all drivers involved in interstate commerce,
as well as all Commercial Driver’s License (CDL) drivers, both
interstate and intrastate. Approximately 6.5 million CMV drivers
operate in the United States:
• 3.7 million operate interstate
  - 3.0 million operate interstate and hold CDLs
• 2.8 million operate intrastate
  - 1.0 million operate intrastate and hold CDLs.
Notes: The number of carriers and/or drivers in operation at any given time is subject to
change, due to enforcement actions, business turnovers, licensing issues, and other factors.
Interstate and some intrastate driver counts are based on motor carrier registration data
contained in the Motor Carrier Management Information System (MCMIS); intrastate driver
counts for States that do not require carriers to register with FMCSA were estimated by
extrapolation from States requiring both interstate and intrastate carriers to register in MCMIS.
Data Sources: Registration Data - Federal Highway Administration (FHWA), Highway
Statistics 2019; Carrier and CMV Driver Counts - FMCSA, MCMIS, data snapshot as of
December 28, 2020.

		                       2021 Pocket Guide to Large Truck and Bus Statistics                  7
1-1      Registered Vehicles in the United States, 2016-2019

Year               All Vehicles          Large Trucks              Buses
2016               268,799,083            11,498,561              976,161
2017               272,480,899            12,229,216              983,231
2018               273,602,100            13,233,910              992,152
2019               276,491,174            13,085,643              995,033
Data Source: Federal Highway Administration (FHWA), Highway Statistics 2019,
Table VM-1.

1-2      Million Vehicle Miles Traveled (VMT) in the United
         States, 2016-2019

                                          Large Trucks
Year            All Vehicles       Single-Unit   Combination          Buses
2016              3,174,408         113,338         174,557          16,350
2017              3,212,347         116,102         181,490          17,227
2018              3,240,327         120,699         184,165          18,303
2019              3,261,772         124,746         175,305          17,980
Data Source: Federal Highway Administration (FHWA), Highway Statistics 2019,
Table VM-1.

1-3      Motorcoach Passenger Trips in the United States and
         Canada by Fleet Size, 2017
                         Passenger Trips:          Average Passenger Trips per:
Motorcoach
Fleet Size              Total          Percent      Motorcoach        Carrier
100 or more         398,085,000         69.3%            45,314    19,904,251
50 to 99              31,373,100         5.5%             8,653        475,349
25 to 49              56,269,900         9.8%            18,891        541,057
10 to 24              33,736,400         5.9%             6,031         87,627
1 to 9                55,087,900         9.6%             3,384         21,018
Industry Total      574,552,300        100.0%            15,418        179,772
Note: Percentages may not sum to 100 percent because of rounding.
Data Source: Motorcoach Census: A Study of the Size and Activity of the Motorcoach
Industry in the United States and Canada in 2017. Prepared for the American Bus
Association Foundation by John Dunham & Associates, June 5, 2019. Available at
www.buses.org/aba-foundation/research-summary/size-and-scope.

8        2021 Pocket Guide to Large Truck and Bus Statistics
1-4 Commercial Motor Vehicle (CMV) Drivers Operating in
the United States, 2020
Intrastate Non-
CDL Drivers
1,700,000 (26%)
Interstate
Commercial
Driver's License
(CDL) Drivers
3,000,000 (46%)
Intrastate CDL
Drivers 1,000,000
(15%)
Interstate Non-
CDL Drivers
700,000 (11%)
Notes: The number of carriers and/or drivers in operation at any given time is
subject to change, due to enforcement actions, business turnovers, licensing
issues, and other factors. Interstate and some intrastate driver counts are based
on motor carrier registration data contained in the Motor Carrier Management
Information System (MCMIS); intrastate driver counts for States that do not require
intrastate carriers to register with FMCSA are estimated via extrapolation of State
data.
Data Source: FMCSA, MCMIS, data snapshot as of December 18, 2020.
1-5 Active Motor Carriers by Type, 2016-2020
Type 2016 2017 2018 2019 2020
Interstate Freight 497,349 515,772 541,231 555,567 590,249
Interstate Passenger 12,667 12,771 12,398 11,900 10,846
Intrastate Hazardous 28,033 30,450 33,091 35,075 36,626
Materials
Total 538,049 558,993 586,720 602,542 637,721
Notes: The count of intrastate hazardous materials (HM) carriers includes a few active
intrastate non-HM carriers with HM activity that meets the Safety Measurement System
(SMS) HM threshold definition. Company counts are estimates based on motor
carriers in the Motor Carrier Management Information System (MCMIS) with recent
activity, defined as those carriers that have had an inspection, a crash, an investigation,
a safety audit, an FMCSA Motor Carrier Identification Report (Form MCS-150) update,
a vehicle registration activity, or a Unified Carrier Registration (UCR) system payment
activity in the past 3 years, or have current operating authority indicated in the FMCSA
Licensing and Insurance (L&I) database. Beginning on November 1, 2013, FMCSA’s
Unified Registration System (URS) rule requires all regulated entities to update their
registration information every 24 months. The Agency deactivates the U.S. Department
of Transportation (USDOT) number of any carrier that fails to comply with the biennial
update requirement.
Data Source: FMCSA, MCMIS, data snapshots as of December 30, 2016; December
29, 2017; December 28, 2018; December 27, 2019; and December 18, 2020.
2021 Pocket Guide to Large Truck and Bus Statistics 91-6 Active Hazardous Materials (HM) Carriers, 2016-2020
Active HM Carriers 2016 2017 2018 2019 2020
Interstate 70,556 75,350 76,131 80,810 84,226
Interstate HM Carriers Meeting
SMS Threshold 7,420 7,388 7,261 7,218 6,563
Interstate HM Carriers with a
Safety Permit (HMSP)* 1,144 1,128 883 843 827
Intrastate 28,033 30,450 33,091 35,075 36,626
Intrastate HM Carriers Meeting
SMS Threshold 2,484 2,449 2,444 2,557 2,276
Intrastate HMSP* 178 174 160 157 142
Total Active HMSP Carriers* 1,322 1,302 1,043 1,000 969
Total HM Carriers 98,589 105,800 109,222 115,885 120,852
*HMSP carriers are a subset of the total HM carrier population.
Note: The count of intrastate HM carriers includes a few active intrastate non-HM carriers with
HM activity that meets the Safety Measurement System (SMS) threshold definition.
Data Source: FMCSA, Motor Carrier Management Information System (MCMIS), data
snapshots as of December 30, 2016; December 29, 2017; December 28, 2018; December 27,
2019; and December 18, 2020.
1-7 Household Goods Carriers and Brokers Operating in the
United States, 2016-2020
Active Household Household Goods Property Brokers
Year Goods Carriers Brokers Registered Registered
2016 4,205 580 17,184
2017 4,394 671 17,966
2018 4,486 711 19,443
2019 4,666 878 20,892
2020 4,845 956 23,182
Note: A broker is an individual, partnership, or corporation that receives payment for arranging the
transportation of property or household goods belonging to others by using an authorized motor carrier.
Data Source: FMCSA, Licensing & Insurance (L&I), data snapshots as of December 30, 2016;
December 29, 2017; December 28, 2018; December 27, 2019; and December 18, 2020.
1-8 FMCSA-Regulated Carriers, 2016-2020
Motor Carrier Census Data 2016 2017 2018 2019 2020
Active Carriers with
a USDOT Number 538,049 558,993 586,720 602,542 637,721
Power Units 4,381,344 4,517,800 4,650,605 4,788,339 4,899,374
CDL Drivers 3,331,966 3,556,342 3,615,957 3,634,989 3,765,320
Total Drivers 4,686,239 4,870,951 5,024,814 5,151,130 5,310,094
Notes: Compared to prior publications, total driver and CDL counts changed due to new filters
being applied to exclude erroneous data in the motor carrier registration file. Only interstate
carriers and intrastate HM carriers with recent activity are included in this table. FMCSA regulates
all motor carriers that operate in interstate commerce, and certain requirements for motor carriers
and commercial motor vehicles (CMVs) that transport HM in intrastate commerce. Beginning on
November 1, 2013, FMCSA’s Unified Registration System (URS) rule requires all regulated entities
to update their registration information every 24 months. The Agency deactivates the USDOT
number of any carrier that fails to comply with the biennial update requirement.
Data Source: FMCSA, Motor Carrier Management Information System (MCMIS), data snapshots
as of December 30, 2016; December 29, 2017; December 28, 2018; December 27, 2019; and
December 18, 2020.
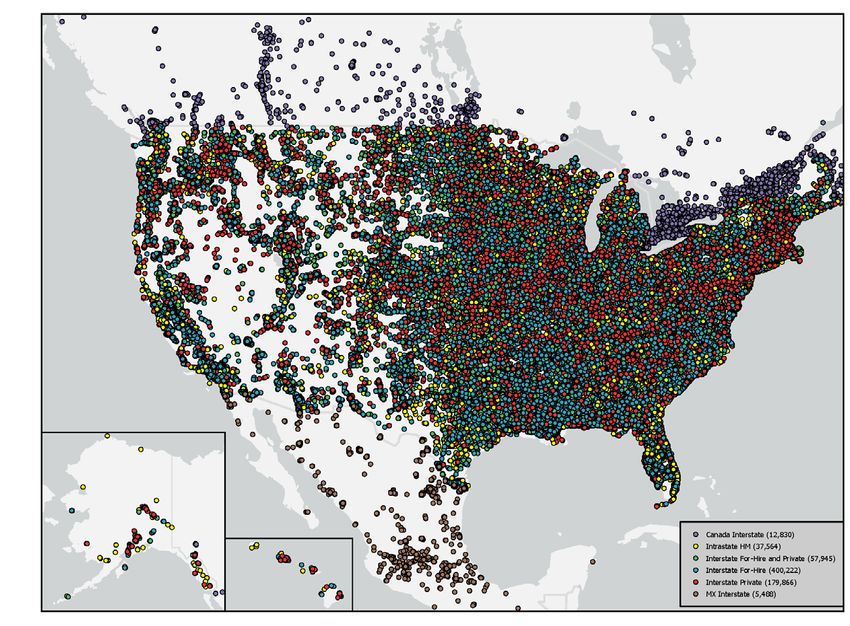
10 2021 Pocket Guide to Large Truck and Bus Statistics1-9 Carriers by Headquarters (Domicile) Location, 2020 Notes: Domicile refers to the headquarters location for a carrier. This map displays only interstate carriers and intrastate hazardous materials (HM) carriers. Intrastate non-HM carriers are not displayed. FMCSA regulates all motor carriers that operate in interstate commerce, and certain requirements for motor carriers and commercial motor vehicles (CMVs) that transport HM in intrastate commerce. The number of carriers depicted in this map may not be the same as reported elsewhere by FMCSA. Due to potential differences in reporting dates and quality issues with carrier addresses, this map may not include all current carriers. Additionally, the number of carriers that operate at any given time is subject to change due to enforcement actions, business turnover, and other factors. Data Source: FMCSA, Motor Carrier Management Information System (MCMIS), data snapshot as of December 18, 2020. 2021 Pocket Guide to Large Truck and Bus Statistics 11
1-10 FMCSA-Regulated Carriers by Domicile, 2020
                             Active Carriers with Power       CDL      Total
Country                       a USDOT Number       Units    Drivers   Drivers
United States                            619,492 4,762,224 3,639,585 5,167,657
Canada                                    12,551 103,339 102,697       112,432
Mexico                                      5,349   31,002    22,812    28,773
  Certificate Carriers                        171      636       522       631
  Commercial Zone Carriers                  5,030   28,841    21,249    26,544
  Enterprise Carriers                       1,012    6,846     6,198     6,738
  Long Haul Carriers                           62    1,132       737     1,172
Other Countries                               329    2,809       226     1,232
All Domiciles                            637,721 4,899,374 3,765,320 5,310,094

Notes: U.S. domiciled carriers include carriers domiciled in the 50 U.S. States, the
District of Columbia, and the U.S. territories. The sum of the Mexican carrier types
may not sum to the total as some of the Mexican-owned carriers are domiciled
in the United States. Only interstate carriers and intrastate hazardous materials
(HM) carriers with recent activity are included in this table. FMCSA regulates all
motor carriers that operate in interstate commerce, and certain requirements
for motor carriers and commercial motor vehicles (CMVs) that transport HM
in intrastate commerce. Beginning on November 1, 2013, FMCSA’s Unified
Registration System (URS) rule requires all regulated entities to update their
registration information every 24 months. The Agency deactivates the USDOT
number of any carrier that fails to comply with the biennial update requirement.
A Mexican certificate carrier is a Mexico-domiciled motor carrier that transports
exempt commodities or operates as a private motor carrier. These motor carriers
were issued authority to operate trucks to points in the United States beyond the
commercial zones. FMCSA stopped issuing these certificates in 2002. A Mexican
commercial zone carrier is a Mexico-domiciled carrier that has authority to operate
its trucks only within the U.S.-Mexico border commercial zones in the United
States. A Mexican enterprise carrier is a Mexican-owned or controlled carrier that
is domiciled in the United States and operates in the United States, conducting
cross-border transportation of international cargo that originates in or is destined
for a foreign country. A Mexican long-haul carrier is a Mexico-domiciled carrier that
has authority to engage in long-haul transportation in the United States as a motor
carrier of property (except household goods and placardable HM) in interstate
commerce in or beyond the border commercial zones. The authority does not
allow point-to-point transportation services within the United States for goods other
than international cargo. Reports include activity for all U.S. operations from the
date the carrier was first allowed to operate up through the date of the current data
snapshot.
Data Source: FMCSA, Motor Carrier Management Information System (MCMIS),
data snapshot as of December 18, 2020.

12     2021 Pocket Guide to Large Truck and Bus Statistics
1-11 FMCSA-Regulated Carriers by Number of Power Units,
2016-2020
Power Units 2016 2017 2018 2019 2020
1 Power Unit 249,972 261,116 278,448 289,408 317,791
2 Power Units 93,596 95,979 99,221 101,044 104,620
3–10 Power Units 139,549 143,248 147,710 149,225 150,545
11–100 Power Units 47,117 48,515 50,075 51,211 52,121
>100 Power Units 4,176 4,282 4,396 4,572 4,604
No Power Units/Unreported 3,639 5,853 6,870 7,082 8,040
Total 538,049 558,993 586,720 602,542 637,721
Only interstate carriers and intrastate hazardous materials (HM) carriers with
recent activity are included in this table. FMCSA regulates all motor carriers that
operate in interstate commerce, and certain requirements for motor carriers and
commercial motor vehicles (CMVs) that transport HM in intrastate commerce. Data
Source: FMCSA, Motor Carrier Management Information System (MCMIS), data
snapshots as of December 30, 2016; December 29, 2017; December 28, 2018;
December 27, 2019; and December 18, 2020.
1-12 Transportation Services Index (TSI) Freight and
Passenger Movement Estimates, 2000-2020
Freight Passengers Total
160
140
120
100
80
60
40
20
0
Notes: The Transportation Services Index (TSI), created by the U.S. Department of
Transportation (USDOT), Bureau of Transportation Statistics (BTS), measures the
movement of freight and passengers. The index, which is seasonally adjusted and
updated monthly, combines available data on freight traffic, as well as passenger
travel, that have been weighted to yield a monthly measure of transportation
services output. TSI numbers are BTS estimates. The index numbers for the latest
3 months are considered to be preliminary. BTS releases the preliminary number
for the latest month and replaces the number for the oldest preliminary month with
a revised number. Seasonal adjustment models for the modal data have been
updated for the data from January 2000 to the present.
Data Source: USDOT, BTS, TSI, available at https://www.transtats.bts.gov/OSEA/
TSI/ as of April 19, 2021.
2021 Pocket Guide to Large Truck and Bus Statistics 131-13 Average Daily Truck Traffic on the National Highway
System, 2012
Notes: In this map, both private and for-hire trucks are included. Trucks that are
used in movements for multiple modes and mail, or that move in conjunction
with domestic air cargo, are excluded. For more information on Freight Analysis
Framework (FAF) mode classes, refer to: https://www.bts.gov/archive/subject_areas/
freight_transportation/faf/users_guide/.
Data Source: Federal Highway Administration, Office of Freight Management and
Operations, FAF, Version V2016.09 as of April 2017
14 2021 Pocket Guide to Large Truck and Bus Statistics1-14 Weight of Freight Shipped within the United States by
Mode (in Millions of Tons), 2014-2018
Mode 2014 2015 2016 2017 2018
Truck 11,257 11,391 11,595 11,599 11,920
Rail 1,891 1,797 1,704 1,750 1,782
Water 748 737 734 780 838
Air* 5 5 5 6 6
Multiple Modes & Mail 491 487 484 495 504
Pipeline 2,950 2,985 2,959 3,062 3,346
Other** 248 247 241 244 221
Total 17,590 17,649 17,722 17,936 18,617
*Includes air and truck-air.
**Includes other, unknown, and no domestic mode.
Note: Includes domestic trade and the domestic portion of imports and exports.
Data Sources: U.S. Department of Transportation, Bureau of Transportation
Statistics and Federal Highway Administration, Freight Analysis Framework, version
4.5.1, as of May 2020, available at http://faf.ornl.gov.
1-15 Percent of Total Weight of Freight Moved by Mode, 2018
Other:
Pipeline: 1.2%
18.0%
Multiple Modes:
2.7%
Water:
4.5% Truck:
64.0%
Rail:
9.6%
Notes: Includes domestic trade and the domestic portion of imports and exports.
Air accounts for 0.03 percent of total domestic freight and is excluded from this
chart. Percentages may not sum to 100 percent due to rounding.
Data Sources: U.S. Department of Transportation, Bureau of Transportation
Statistics and Federal Highway Administration, Freight Analysis Framework, version
4.5.1, as of May 2020, available at http://faf.ornl.gov.
2021 Pocket Guide to Large Truck and Bus Statistics 151-16 Driver and Passenger Safety Belt Usage by Commercial
Motor Vehicle (CMV) Body Type, 2010, 2013, and 2016
Driver and Other Occupant
Group 2010 2013 2016
Buses
Commercial Bus 47.0% 74.4% 65.4%
School Bus 81.7% 85.9% 91.9%
15-Passenger Van - - 96.2%
Mini Bus 87.9% 86.3% 88.8%
Transit Bus - - 53.4%
Large Trucks
Bobtail 70.9% 86.2% 84.8%
Intermodal Container 75.3% 81.5% 92.6%
Dump 64.5% 69.3% 77.7%
Flatbed 74.0% 81.9% 82.2%
Van (Enclosed Box Truck) 80.2% 85.7% 87.4%
Tanker 82.5% 85.3% 87.9%
Other 73.3% 80.9% 84.7%
Notes: Prior to 2016, the body type “15-Passenger Van” was captured in the “Mini
Bus” category. “Transit Bus” was included as a category for the first time in 2016.
The Seat Belt Use by Commercial Motor Vehicle Drivers (SBUCMVD) Survey is
conducted every 3 years. In 2016, a total of 39,319 commercial motor vehicles,
39,319 drivers, and 2,451 other occupants were observed at 1,008 sites. Only driver
belt use is observed for buses (for the purpose of this study, 15-passenger vans are
counted as buses). “Other occupants” are right-front passengers.
Data Source: FMCSA, SBUCMVD 2016 Survey. For more information, refer to:
http://www.fmcsa.dot.gov/safety/safety-belt/safety-belt-studies.
1-17 CMV Driver and Passenger Safety Belt Usage by
Occupant Type, 2010, 2013, and 2016
Occupant Type 2010 2013 2016
All Occupants 77.1% 83.0% 84.9%
Drivers 78.1% 83.7% 86.1%
Other Occupants 64.0% 72.9% 69.8%
Notes: The Seat Belt Use by Commercial Motor Vehicle Drivers (SBUCMVD) Survey
is conducted every 3 years. In 2016, a total of 39,319 commercial motor vehicles,
39,319 drivers, and 2,451 other occupants were observed at 1,008 sites. Only driver
belt use is observed for buses (for the purpose of this study, 15-passenger vans are
counted as buses). “Other occupants” are right-front passengers.
Data Source: FMCSA, SBUCMVD 2016 Survey. For more information, refer to:
http://www.fmcsa.dot.gov/safety/safety-belt/safety-belt-studies.
16 2021 Pocket Guide to Large Truck and Bus Statistics1-18 Number of Medical Examiners Certified by State, 2021
Sources: Esri, HERE, Garmin, FAO, NOAA,
1,201 - 1,600
801 - 1,200
401 - 800
> 1,600
Certified
≤ 400
Notes: In April 2021, there were 76,396 medical examiners certified on the
National Registry of Certified Medical Examiners (National Registry). If a medical
examiner has multiple offices in the same State, the examiner is counted once.
However, if a medical examiner has a business office in two or more States, the
examiner will be counted once in each State.
Data Source: FMCSA, National Registry, April 27, 2021. Available at https://
nationalregistry.fmcsa.dot.gov.
2021 Pocket Guide to Large Truck and Bus Statistics 172. Inspections and Violations
What is an Inspection?
An inspection is an examination of an individual commercial
motor vehicle (CMV) and/or driver by an authorized safety
inspector. State inspectors conduct approximately 95 percent
of inspections, with the remainder conducted by Federal
inspectors. The inspection determines whether the driver and/
or the CMV is in compliance with the Federal Motor Carrier
Safety Regulations (FMCSRs) or the Hazardous Materials
Regulations (HMRs), as appropriate. Serious violations result
in the issuance of vehicle or driver out-of-service (OOS)
orders. These violations must be corrected before the affected
driver or vehicle can return to service.
2-1 Inspections Conducted by Federal and State Inspectors,
2016-2020
2016 2017 2018 2019 2020
Inspections 3,401,103 3,457,130 3,515,954 3,469,717 2,570,280
State 3,280,166 3,334,891 3,390,262 3,361,353 2,545,582
Federal 120,937 122,239 125,692 108,364 24,698
Data Source: FMCSA, Motor Carrier Management Information System (MCMIS),
data snapshot as of January 29, 2021.
2-2 Safety Inspectors, Federal and State, 2016-2020
Inspector Type 2016 2017 2018 2019 2020
Safety Inspectors 14,830 14,182 13,839 13,588 12,760
State 14,321 13,657 13,320 13,080 12,401
Federal 509 525 519 508 359
Note: Not all personnel indicated are assigned full-time to conducting inspections.
Data Source: FMCSA, Motor Carrier Management Information System (MCMIS),
data snapshot as of January 29, 2021.
18 2021 Pocket Guide to Large Truck and Bus Statistics2-3 Inspections by County, 2020
Sources: Esri, HERE, Garmin, FAO, NOAA,
10,001 - 20,000
1,001 - 10,000
501 - 1,000
Inspections
101 - 500
> 20,000
1-100
0
Data Source: FMCSA, Motor Carrier Management Information System (MCMIS),
data snapshot as of January 31, 2021.
2021 Pocket Guide to Large Truck and Bus Statistics 192-4 Inspection Out-of-Service (OOS) Rates, 2016-2020
Type of Inspection 2016 2017 2018 2019 2020
Driver Inspections* 3,283,556 3,344,956 3,402,946 3,353,735 2,460,580
With OOS Violation 161,111 170,843 161,203 170,874 129,442
Driver OOS Rate 4.9% 5.1% 4.7% 5.1% 5.3%
Vehicle Inspections** 2,337,164 2,382,217 2,410,876 2,384,413 1,759,961
With OOS Violation 466,839 493,581 501,729 492,129 364,598
Vehicle OOS Rate 20.0% 20.7% 20.8% 20.6% 20.7%
Hazmat Inspections*** 201,309 200,067 202,077 202,912 149,805
With OOS Violation 7,930 7,935 8,437 9,150 6,557
Hazmat OOS Rate 3.9% 4.0% 4.2% 4.5% 4.4%
*Driver Inspections were computed based on inspection levels I, II, III, and VI.
**Vehicle Inspections were computed based on inspection levels I, II, V, and VI.
***Hazmat Inspections were computed based on inspection levels I, II, III, IV, V,
and VI when hazardous materials were present.
Notes: Inspection OOS rates depicted in this table include both large trucks and
buses. Counts in this table include Federal and State inspections. For more
information on inspections and inspection levels, please refer to http://cvsa.org/
inspections/inspections/all-inspection-levels/.
Data Source: FMCSA, Motor Carrier Management Information System (MCMIS),
data snapshot as of January 29, 2021.
20 2021 Pocket Guide to Large Truck and Bus Statistics2-5 Inspections by Level, 2016-2020
Inspection Level 2016 2017 2018 2019 2020
I. Full 1,013,253 1,039,143 1,104,938 1,069,471 771,662
With OOS Violation(s)* 252,221 266,480 278,174 266,595 191,625
II. Walk-Around 1,217,351 1,237,851 1,202,248 1,208,460 889,351
With OOS Violation(s)* 269,558 285,232 280,165 285,658 217,833
III. Driver Only 1,052,708 1,067,350 1,094,817 1,074,811 798,973
With OOS Violation(s)* 64,117 65,297 55,528 58,498 43,772
IV. Special Study 11,231 7,563 10,261 10,493 11,346
With OOS Violation(s)* 2,079 1,596 1,998 1,753 1,842
V. Terminal 106,316 104,611 102,747 105,489 98,354
With OOS Violation(s)* 6,184 5,837 5,722 5,862 4,516
VI. Radioactive Materials 244 612 943 993 594
With OOS Violation(s)* 11 13 5 8 5
Total 3,401,103 3,457,130 3,515,954 3,469,717 2,570,280
*Out-of-service (OOS) violation numbers are based on inspections. For example,
in 2020, there were 771,662 Level I inspections. Out of all the Level I inspections
completed, 191,625 resulted in at least one OOS violation.
Note: For more information on inspections and inspection levels, please refer to http://
cvsa.org/inspections/inspections/all-inspection-levels/.
Data Source: FMCSA, Motor Carrier Management Information System (MCMIS), data
snapshot as of January 29, 2021.
2-6 Inspections by Level, 2020
V. Terminal VI. Radioactive
98,354 Materials
3.8% 594
IV. Special Study 0.02%
11,346 I. Full
0.04% 771,662
30.0%
III. Driver Only
798,973
31.1%
II. Walk-Around
889,351
34.6%
Note: For more information on inspections and inspection levels, please refer to http://
cvsa.org/inspections/inspections/all-inspection-levels/.
Data Source: FMCSA, Motor Carrier Management Information System (MCMIS), data
snapshot as of January 29, 2021.
2021 Pocket Guide to Large Truck and Bus Statistics 212-7 Inspections by Carrier Fleet Size, 2016-2020
Carrier Fleet Size 2016 2017 2018 2019 2020
Very Small
(1-6 Power Units) 1,070,118 1,096,781 1,118,490 1,090,273 823,135
Small
(7-20 Power Units) 598,280 605,352 614,298 610,541 441,460
Medium
(21-100 Power Units) 725,612 733,737 737,394 728,794 531,871
Large
(>100 Power Units) 853,350 878,085 895,320 891,735 679,554
Unknown 153,743 143,175 150,448 148,374 94,260
Total 3,401,103 3,457,130 3,515,950 3,469,717 2,570,280
Note: Carriers listed as having zero power units are included in the “Unknown” category.
Data Source: FMCSA, Motor Carrier Management Information System (MCMIS),
data snapshot as of January 29, 2021.
2-8 Inspections by Carrier Operation, 2016-2020
Carrier Operation 2016 2017 2018 2019 2020
Interstate 2,777,374 2,808,415 2,794,424 2,766,763 2,029,951
Intrastate 623,729 648,715 721,530 702,954 540,329
Total 3,401,103 3,457,130 3,515,954 3,469,717 2,570,280
Data Source: FMCSA, Motor Carrier Management Information System (MCMIS),
data snapshot as of January 29, 2021.
2-9 Inspections by Gross Combination Weight Rating (GCWR),
2016-2020
GCWR 2016 2017 2018 2019 2020
26,000 pounds 2,735,246 2,816,227 2,829,302 2,775,774 2,007,230
Unknown 178,468 129,325 123,001 117,656 104,484
Total 3,401,103 3,457,130 3,515,954 3,469,717 2,570,280
Note: GCWRs are based on Inspection Reports as reported in MCMIS.
Data Source: FMCSA, Motor Carrier Management Information System (MCMIS),
data snapshot as of January 29, 2021.
22 2021 Pocket Guide to Large Truck and Bus Statistics2-10 Most Frequent Driver Violations in Inspections, 2020
Number of
Violation Code Category Violation Description Violations
392.2SLLS2 Traffic Enforcement State/Local Laws - Speeding 6-10 miles per hour 58,134
over the speed limit.
392.2C Traffic Enforcement Failure to obey traffic control device 49,454
392.16 Seat Belt Failing to use seat belt while operating a CMV 45,397
395.8E No Log/Log Not False report of drivers record of duty status 35,056
Current
392.2LV Traffic Enforcement Lane Restriction violation 33,022
395.8 No Log/Log Not Record of Duty Status violation (general/form and 32,577
Current manner)
383.23A2 All Other Driver Operating a CMV without a CDL 32,538
Violations
392.2SLLS3 Traffic Enforcement State/Local Laws - Speeding 11-14 miles per hour 29,327
over the speed limit.
391.41AF Medical Certificate Operating a property-carrying vehicle without 27,381
possessing a valid medical certificate.
395.8AELD No Log/Log Not ELD - No record of duty status (ELD Required) 26,227
Current
391.41A Medical Certificate No medical certificate in driver's possession 25,635
392.2SLLS4 Traffic Enforcement State/Local Laws - Speeding 15 or more miles per 20,021
hour over the speed limit.
395.24D No Log/Log Not ELD cannot transfer ELD records electronically 19,796
Current
395.22H4 No Log/Log Not Driver failed to maintain supply of blank drivers 16,342
Current records of duty status graph-grids
395.22H2 No Log/Log Not Driver failing to maintain ELD instruction sheet 16,332
Current
395.8F01 No Log/Log Not Drivers record of duty status not current 16,179
Current
395.22G All Other Driver Portable ELD not mounted in a fixed position and 15,768
Violations visible to driver
392.82A1 All Other Driver Using a hand-held mobile telephone while 14,634
Violations operating a CMV
395.22H1 No Log/Log Not Driver failing to maintain ELD user's manual 13,261
Current
395.24C2III All Other Driver Driver failed to manually add shipping document 12,515
Violations number
Notes: Total number of driver inspections in 2020: 2,460,580. Total number of
driver violations in 2020: 765,526. Total number of driver out-of-service (OOS)
violations in 2020: 151,145. Only the top 20 driver violations (based on frequency
of occurrence) are listed in this table.
Data Source: FMCSA, Motor Carrier Management Information System (MCMIS),
data snapshot as of January 29, 2021.
2021 Pocket Guide to Large Truck and Bus Statistics 232-11 Most Frequent Vehicle Violations in Inspections, 2020
Violation Number of
Code Category Violation Description Violations
393.9 Lighting Inoperable Required Lamp 311,791
396.17C Periodic Operating a CMV without proof of a periodic inspection 136,106
Inspection
393.47E Brakes Clamp or Roto type brake out-of-adjustment 113,386
393.95A Emergency No/discharged/unsecured fire extinguisher 99,321
Equipment
396.3A1 All Other Vehicle Inspection, repair and maintenance of parts and 90,580
Defects accessories
393.9TS Lighting Inoperative turn signal 88,361
393.11 Lighting No or defective lighting devices or reflective material 80,162
as required
393.75A3 Tires Tire-flat and/or audible air leak 70,584
393.75C Tires Tire-other tread depth less than 2/32 of inch measured 69,656
in a major tread groove
393.78 Windshield Windshield wipers inoperative/defective 64,711
393.53B Brakes CMV manufactured after 10/19/94 has an automatic 62,932
airbrake adjustment system that fails to compensate
for wear
396.5B All Other Vehicle Oil and/or grease leak 57,441
Defects
393.95F Emergency No / insufficient warning devices 51,584
Equipment
396.3A1BOS Brakes Brakes Out Of Service: The number of defective brakes 45,465
is equal to or greater than 20 percent of the service
brakes on the vehicle or combination
393.48A Brakes Inoperative/defective brakes 44,629
393.9H Lighting Inoperable head lamps 44,471
393.45B2 Brakes Brake hose or tubing chafing and/or kinking 43,704
393.55E Brakes No or Defective ABS Malfunction Indicator Lamp for 42,870
trailer manufactured after 03/01/1998
396.3A1B Brakes Brakes (general) 40,383
393.60C Windshield Damaged or discolored windshield 34,858
Notes: Total number of vehicle inspections in 2020: 1,759,961. Total number
of vehicle violations in 2020: 2,543,126. Total number of vehicle out-of-service
violations in 2020: 549,413. Only the top 20 vehicle violations (based on frequency
of occurrence) are listed in this table.
Data Source: FMCSA, Motor Carrier Management Information System (MCMIS),
data snapshot as of January 29, 2021.
24 2021 Pocket Guide to Large Truck and Bus Statistics2-12 Traffic Enforcement Inspections, 2016-2020 Activity Summary 2016 2017 2018 2019 2020 Number of Traffic Enforcement 314,049 328,866 350,102 353,646 291,579 Inspections (Driver observed) With Moving Violations 310,685 325,186 345,943 349,427 288,086 With Drug & Alcohol Violations 4,160 4,679 5,365 5,493 4,273 With Railroad Crossing Violations 218 223 210 252 183 Number of Traffic Enforcement Inspections (Vehicle observed) 234,651 223,944 217,400 237,167 197,204 Total Number of Traffic Enforcement Inspections 548,700 552,810 567,501 590,813 488,783 Notes: One inspection may result in more than one violation; therefore, totals may not equal the sum of all components. The traffic enforcement program involves the enforcement of 26 moving and non-moving driver violations, which are included in the driver violation portion of the inspection procedures. As of January 2017, two new traffic enforcement violations were added: “driving a commercial motor vehicle (CMV) while texting” and “using a hand-held mobile telephone while operating a CMV.” These violations are included in the moving violations category. Data Source: FMCSA, Motor Carrier Management Information System (MCMIS), data snapshot as of January 29, 2021. 2-13 Traffic Enforcement Violations, 2016-2020 Activity Summary 2016 2017 2018 2019 2020 Number of Traffic Enforcement 337,098 354,488 378,827 384,212 316,520 Violations (Driver observed) Moving Violations 331,962 348,691 372,043 377,138 310,788 Drug & Alcohol Violations 4,917 5,573 6,573 6,821 5,181 Railroad Crossing Violations 219 224 211 253 184 Number of Traffic Enforcement Violations (Vehicle observed) 450,827 437,138 426,697 470,692 405,317 Total Number of Traffic Enforcement Violations 787,925 791,626 805,524 854,904 721,837 Notes: The traffic enforcement program involves the enforcement of 26 moving and non-moving driver violations, which are included in the driver violation portion of the inspection procedures. Inspections that result in drug- or alcohol-related violations are included as traffic enforcement type inspections if another moving violation is present. As of January 2017, two new traffic enforcement violations were added: “driving a commercial motor vehicle (CMV) while texting” and “using a hand-held mobile telephone while operating a CMV.” These violations are included in the moving violations category. Data Source: FMCSA, Motor Carrier Management Information System (MCMIS), data snapshot as of January 29, 2021. 2021 Pocket Guide to Large Truck and Bus Statistics 25
3. Investigations
This chapter provides summarized data for the past 5 years
on all types of investigations and reviews conducted on motor
carriers that transport property or passengers in interstate
or intrastate commerce. Investigations are conducted to
investigate identified areas of non-compliance and safety
concerns, with a focus on carriers identified as high risk; to
investigate complaints; or in response to other safety and
compliance concerns. It is intended that through education,
heightened safety regulation awareness, and the enforcement
effects of investigations, motor carriers will improve the safety
of their commercial vehicle operations and, ultimately, reduce
their involvement in crashes.

The Compliance, Safety, Accountability (CSA) program is
FMCSA’s enforcement model to focus the Agency’s efforts
on large truck and bus safety and to prevent crashes,
injuries, and fatalities related to commercial motor vehicles
(CMVs). This program has introduced an enforcement
and compliance model that allows FMCSA and its State
partners to contact more carriers earlier in order to address
safety deficiencies before crashes occur. The CSA program
provides a nationwide system for making the roads safer for
motor carriers and the public alike.

Companies investigated by FMCSA include, but are not
limited to: trucking companies, household goods moving
companies, bus companies, cargo tank facilities, and
hazardous materials shippers.

For more statistics on investigations, please refer to:
http://ai.fmcsa.dot.gov/SafetyProgram/Review.aspx.

26   2021 Pocket Guide to Large Truck and Bus Statistics
3-1   Investigations by State, 2020

                                                                                                                              Sources: Esri, HERE, Garmin, FAO, NOAA,
                                                                                         151 - 300
                                                                                                     301 - 650
                                                                              51 - 150
                                                                    21 - 50

                                                                                                                 > 650
                                                   Reviews
                                                             ≤ 20

Data Source: FMCSA, Motor Carrier Management Information System (MCMIS),
data snapshot as of January 31, 2021.

		                 2021 Pocket Guide to Large Truck and Bus Statistics                                                   27
3-2 Investigations Conducted by Federal and State
Investigators, 2016-2020
Investigations 2016 2017 2018 2019 2020
State 6,320 6,460 6,048 5,376 4,396
Federal 7,762 8,584 8,174 7,661 7,037
Total 14,082 15,044 14,222 13,037 11,433
Data Source: FMCSA, Motor Carrier Management Information System (MCMIS), data
snapshot as of January 29, 2021.
3-3 Interventions by Type, 2016-2020
Intervention Type 2016 2017 2018 2019 2020
Investigations 14,082 15,044 14,222 13,037 11,433
Onsite Comprehensive 6,080 6,440 5,883 5,358 1,968
Onsite Focused 6,907 7,675 7,418 5,936 3,596
Offsite 118 76 330 1,374 5,753
Cargo Tank Facility Reviews 82 131 92 82 27
Shipper Reviews 169 40 12 7 2
Non-Rated Reviews 742 697 502 292 88
Warning Letters 35,756 28,508 30,150 26,564 22,230
Security Contact Reviews 532 426 349 344 164
Totral Terminal Investigations 5,799 15,296 20,439 24,996 23,485
Notes: Warning letters are based on a Safety Measurement System (SMS) algorithm
that was implemented nationally in December of 2010.
Data Source: FMCSA, Motor Carrier Management Information System (MCMIS), data
snapshot as of January 29, 2021.
3-4 FMCSA-Regulated Carriers by Safety Rating, 2020
Interstate Interstate
Safety Freight Intrastate HM Passenger
Rating Carriers Carriers Carriers All Carriers
Conditional 12,035 529 191 12,755
Satisfactory 32,544 1,801 2,755 37,100
Unsatisfactory 986 115 12 1,113
No Rating 526,921 34,144 7,459 568,524
Total 572,486 36,589 10,417 619,492
Note: In order to receive a safety rating, a carrier must have received a compliance
review or comprehensive onsite investigation.
Data Source: FMCSA, Motor Carrier Management Information System (MCMIS), data
snapshot as of December 18, 2020.
28 2021 Pocket Guide to Large Truck and Bus Statistics3-5 Passenger Carrier, Hazardous Materials Carrier, and
Household Goods Carrier Investigations, 2016-2020
Carriers by Vehicle Type 2016 2017 2018 2019 2020
Any Passenger Vehicles* 1,324 1,552 1,166 1,162 399
Motorcoaches 984 1,199 915 964 227
School Buses 168 186 176 315 107
Vans 302 348 281 160 91
Mini Buses 417 541 390 178 70
Limousines 140 116 100 219 80
Hazardous Materials 808 643 524 560 439
Household Goods 177 181 172 135 62
*The “Any Passenger Vehicles” row might not equal the sum of subcategories for a
given row due to carriers applying for multiple passenger authority at the time of the
application.
Notes: Passenger carriers were those carriers that registered to transport passengers
and owned or leased at least one passenger vehicle (motorcoach, school bus, van,
mini-bus, or limousine). Beginning in 2014, reporting criteria for identifying passenger
carrier investigations was updated. As a result, data may differ from previous versions.
Passenger carrier investigations now reflect investigations performed by Federal
and State personnel on motor carriers that were subject to the Safety Measurement
System (SMS) passenger carrier threshold at the time of the investigations.
Data Source: FMCSA, Motor Carrier Management Information System (MCMIS), data
snapshot as of January 29, 2021.
3-6 Investigations by Carrier Fleet Size, 2016-2020
Carrier Fleet Size 2016 2017 2018 2019 2020
Very Small (1-6 Power Units) 8,181 8,976 8,465 7,498 6,131
Small (7-20 Power Units) 3,593 3,741 3,615 3,425 3,243
Medium (21-100 Power Units) 1,720 1,836 1,709 1,663 1,696
Large (>100 Power Units) 348 335 344 374 332
No Power Units/Unreported 240 156 89 77 31
Total 14,082 15,044 14,222 13,037 11,433
Note: Carriers listed as having zero power units are included in the “No Power
Units/Unreported” category.
Data Source: FMCSA, Motor Carrier Management Information System (MCMIS),
data snapshot as of January 29, 2021.
2021 Pocket Guide to Large Truck and Bus Statistics 293-7 New Entrant Safety Audits, 2016-2020 Year Safety Audits Safety Audit Pass Rate 2016 37,548 88.6% 2017 36,214 89.8% 2018 37,348 89.3% 2019 40,276 88.2% 2020 40,129 92.6% Notes: A new entrant is a motor carrier that applies for a USDOT number in order to initiate operations in interstate commerce or the intrastate transportation of hazardous materials (HM). Carriers remain in the New Entrant Safety Assurance Program until they pass the safety audit and have been in business for 18 months. For more information on the New Entrant Safety Assurance Program, visit http://www.fmcsa.dot.gov/safety/new-entrant-safety-assurance-program. Data Source: FMCSA, Motor Carrier Management Information System (MCMIS), data snapshot as of January 29, 2021. 30 2021 Pocket Guide to Large Truck and Bus Statistics
3-8     Summary of Closed Enforcement Cases, 2016-2020
                    2016             2017           2018            2019             2020
                   Cases            Cases          Cases           Cases            Cases
                  (Amount          (Amount        (Amount         (Amount          (Amount
Subject Type       Settled)         Settled)       Settled)        Settled)         Settled)
                          0                0               0               0                0
Broker                  ($0)             ($0)            ($0)            ($0)            ($0)
Cargo Tank               27               35              25              15                9
Facility            ($732,110)      ($938,720)      ($593,650)      ($118,830)    ($12,288,560)
                       4,309            4,617           4,125           3,498           2,404
Carrier          ($32,493,395)    ($33,288,715)   ($29,116,929)   ($22,453,405)    ($14,601,314)
                          0                0               0               1                0
Drug Consortium         ($0)             ($0)            ($0)         ($5,890)           ($0)
                         79               64              70              41               11
Freight Forwarder ($901,410)        ($922,352)       ($955,874)      ($416,212)       ($59,700)
                        144              166             139             121               54
HM Carrier        ($1,908,390)     ($2,341,200)    ($1,673,220)    ($1,161,700)      ($405,289)
HM Carrier                0                0               0               0                1
(Not Placarded)         ($0)             ($0)            ($0)            ($0)          ($3,110)
HM Carrier/             147              107              80              52               25
Shipper            ($1,561,249)    ($1,407,510)      ($963,390)      ($575,100)      ($287,780)
                          3                3               4               3                0
Other                ($28,300)       ($15,360)        ($16,716)       ($19,640)           ($0)
Passenger               185              206              92              63               34
Carrier           ($1,726,254)     ($1,779,542)     ($972,746)      ($449,133)      ($217,650)
                          3                5               2               0                0
Shipper              ($30,790)        ($41,650)       ($30,110)          ($0)            ($0)
Small Passenger           0                0               0               0                0
Carrier                 ($0)             ($0)            ($0)            ($0)            ($0)
                     4,897            5,203           4,537           3,794           2,538
Total            ($39,381,898)    ($40,735,049)   ($34,322,635)   ($25,199,910)   ($27,863,403)

Notes: FMCSA is responsible for ensuring full compliance with all Federal Motor
Carrier Safety Regulations (FMCSRs) and Hazardous Materials Regulations (HMRs)
required of large truck and bus companies regulated by the U.S. Department
of Transportation (USDOT). This table provides data for 5 calendar years of
enforcement cases considered “closed” for large truck and bus companies regulated
by the USDOT. An enforcement case is deemed “closed” once FMCSA issues a
carrier a “Notice of Claim” (NOC) and the carrier has (1) paid the penalty in full,
(2) signed a settlement agreement, (3) defaulted on the NOC, upon which a “Final
Agency Order” is issued, or (4) found liable for violations charged in the NOC after
adjudication.
Data Sources: FMCSA, Motor Carrier Management Information System (MCMIS),
Enforcement Management Information System (EMIS), January 29, 2021.

		                      2021 Pocket Guide to Large Truck and Bus Statistics                    31
4. Crashes In 2019, of the 33,244 fatal crashes on the Nation’s roadways, 4,696 (14.1 percent) involved at least one large truck or bus. In addition, there were an estimated 6,722,000 nonfatal crashes, 575,000 (8.6 percent) of which involved at least one large truck or bus. For more information on large truck and bus crashes, please refer to the annual Large Truck and Bus Crash Facts publication available at http://www.fmcsa.dot.gov/safety/data-and-statistics/large-truck-and- bus-crash-facts. Data Sources: FARS: Maintained by the National Highway Traffic Safety Administration (NHTSA), the Fatality Analysis Reporting System (FARS) is an annual census of fatal crashes involving motor vehicles traveling on public trafficways. Beginning with data for 2016, the National Highway Traffic Safety Administration (NHTSA) implemented changes to revise vehicle classification based on gross vehicle weight rating (GVWR), which reclassified 329 light pickup trucks as large trucks. Due to this methodology change, comparisons of the 2016 (and later) FARS large truck data with prior years should be performed with caution. For more information on FARS, refer to http://www.nhtsa.gov/FARS. CRSS: NHTSA established the Crash Report Sampling System (CRSS) in 2016 when the long-running General Estimates System (GES) was retired. CRSS is a sample of police-reported crashes involving all types of motor vehicles, pedestrians, and cyclists, ranging from property-damage-only crashes to those that result in fatalities. CRSS is used to estimate the overall crash picture, identify highway safety problem areas, measure trends, inform consumer information initiatives, and support cost and benefit analyses of highway safety initiatives and regulations. The data from CRSS yield national estimates through a weighting procedure but cannot give State-level estimates. Because CRSS is a sample of motor vehicle crashes, the results generated are estimates rounded to the nearest 1000; however, associated percentages and rates are based on the unrounded data. To learn more about CRSS, visit https://www. nhtsa.gov/ national-center-statistics-and-analysis-ncsa/crash-report-sampling-system- crss#crash-report-sampling-system-crss-data-files. MCMIS: Maintained by FMCSA, the Motor Carrier Management Information System (MCMIS) Crash File contains data on commercial trucks and buses in fatal, injury, and towaway crashes (crashes in which at least one vehicle is disabled as a result of the crash and transported away from the crash scene). Crash severity thresholds and vehicle type definitions in MCMIS differ slightly from those in FARS and GES/CRSS, and all tables are noted accordingly. 32 2021 Pocket Guide to Large Truck and Bus Statistics
All MCMIS crash data presented are considered preliminary for 22 months.
For more information on MCMIS, refer to https://ask.fmcsa.dot.gov/app/
mcmiscatalog/mcmishome.

NHTSA Crash Severity Levels:

This Pocket Guide includes data on police-reported crashes collected by
NHTSA, which include fatal, injury, and property-damage-only (PDO) crashes.

1. Fatal crashes include police-reported crashes involving a motor vehicle in
      transport on a trafficway in which at least one person dies within 30 days of
      the crash. The fatality does not have to occur at the scene of the crash and
      includes any person involved, including non-motorists.

2. Injury crashes include police-reported crashes involving a motor vehicle
      in transport on a trafficway in which no one died but at least one person
      was reported to have: (1) an incapacitating injury; (2) a visible but not
      incapacitating injury; (3) a possible, not visible injury; or (4) an injury of
      unknown severity.
3.    PDO crashes include police-reported crashes involving a motor vehicle in
      transport on a trafficway in which no one involved in the crash suffered any
      injuries.

For more information on crash severity levels, refer to NHTSA’s
National Center for Statistics and Analysis (NCSA) Data Resource Web site at:
https://crashstats.nhtsa.dot.gov/#/.

Vehicles in Crashes:

Large Trucks: FARS and GES/CRSS define a large truck as a truck with a
gross vehicle weight rating (GVWR) greater than 10,000 pounds. The Motor
Carrier Management Information System (MCMIS) defines a large truck as
a vehicle designed, used, or maintained primarily for carrying property, with
a GVWR or gross combination weight rating (GCWR) of more than 10,000
pounds, or any vehicle carrying hazardous materials that requires placarding,
regardless of weight.

Buses: A bus is defined as a vehicle with seats for at least nine people,
including the driver.

		                  2021 Pocket Guide to Large Truck and Bus Statistics         33
4-1 Total Crashes by Vehicle Type, 2016-2019
Number of Crashes Involving:
Year Large Trucks Buses Large Trucks and Buses All Vehicle Types
2016 434,000 67,000 496,000 6,821,000
2017 450,000 66,000 512,000 6,454,000
2018 499,000 65,000 560,000 6,735,000
2019 510,000 72,000 580,000 6,755,000
Notes: Individual subtotals may not add to the totals due to the potential for double counting
(e.g., crashes involving both a truck and a bus). A large truck is defined here as a truck with
a GVWR greater than 10,000 pounds. A bus is defined as a vehicle with seats for at least
nine people, including the driver. The “All Vehicle Types” category includes crashes involving
passenger cars, light trucks, large trucks, buses, motorcycles, or any other type of motorized
vehicle. These numbers include fatal crash data from FARS and injury crash and property-
damage-only (PDO) crash data from CRSS. CRSS takes samples motor vehicle crashes—the
results generated are estimates rounded to the nearest one thousand; however, associated
percentages and rates are based on the unrounded data.
Data Sources: NHTSA, FARS, and CRSS.
4-2 Fatal Crashes by Vehicle Type, 2016-2019
Number of Crashes Involving:
Year Large Trucks Buses Large Trucks and Buses All Vehicle Types
2016 4,177 231 4,396 34,748
2017 4,367 231 4,587 34,560
2018 4,461 234 4,678 33,919
2019 4,479 231 4,696 33,244
Notes: Individual subtotals may not add to the totals due to the potential for double counting
(e.g., crashes involving both a truck and a bus). A large truck is defined here as a truck with
a GVWR greater than 10,000 pounds. A bus is defined as a vehicle with seats for at least
nine people, including the driver. The “All Vehicle Types” category includes crashes involving
passenger cars, light trucks, large trucks, buses, motorcycles, or any other type of motorized
vehicle.
Data Source: NHTSA, FARS.
34 2021 Pocket Guide to Large Truck and Bus Statistics4-3 Injury Crashes by Vehicle Type, 2016-2019
Number of Crashes Involving:
Year Large Trucks Buses Large Trucks and Buses All Vehicle Types
2016 97,000 16,000 112,000 2,116,000
2017 102,000 15,000 116,000 1,889,000
2018 107,000 15,000 121,000 1,894,000
2019 114,000 13,000 127,000 1,916,000
Notes: Individual subtotals may not add to the totals due to the potential for double counting
(e.g., crashes involving both a truck and a bus). A large truck is defined here as a truck with a
gross vehicle weight rating (GVWR) greater than 10,000 pounds. A bus is defined as a vehicle
with seats for at least nine people, including the driver. The “All Vehicle Types” category
includes crashes involving passenger cars, light trucks, large trucks, buses, motorcycles, or
any other type of motorized vehicle. These numbers include injury crash data from CRSS.
CRSS takes samples motor vehicle crashes—the results generated are estimates rounded
to the nearest one thousand; however, associated percentages and rates are based on the
unrounded data.
Data Sources: NHTSA, and CRSS.
4-4 Property-Damage-Only (PDO) Crashes by Vehicle Type,
2016-2019
Number of Crashes Involving:
Year Large Trucks Buses Large Trucks and Buses All Vehicle Types
2016 333,000 51,000 380,000 4,670,000
2017 344,000 51,000 391,000 4,530,000
2018 388,000 50,000 434,000 4,807,000
2019 392,000 59,000 448,000 4,806,000
Notes: Individual subtotals may not add to the totals due to the potential for double counting
(e.g., crashes involving both a truck and a bus). A large truck is defined here as a truck with a
gross vehicle weight rating (GVWR) greater than 10,000 pounds. A bus is defined as a vehicle
with seats for at least nine people, including the driver. The “All Vehicle Types” category
includes crashes involving passenger cars, light trucks, large trucks, buses, motorcycles, or
any other type of motorized vehicle. These numbers include PDO crash data from CRSS.
CRSS takes samples of motor vehicle crashes—the results generated are estimates rounded
to the nearest one thousand; however, associated percentages and rates are based on the
unrounded data.
Data Sources: NHTSA and CRSS.
2021 Pocket Guide to Large Truck and Bus Statistics 354-5 Large Truck Fatal Crashes, 1975-2019
Rates per
100 Million VMT
Fatal Total Fatal
Crashes Large Fatalities Million Crashes Fatalities
Involving Truck in Large VMT by Involving in Large Large
Large Occupant Truck Large Large Truck Trucks
Year Trucks Fatalities Crashes Trucks Trucks Crashes Registered
1975 3,722 961 4,483 81,330 4.58 5.51 5,362,369
1980 5,042 1,262 5,971 108,491 4.65 5.50 5,790,653
1985 4,841 977 5,734 123,504 3.92 4.64 5,996,337
1990 4,518 705 5,272 146,242 3.09 3.60 6,195,876
1995 4,194 648 4,918 178,156 2.35 2.76 6,719,421
2000 4,573 754 5,282 205,520 2.23 2.57 8,022,649
2005 4,551 804 5,240 222,523 2.05 2.35 8,481,999
2010 3,271 530 3,686 286,527 1.14 1.29 10,770,054
2011 3,365 640 3,781 267,594 1.26 1.41 10,270,693
2012 3,486 697 3,944 269,207 1.29 1.47 10,659,380
2013 3,554 695 3,981 275,017 1.29 1.45 10,597,356
2014 3,429 656 3,908 279,132 1.23 1.40 10,905,956
2015 3,622 665 4,094 279,844 1.29 1.46 11,203,184
2016† 4,177 815 4,678 287,895 1.45 1.62 11,498,561
2017† 4,367 878 4,906 297,593 1.47 1.65 12,229,216
2018† 4,461 890 5,006 304,864 1.46 1.64 13,233,910
2019† 4,479 892 5,005 300,050 1.49 1.67 13,085,643
†Beginning with data for 2016, the National Highway Traffic Safety Administration (NHTSA) implemented
changes to revise vehicle classification based on gross vehicle weight rating (GVWR), which reclassified
329 light pickup trucks as large trucks. Due to this methodology change, comparisons of the 2016 (and
later) Fatality Analysis Reporting System (FARS) large truck data with prior years should be performed
with caution.
Notes: A large truck is defined here as a truck with a GVWR greater than 10,000 pounds. The Federal
Highway Administration (FHWA) implemented an enhanced methodology for estimating registered
vehicles and vehicle miles traveled (VMT) by vehicle type beginning with data from 2007. As a result,
involvement rates may differ, and in some cases significantly, from earlier years.
4-6 Large Truck Injury Crashes, 2016-2019
Rates per
100 Million VMT
Injury Large Persons Injury Persons
Crashes Trucks Injured Million Crashes Injured
Involving Involved in Large VMT by Involving in Large Large
Large in Injury Truck Large Large Truck Trucks
Year Trucks Crashes Crashes Trucks Trucks Crashes Registered
2016 97,000 102,000 134,000 287,895 33.7 46.7 11,498,561
2017 102,000 107,000 148,000 297,593 34.4 49.7 12,229,216
2018 107,000 112,000 151,000 304,864 35.0 49.4 13,233,910
2019 114,000 119,000 158,000 300,050 38.0 52.8 13,085,643
Notes: “Persons Injured” includes all nonfatally injured persons in injury and fatal crashes. A large truck
is defined here as a truck with a gross vehicle weight rating (GVWR) greater than 10,000 pounds.
The rates displayed in this table are based on unrounded CRSS data. CRSS takes samples of motor
vehicle crashes—the results generated are estimates rounded to the nearest one thousand; however,
associated percentages and rates are based on the unrounded data.
Data Sources: Vehicle Miles Traveled and Registered Vehicles: FHWA, Highway Statistics 2019. Injury
Crashes, Vehicles Involved, and Persons Injured: NHTSA and CRSS.
36 2021 Pocket Guide to Large Truck and Bus StatisticsYou can also read