Improved Metabolite Prediction Using Microbiome Data-Based Elastic Net Models
←
→
Page content transcription
If your browser does not render page correctly, please read the page content below
ORIGINAL RESEARCH
                                                                                                                                                    published: 25 October 2021
                                                                                                                                               doi: 10.3389/fcimb.2021.734416

                                             Improved Metabolite Prediction
                                             Using Microbiome Data-Based
                                             Elastic Net Models
                                             Jialiu Xie 1, Hunyong Cho 1, Bridget M. Lin 1, Malvika Pillai 2, Lara H. Heimisdottir 3,
                                             Dipankar Bandyopadhyay 4, Fei Zou 1,5, Jeffrey Roach 6, Kimon Divaris 3,7 and Di Wu 1,8*
                                             1 Department of Biostatistics, Gillings School of Global Public Health, University of North Carolina at Chapel Hill, Chapel Hill, NC,
                                             United States, 2 Carolina Health Informatics Program, University of North Carolina at Chapel Hill, Chapel Hill, NC, United States,
                                             3 Division of Pediatric and Public Health, Adams School of Dentistry, University of North Carolina at Chapel Hill, Chapel Hill, NC,

                                             United States, 4 Department of Biostatistics, School of Medicine, Virginia Commonwealth University, Richmond, VA, United States,
                                             5 Department of Genetics, University of North Carolina at Chapel Hill, Chapel Hill, NC, United States, 6 Research Computing,

                                             University of North Carolina, Chapel Hill, NC, United States, 7 Department of Epidemiology, Gillings School of Global Public Health,
                                             University of North Carolina at Chapel Hill, Chapel Hill, NC, United States, 8 Division of Oral and Craniofacial Health Research,
                                             Adams School of Dentistry, University of North Carolina at Chapel Hill, Chapel Hill, NC, United States

                                             Microbiome data are becoming increasingly available in large health cohorts, yet
                                             metabolomics data are still scant. While many studies generate microbiome data, they
                                             lack matched metabolomics data or have considerable missing proportions of
                                             metabolites. Since metabolomics is key to understanding microbial and general
                           Edited by:        biological activities, the possibility of imputing individual metabolites or inferring
                             Thuy Do,
                                             metabolomics pathways from microbial taxonomy or metagenomics is intriguing.
 University of Leeds, United Kingdom
                                             Importantly, current metabolomics profiling methods such as the HMP Unified
                         Reviewed by:
          Luiz Felipe Valter De Oliveira,    Metabolic Analysis Network (HUMAnN) have unknown accuracy and are limited in their
                      BiomeHub, Brazil       ability to predict individual metabolites. To address this gap, we developed a novel
                              Jun Chen,
            Mayo Clinic, United States       metabolite prediction method, and we present its application and evaluation in an oral
                   *Correspondence:          microbiome study. The new method for predicting metabolites using microbiome data
                              Di Wu          (ENVIM) is based on the elastic net model (ENM). ENVIM introduces an extra step to ENM
                        dwu@unc.edu
                                             to consider variable importance (VI) scores, and thus, achieves better prediction power.
                  Specialty section:
                                             We investigate the metabolite prediction performance of ENVIM using metagenomic and
        This article was submitted to        metatranscriptomic data in a supragingival biofilm multi-omics dataset of 289 children
   Microbiome in Health and Disease,
                                             ages 3–5 who were participants of a community-based study of early childhood oral
              a section of the journal
             Frontiers in Cellular and       health (ZOE 2.0) in North Carolina, United States. We further validate ENVIM in two
               Infection Microbiology        additional publicly available multi-omics datasets generated from studies of gut health. We
            Received: 01 July 2021           select gene family sets based on variable importance scores and modify the existing ENM
      Accepted: 22 September 2021
        Published: 25 October 2021
                                             strategy used in the MelonnPan prediction software to accommodate the unique features
                                 Citation:
                                             of microbiome and metabolome data. We evaluate metagenomic and metatranscriptomic
        Xie J, Cho H, Lin BM, Pillai M,      predictors and compare the prediction performance of ENVIM to the standard ENM
  Heimisdottir LH, Bandyopadhyay D,
                                             employed in MelonnPan. The newly developed ENVIM method showed superior
 Zou F, Roach J, Divaris K and Wu D
            (2021) Improved Metabolite       metabolite predictive accuracy than MelonnPan when trained with metatranscriptomics
          Prediction Using Microbiome        data only, metagenomics data only, or both. Better metabolite prediction is achieved in the
       Data-Based Elastic Net Models.
Front. Cell. Infect. Microbiol. 11:734416.
                                             gut microbiome compared with the oral microbiome setting. We report the best-
       doi: 10.3389/fcimb.2021.734416        predictable compounds in all these three datasets from two different body sites.

Frontiers in Cellular and Infection Microbiology | www.frontiersin.org                 1                                          October 2021 | Volume 11 | Article 734416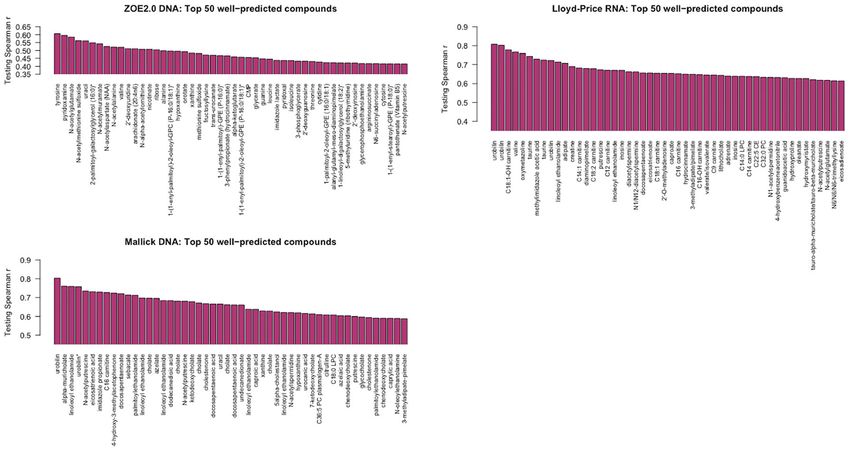
Xie et al.                                                                                                     ENVIM Predicts Metabolites Using Microbiome

                                            For example, the metabolites trehalose, maltose, stachyose, and ribose are all well
                                            predicted by the supragingival microbiome.
                                            Keywords: microbiome, metatranscriptome, metabolome, prediction, elastic net, random forest, metagenomics

INTRODUCTION                                                                      This new method was motivated by and applied in the context
                                                                                  of paired microbiome and metabolome data in the context of an
The importance of the human microbiome in health and disease                      IBD cohort. The motivation for the present new method
is undeniable; site-specific microbial communities interact both                   development is to improve existing analytical approaches
with the environment and the host and influence numerous                           available for metabolite prediction and functions using
biological processes (Wilkinson et al., 2021). Aside from the                     microbiome data (Sanna et al., 2019). To this end, we leverage
logical interest in understanding the composition of the                          existing microbiome and metabolome data from a study of early
microbiome (Tsilimigras and Fodor, 2016) (i.e., relative                          childhood oral health (ECC study) and two IBD studies of the
abundance of identified taxa), measuring and understanding its                     human gut microbiome. The elastic net model (ENM, used in
associated metabolic activities are arguably of utmost biological                 MelonnPan), compared to LASSO or ridge regression, benefits
relevance. Recent studies have linked the metabolome with                         from keeping both the singularities at the vertices, which is
several important health conditions including inflammatory                         necessary to accommodate data sparsity, and the strict convex
bowel disease (IBD) (Lloyd-Price et al., 2019), obesity and type                  edges for grouping among correlated variables.
II diabetes (Canfora et al., 2019), cholesterol levels (Kenny et al.,                Inspired by MelonnPan and MIMOSA, we propose an
2020), and early childhood dental caries (ECC) (Heimisdottir                      improved prediction method for individual metabolites using
et al., 2021). Despite the rapidly increasing availability of                     microbiome information in the same (i.e., matched or paired)
microbiome data in large health cohorts, metabolomics data                        biological samples, called “elastic net variable importance model
are still scant. This is an important limitation because the lack of,             (ENVIM)”. ENVIM improves upon ENM algorithms by
or considerable missingness of, metabolite information in                         weighting microbial gene family features using random forest
microbiome studies can diminish their potential in inferring                      variable importance (VI) to enhance the contribution of most
functions and important biological targets.                                       prediction-informative genes. ENVIM outputs predicted
    It follows that methods that help fill in the functional                       metabolites from matched microbiome samples, as well as gene
information gaps in microbiome studies are valuable and                           families and their weights informing metabolite prediction.
necessary. Because “matched” microbiome and metabolome                               In this paper, we present the development, application, and
datasets are extremely scant, most current methods rely on                        evaluation of ENVIM. We compare it against MelonnPan in three
metabolic pathway inferences from taxonomic and                                   datasets generated from oral and gut samples, so that we can also
metagenomic data, such as in the HMP Unified Metabolic                             compare metabolite predictive performance between different
Analysis Network (HUMAnN) (Franzosa et al., 2018). While                          body sites. The predictors can be three different gene family
the value of this approach is well-documented for the analysis of                 data types: metagenome only, metatranscriptome only, and the
some microbial consortia (e.g., the human gut) (Lloyd-Price                       combination of both metagenome and metatranscriptome data.
et al., 2019; Thomas et al., 2019), HUMAnN cannot make                            The top predictable compounds have been reported in these three
predictions for individual metabolites. Moreover, its accuracy                    datasets from two different body sites. To quantify the taxonomic
has not been benchmarked and its performance in other                             and functional relationship of the most prediction-contributing
microbial communities with distinct ecology and function (e.g.,                   microbial gene families in ENVIM, an enrichment analysis is
the oral cavity) remains unknown. This is important because                       performed and several predictive gene families are detected in
metabolomes measured at different body sites may include,                         species of the oral biofilm.
besides the products of microbial metabolism, biochemical
contributions from the host and the environment [e.g., dietary
sugars in the study of dental biofilm (Heimisdottir et al., 2021)].                MATERIAL AND METHODS
Although an accurate determination of metabolite sources may
not always be possible, predictions of these biofilm metabolites                   Cohorts and Data Description
using microbiome information are highly desirable.                                In the following section, we describe the microbiome and
    Along these lines, in 2016, Noecker and colleagues (Noecker                   metabolome data used for the new method development and
et al., 2016) added to the available analytical toolbox by                        application, alongside the three contributing studies.
leveraging 16S rRNA data. Their method enabled model-based
integration of metabolite observations and species abundances                     ZOE 2.0 Study Data
using taxonomy and paired metabolomics data from ~70 vaginal                      ZOE 2.0 is a community-based molecular epidemiologic study of
samples. More recently, MelonnPan (Mallick et al., 2019) was                      early childhood oral health in North Carolina (Divaris et al., 2020;
developed to obtain metabolomic profiling of microbial                             Divaris and Joshi, 2020). The study collected clinical information on
communities using amplicon or metagenomic sequences.                              preschool-age children’s (ages 3–5) dental cavities (referred to as

Frontiers in Cellular and Infection Microbiology | www.frontiersin.org        2                                 October 2021 | Volume 11 | Article 734416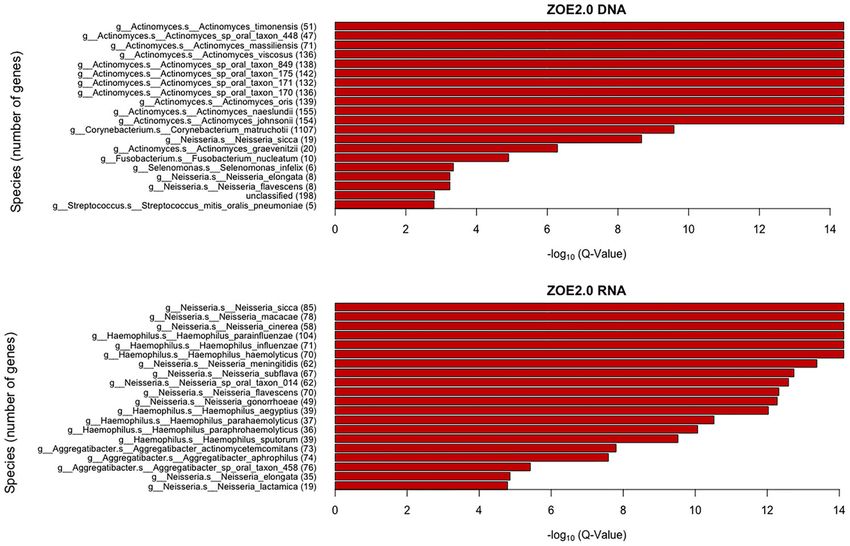
Xie et al.                                                                                                ENVIM Predicts Metabolites Using Microbiome

early childhood caries or ECC) (Ginnis et al., 2019) and                     IBD cohort (NLIBD, with 65 subjects). Therefore, they comprise
supragingival biofilm samples from a sample of over 6,000                     two independent cohorts of subjects. The raw data were obtained
children (Divaris et al., 2019). A subset of participants’ biofilm            through a combination of shotgun metagenomic sequencing and
samples underwent metagenomics, metatranscriptomics, and                     the same four LC-MS methods (Franzosa et al., 2019) as in the
metabolomics analyses, under the umbrella Trans-Omics for                    Lloyd-Price study. Gene family data in RPK units were derived
Precision Dentistry and Early Childhood Caries or TOPDECC                    using HUMAnN 2.0 and normalized to reads per kilobase per
(accession: phs002232.v1.p1) (Divaris et al., 2020). As such,                million sample reads (RPKM). The raw metagenomics gene family
metagenomics (i.e., shotgun whole-genome sequencing or WGS),                 dataset includes one million gene families. The investigators
metatranscriptomics (i.e., RNA-seq), and global metabolomics data            (Mallick et al., 2019) filtered out genes with low abundance and
(i.e., ultra-performance liquid chromatography-tandem mass                   prevalence resulting in a processed dataset of 811 gene families
spectrometry) (Evans et al., 2009; Evans et al., 2014; Heimisdottir          available in the R package MelonnPan (melonnpan.training.data
et al., 2021) from supragingival biofilm samples of ~300 children,            and melonnpan.test.data) for 222 total subjects. The microbiome
paired with clinical information on ECC, are available. After                data have been preprocessed and normalized into relative
exclusions due to phenotype and metabolite missingness                       abundance. The metabolite abundance data (8,848 metabolites
described in a previous publication (Heimisdottir et al., 2021), the         and 220 subjects) have been made available by Franzosa et al.
joint microbiome–metabolome data include 289 participants. There             (2019). Those authors used 466 metabolites for analyses, a subset
are 503 known metabolites included in the ZOE 2.0 dataset.                   that was confirmed experimentally against laboratory standards
Metagenomics and metatranscriptomics data in reads per kilobase              prior to application in MelonnPan. In the present study, we use
(RPK) were generated using HUMAnN 2.0. Here, we use species-                 information from these 466 metabolites to compare the power of
level (205 species), gene family (403k gene families), pathway (397          the new ENVIM method against MelonnPan. To accomplish this,
pathways), and metabolome (503 metabolites) data.                            we normalized the metabolite abundance data for all 8,848
                                                                             metabolites into relative abundance (compositional format,
Lloyd-Price Study Data                                                       obtained via dividing the normalized abundance by the sample-
The Lloyd-Price dataset (Lloyd-Price et al., 2019) was obtained              level total normalized abundance). Among them, we used the same
from the IBD multi-omics database (https://ibdmdb.org). It is                466 metabolites with laboratory standards as selected in the paper of
derived from a longitudinal study that sought to generate profiles            MelonnPan (Mallick et al., 2019). Data missingness is not an issue in
of multiple types of omics data among 132 participants for 1 year            the Mallick metabolome data.
and up to 24 time points. Several different types of omics data of
the study include WGS shotgun metagenomics, RNA-seq                          Metabolomics Data Preprocessing
metatranscriptomics, and metabolomics. The corresponding                     and Normalization
metadata include demographic information such as                             An overview of the approach for metabolome data is presented in
occupation, education level, and age. These gut microbiome                   Figure 1 and elaborated in detail below.
data are in counts per million (CPM) and were derived using
functional profiles 3.0 in HUMAnN 3.0. For this study, we                     Metabolomics Missing Data Imputation: ZOE 2.0 and
merged data of individual gene families for 1,638 samples for                Lloyd-Price Studies
130 subjects and individual metatranscriptomics gene families                In ZOE 2.0, 87% of metabolites have some missing data, whereas
for 817 samples for 109 subjects, respectively. The merged                   58% have missing values in Lloyd-Price. To address missingness
metagenomics gene family data include about 2,741k gene                      in these two cohorts, we applied a rigorous feature-wise quantile
families and 1,580 samples. Merged metatranscriptomics gene                  regression imputation of left-censored data (QRILC) (Wei et al.,
family data include about 1,079k gene families and 795 samples.              2018) to impute missing metabolite values and avoid
The metabolomics data were generated using four liquid                       underestimated metabolite-level variance, as in a previous
chromatography tandem mass spectrometry (LC-MS) methods                      publication (Heimisdottir et al., 2021). Each of the 289
including polar compounds in the positive and negative ion                   included participants has 90% missing values.
“HMDB” ID, there remained 526 metabolites to be predicted.                   Consequently, we proceeded to analyze 522 metabolites in 531
                                                                             samples from the Lloyd-Price data.
Mallick Study Data                                                               The QRILC imputation method was applied after a natural
The Mallick data comprised the main real-life dataset used in the            log data transformation, and the imputed data were
development of the MelonnPan method (Mallick et al., 2019). These            exponentiated to back transform the data to RPK (in ZOE 2.0)
gut microbial data (WGS shotgun sequencing and metabolomics)                 or CPM (in Lloyd-Price) scales. Because MelonnPan requires
were collected from two cross-sectional IBD cohort studies, namely,          metabolite data to be inputted as compositional, we converted
the Prospective Registry cohort for IBD Studies at the Massachusetts         RPK and CPM imputed data to a compositional format before
General Hospital (PRISM, with 155 subjects) and the Netherlands              predictive modeling.

Frontiers in Cellular and Infection Microbiology | www.frontiersin.org   3                                 October 2021 | Volume 11 | Article 734416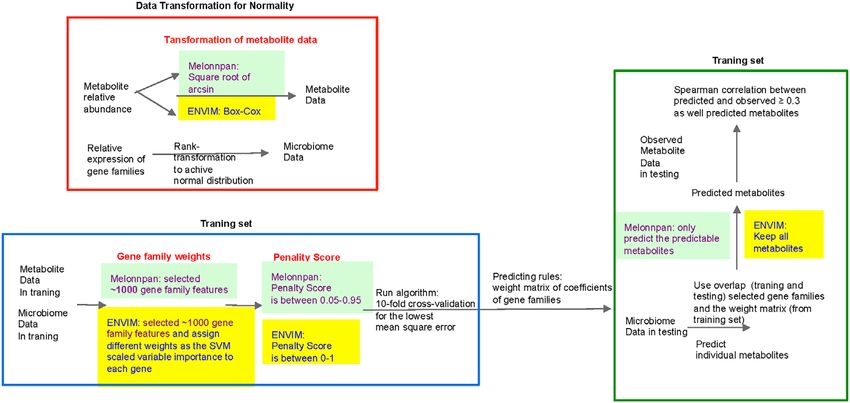
Xie et al.                                                                                                                           ENVIM Predicts Metabolites Using Microbiome

  FIGURE 1 | Flowchart of data preprocessing in microbiome and metabolome. QRILC was not used for the Mallick data, but was used for the ZOE 2.0 and Llloyd-
  Price data. Metabolites that have percentage of NA > 90% will also be removed before handling missing data.

Metabolites Filtered by Metabolic Pathways                                                          Mallick data. Metabolites in Mallick data only have been filtered
(ZOE 2.0, Lloyd-Price, and Mallick)                                                                 by the abundance, without being filtered by metabolic pathways.
We used the MetaCyc database to retain only “reactive”                                              To compare the prediction of metabolites in pathways with the
metabolites (Caspi et al., 2014). To achieve this, we considered                                    prediction of all metabolites, we considered both sets of
the membership of the metabolites in any MetaCyc metabolic                                          metabolites in our analyses.
pathway, reflecting reactions between bacteria and metabolites,
and carried out the following steps:
                                                                                               Microbiome Data Preprocessing
1. In the MetaCyc database, we identify metabolites in each of                                 and Normalization
   the pathways predicted by both metagenomics and                                             An overview of the approach for microbiome data is presented in
   metatranscriptomics data in Functional Profile 2.0                                           Figure 1 and elaborated in detail below. First, we matched gene
   generated by HUMAnN 2.0 (ZOE 2.0) and Functional                                            family-level microbiome data with metabolome data by participant
   Profile 3.0 generated by HUMAnN 3.0 (Lloyd-Price data).                                      or sample unique identifier. Then, the scaled (RPK, RPKM, or
   Of note, no pathway information exists in the available                                     CPM) gene family abundances were converted to compositional
   Mallick metagenomics and metatranscriptomics data.                                          data, relative to the total scaled gene family abundances within a
2. We used metabolite labels (KEGG ID, HMDB, PubChem,                                          sample. Then, we filtered out gene family features with low relative
   and metabolite name, provided in Metabolome data                                            abundance (mean relative abundance 90% of the samples) and thus kept 0.5%–
   three datasets, as the mapping IDs for each metabolite.                                     5% of gene family features. The same procedures were performed
3. In MetaCyc, regardless of the metabolite label, only one unique                             for both metatranscriptomics (briefly referred to as “RNA”
   MetaCyc “weblink” or universal mapping id is returned if the                                thereafter) and metagenomics data (briefly referred to as “DNA”
   metabolite is in the database. This way, reactive metabolites                               hereafter). When both DNA and RNA data (briefly as “Both”
   identified in step 1 can be matched with metabolites identified in                            hereafter) are considered predictors, a gene name may correspond
   step 2. 3) Therefore, we identify metabolites that are in the                               to two “gene features,” one for each data type. The same data
   observed pathways. Finally, we filter out metabolites with low                               preprocessing and normalization procedures were followed for the
   abundance (metabolites with mean relative abundance 90% of the samples). Consequently, there were 149 metabolites                              we divided samples into training (75% of subjects) and testing
   in pathways in ZOE 2.0, 125 in Lloyd-Price, and 251 in the                                  datasets (25% of subjects).

TABLE 1 | Sample size and number of selected gene family features.

                                                  Training genes         Testing genes          Genes in both         Subjects        Metabolites        Metabolites (in pathways)

ZOE 2.0          DNA (total 403k genes)                 1,355                  1,276                 1,214               289               503                        149
                 RNA (total 403k genes)                 1,805                  1,826                 1,667               287               503                        149
                 Both (total 806k genes)                3,158                  3,183                 2,948               287               503                        149
Lloyd-Price      DNA (total 2,741k genes)                726                    712                   633                359               522                        125
                 RNA (total 1,079k genes)                726                    704                   600                282               522                        125
                 Both (total 3,820k genes)              1,424                  1,508                 1,211               269               522                        125
Mallick          DNA (total 1,000k genes)                811                    811                   811                220               466                   251 (filter only)

Testing genes: genes that can be used in the testing set. Training genes: genes that can be used in the training set. Genes in both: genes that are in both training and testing sets.

Frontiers in Cellular and Infection Microbiology | www.frontiersin.org                     4                                           October 2021 | Volume 11 | Article 734416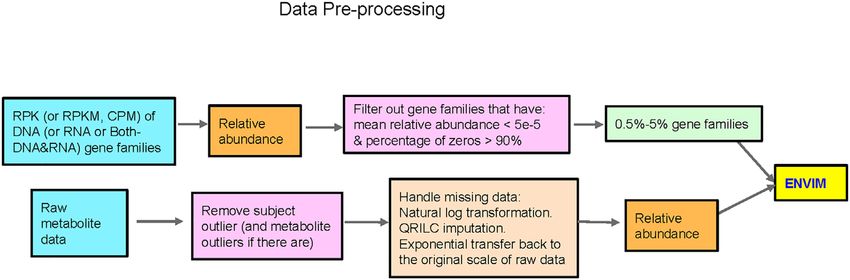
Xie et al.                                                                                                             ENVIM Predicts Metabolites Using Microbiome

The Existing ENM Method for Microbiome                                                   Spearman correlation ≥0.3, and those with correlation
Xie et al.                                                                                                            ENVIM Predicts Metabolites Using Microbiome

    Including all gene families into the model could make the                           matrix that includes the intercept term; and K is a set of the
cross-validated MSE larger, whereas including only a small part                         candidate k values. K is defined adaptively so that it covers the
could make the error larger. Therefore, to identify a model with                        range of the variable importance scores reasonably. In our analysis,
minimum cross-validated error, one needs to iterate different                           we set K = {0, 10, 20, …, 90}.
numbers of gene families. Because we prioritize gene families
with high importance relative to metabolites, we use a non-linear                       Three Key Differences Between MelonnPan and ENVIM
regression model to determine the importance of gene families                           for Predicting Individual Metabolites
for each metabolite. We train a cross-validated random forest
model (Breiman, 2001) by using the training data and use the                            1. Transformation of metabolite abundance data into a normal
varImp function in the caret package (Kuhn, 2008) in R to find                              distribution
the scaled importance score (0–100) between each independent                                MelonnPan transforms relative metabolite abundances with
feature and the metabolite abundance. We introduce a unique                             the arcsine square root operator, whereas we use a Box–Cox
step that uses the scaled variable importance scores to define sets                      transformation in ENVIM. To test the normality of the
of the top gene families according to a predefined set of                                transformed data, we compare the p-values of the Shapiro–
thresholds, for example, 90, 80, 70, etc. We use the glmnet                             Wilk test statistics for both the Box–Cox (Equation 3) and the
(Friedman et al., 2010) package in R to run cross-validated                             arcsine square root transformations of metabolite relative
ENM and choose penalty parameters for each model.                                       abundances. The Shapiro–Wilk test is typically used for
    In the training stage, we assign the importance score from 0 to                     examining distribution normality for a continuous variable.
100 in 10 cumulative intervals (90–100, 80–100,…, 10–100, 0–                            The smaller the p-values, equivalently, the larger the −log10(p-
100) and remove the intervals without gene families. In the                             values) are, the more evidence the data are not normally
ENM, we consider gene families as the independent variables and                         distributed. Overall, the −log10(p-values) from the Box–Cox
metabolite abundances as the dependent variables. We consider                           transformation in ENVIM are smaller than those from the
different sets of gene families with different importance scores.                       arcsine square root transformation (Figure 3A), which
For each set of gene families, we conduct a 10-fold cross-                              indicates that the Box–Cox-transformed data are more
validated ENM and build 10 models with different values of                              normally distributed. In addition, the Box–Cox transformation
the tuning parameter g, ranging from 0 to 1. For each model, we                         yields better normal approximation than the arcsine square root
measure the MSE between the measured metabolite abundance                               transformation for most of the metabolites (Figure 3B).
and the predicted values to determine the best model (i.e., the                             Box–Cox transformation
model with the lowest MSE). To maintain reproducibility, we
maintain the same random seed and permute the same fold                                                              ( yw −1
                                                                                                                 0       w     ,w ≠ 0          Equation 3
index number in the ENM. The matrix of regression coefficients                                                  y =                      ,
of gene families from the best model identified in the training set                                                     log (y), w = 0
will be output as a weight matrix.
    In the testing stage, for the prediction of each metabolite, we                     where y is the relative abundance, and y′ is the transformed abundance.
use the weight matrix output from the training stage for
prediction, if the gene families are also detected in the testing                       2. Different sets of gene families are carried forward to the
set. Because we have transformed the compositional metabolite                              prediction model
abundance to a normal distribution using a Box–Cox                                          MelonnPan uses all gene families in the training data in the
transformation in the training stage, we transform the                                  ENM and ultimately predicts metabolites in the testing stage
predicted metabolite abundance data back to the original                                using the same features. However, regressing against all gene
compositional scale based on g calculated in the training step.                         families may dilute the effect of important gene families. Thus,
    ENVIM assumes the following model:                                                  unlike MelonnPan, we use a variable importance criterion to
                                        0                                               select different sets of gene families and include them in the
                                 yi = xi b + ei ,                                       prediction models.

where b = (b0, b1, … , bp)', and b^ ENVIM = arg minb minLENVIM (k),                     3. The range of a values in ENM
                                                     k∈K
the ENVIM estimator of b, is found by minimizing over k and b the
objective function,                                                                         Alpha (a) is the weight between the L1 and L2 penalty terms
                                                                                        in the ENM, and in combination with g values, the set of values

                  1 N                        p
                                                    1−a 2                             that minimizes the 10-fold cross-validated MSE (Equation 1) is
                                                       bj + a bj  : Equation
                                                                      Equation 22
                               0
  LENVIM (k) =      o
                 2N i=1
                        (yi − xi Mk b)2 + l osk,j
                                            j=1      2                                  chosen. When a is 0, the model reduces to a Ridge regression
                                                                                        model which has the advantage of dealing with highly correlated
Here we define VIj as the variable importance score for the jth                          independent variables; when a is 1, the model becomes a Lasso
                                                 p               p
variable given by a random forest; Sk = fSk,j gj = IfVIj ≥ kgj=1 is                     regression model which has a variable selection capacity; when a
the variable selection indicator vector, which is 1 if the importance                   is between 0 and 1, the model includes the advantages of both
score for the jth variable is larger than the threshold k; Mk =                         Ridge regression and Lasso regression. In MelonnPan, the range
          0
diagf(1, Sk )g is the corresponding diagonal variable selection                         of a values does not include 0 and 1, which excludes either the

Frontiers in Cellular and Infection Microbiology | www.frontiersin.org              6                                  October 2021 | Volume 11 | Article 734416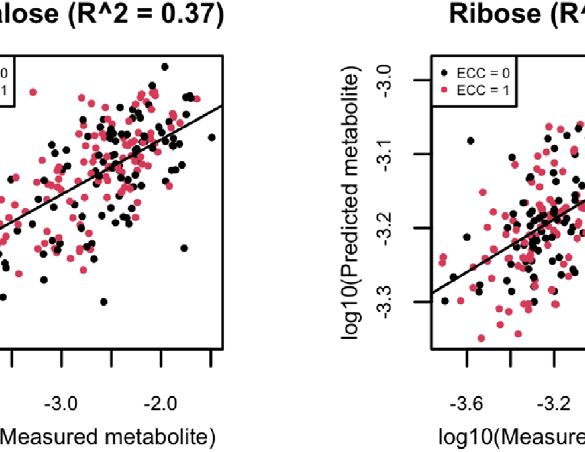
Xie et al.                                                                                                                  ENVIM Predicts Metabolites Using Microbiome

                               A                                                            B

  FIGURE 3 | (A) Boxplot of −log10 of Shapiro–Wilk test p-values to test the normality of transformed relative metabolite abundances in all three data applied with
  Box–Cox transformation (ENVIM used) and arcsine square root transformation (MelonnPan used). (B) Scatter plot for comparing −log10 of p-values from the
  Shapiro–Wilk test (normality) between Box–Cox transformation (x-axis) and arcsine sqrt (y-axis) transformation. Almost all of the points are above the y = x line, which
  indicates that the −log10 of p-value after Box–Cox transformation is smaller than after arcsine sqrt transformation and normality after Box–Cox transformation is
  better. Each point is one metabolite.

Ridge or Lasso regression models, and it may not consider                                and Lloyd-Price data) at each of the three data modalities of
variables with high importance. The range of a in our ENVIM                              microbial gene families, i.e., DNA-seq, RNA-seq, and Both (RNA
includes 0 and 1. By allowing a larger range of a, we can include                        and DNA). The MSE in the testing set is used for comparison
the Ridge regression model as the potential final model, which                            between the methods (Supplemental Figure 2).
does not unduly exclude variables with high importance.                                      We have summarized the prediction results (Table 2 and
    The ENVIM software written in R statistical language is                              Figure 4A) for all metabolites in terms of Spearman correlation
available in GitHub (https://github.com/jialiux22/ENVIM). The                            (r = 0.3) according to three aspects: method comparison, data
ENVIM_predict function is for metabolite prediction only, and                            modality comparison, and microbial community (i.e., body site)
the ENVIM function for both the metabolite prediction and the                            comparison. Overall, in method comparison, ENVIM produces
evaluation of the observed metabolomics dataset in the testing set                       higher percentages of well-predicted metabolites than
is also available. Both R functions will output the weight matrix                        MelonnPan in all three datasets, in both testing and training
between gene families and metabolites. The weight matrix in                              sets, and for DNA, RNA, and Both when available (Table 2).
testing has the same values as in training if they have the same                             Generally, in data modality comparison, RNA gene family
number of gene families. Some contributing gene families in the                          data produce higher percentages of well-predicted metabolites
weight matrix of the training set may not be measured in the                             than DNA data. In the Lloyd-Price study, RNA-only data
testing set, so the weight matrix used by the testing set includes                       typically give higher percentages of well-predicted metabolites.
only the gene families that are shared by both the training and                          In the ZOE 2.0 and Lloyd-Price data, both DNA and RNA
the testing sets.                                                                        predictors produce similar percentages but are not always
                                                                                         superior to the DNA-only or RNA-only data-based predictors.
                                                                                         However, results from both DNA and RNA predictors are never
Method Comparison for Prediction                                                         the worst. Unsurprisingly, the well-predicted percentage of
of Individual Metabolites in the                                                         metabolites in testing sets is lower than in the training set
Three Datasets                                                                           (Table 2). The boxplots of Spearman correlations between the
Correlation-Based Method Comparison                                                      predicted and observed metabolites for all metabolites
for All Metabolites                                                                      (Figure 4A) suggest that the correlations between the ENVIM-
We used microbial gene family data to predict individual                                 predicted and the observed metabolites are higher in RNA than
metabolites in the matched samples (that are from the same                               in DNA, but are comparable to correlations in both DNA and
biological sample in that one proportion is for microbiome and                           RNA. We are aware that in the testing sets, MelonnPan only
the other is for metabolome). We compared the prediction results                         outputs the predictable metabolites (defined as well-predicted
between ENVIM and MelonnPan, in terms of Spearman                                        metabolites in the training set, the last columns in Table 2), so it
correlation and MSE between predicted and observed values of                             is not as appropriate for MelonnPan, as compared with ENVIM,
each of the metabolites, in three datasets (ZOE 2.0, Mallick data,                       to calculate the Spearman correlation distribution for all

Frontiers in Cellular and Infection Microbiology | www.frontiersin.org               7                                        October 2021 | Volume 11 | Article 734416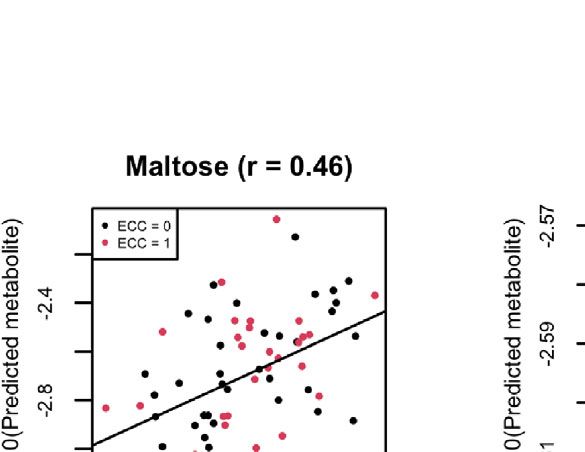
Xie et al.                                                                                                                            ENVIM Predicts Metabolites Using Microbiome

TABLE 2 | Prediction results (first four columns of numbers) in terms of Spearman correlation for all metabolites to be predicted.

                                       Training                       Training                         Testing                   Testing                  Predictable metabolites
                                       (ENVIM)                      (MelonnPan)                       (ENVIM)                  (MelonnPan)                (defined by MelonnPan)

ZOE 2.0 (NM = 503)
   DNA only                            356 (71%)                      63 (13%)                       124 (25%)                     47 (9%)                             70
   RNA only                            409 (81%)                      157 (31%)                      106 (21%)                    68 (14%)                             163
   Both DNA and RNA                    423 (84%)                      146 (29%)                      110 (22%)                    73 (15%)                             154
Mallick cohort (NM = 466)
   DNA only                            408 (88%)                      239 (51%)                      225 (48%)                   178 (38%)                             249
Lloyd-Price cohort (NM = 522)
   DNA only                           501 (96%)                       271 (52%)                      322 (62%)                   193 (37%)                             305
   RNA only                           521 (100%)                      298 (57%)                      393 (75%)                   236 (45%)                             318
   Both DNA and RNA                   518 (99%)                       306 (59%)                      381 (73%)                   232 (44%)                             323

Based on the “well-prediction” criterion, defined as Spearman correlation ≥0.3 between the observed and the predicted metabolites, the numbers of well-predicted metabolites with different
prediction methods, datasets, and modality levels (DNA, RNA, and Both) are presented for comparing MelonnPan and ENVIM. NM is the number of metabolites to be predicted.
Percentages in parentheses (%) represent the number of well-predicted metabolites divided by the total number of metabolites (NM) to be predicted in each study. The Mallick cohort has
only metagenomics data available. The last column presents numbers of “predictable metabolites,” defined by MelonnPan, also seen in the Figure 2 legend. Bold in the column of in testing
results represents the highest number of well-predicted metabolites among the three modalities (DNA, RNA, both DNA and RNA) in the ZOE2.0 cohort and the Lloyd-Price cohort.

metabolites in Figure 4A. It must also be noted that the highest                                   To investigate the sample size effects, we further cut the
proportion of well-predicted metabolites is found in the two gut                                sample size of the training set by half, or from 155 PRISM
microbiome studies (Lloyd-Price study and Mallick study), and                                   subjects to 77 or 78 subjects randomly for 10 times and find that
the lowest is in the supragingival dental biofilm (ZOE 2.0 study)                                with even half of the samples, ENVIM nearly maintains the well-
(Table 2). Since Spearman correlation in both the Lloyd-Price                                   predicted rates (Table 4). ENVIM is less sensitive to the
and Mallick datasets is higher than that in ZOE 2.0 (Figure 4A), it is                          decreased sample size than MelonnPan.
reasonable to suggest that metabolite prediction is better in gut
microbial communities than in the oral microbial communities.                                   Correlation-Based Method Comparison for
   Besides comparing MelonnPan and ENVIM in terms of                                            Metabolites Within Metabolic Pathways
percentages of well-predicted metabolites, one can directly                                     Metabolites may be associated with the microbiome in the
compare the Spearman correlations of each predictable                                           context of metabolic pathways that involve interactions
metabolite that is predicted by both methods (Figures 5, 6).                                    between the host, microbiome, and environment. We further
In the training set (Figure 5), for all three gene family data                                  investigate the predictive capability of the two methods for
modalities and in all three datasets, we find that the majority of                               metabolites in MetaCyc metabolic pathways. HUMAnN 2.0 or
these metabolites have higher correlations in ENVIM compared                                    3.0 software provides information whether a MetaCyc metabolic
with MelonnPan. The same holds in the testing set (Figure 6). We                                pathway has been associated with microbiome data. In the
also observe that most points are along but slightly above the                                  MetaCyc database, we identify metabolites in each of these
diagonal line in the testing sets (Figure 6). This suggests that the                            microbiome-associated pathways. All conclusions regarding
metabolites predicted by ENVIM have higher correlations with                                    method comparison, modality comparison, and body site
the observed ones compared with those predicted by MelonnPan.                                   comparison in the prediction of all metabolites still hold in the
We also find that there are more metabolites in the “ENVIM                                       context of predicting metabolic-pathway-only metabolites.
≥0.3” category (blue) than in the “MelonnPan ≥0.3” category                                     Additionally, when comparing the percentages of well-
(red). This is a reflection of more well-predicted metabolites                                   predicted metabolites among all metabolites (first four columns
found using ENVIM than using MelonnPan prediction.                                              of Table 2) and those in the metabolic pathways (Table 5), we
   To give a more realistic view of the improvement of the                                      find higher predicted percentages for the latter.
ENVIM over MelonnPan, as a tool to predict metabolites in
practice, we use one of the two independent cross-sectional                                     MSE-Based Method Comparison
cohorts in Mallick data as training to predict the other. The                                   We use boxplots to compare MSE between measured and
PRISM cohort has 155 subjects and the NLIBD cohort has 65                                       predicted metabolite abundances between ENVIM and
subjects. For both ENVIM and MelonnPan, we use the                                              MelonnPan both for training and testing models, with
microbiome and metabolome data in PRISM as the training set                                     application to training and testing data for all three studies.
to predict the metabolites in NLIBD (Table 3). Among the 466                                    We only compare well-predicted metabolites identified by
metabolites, ENVIM has 34% (160/466) in the testing set, while                                  MelonnPan in training, since MelonnPan only generates
MelonnPan only has 26% (123/466) in the testing set. These                                      results for these metabolites. The boxplot demonstrates that
percentages are very similar to 37% and 28%, respectively, in                                   the distribution of MSE in the MelonnPan model is
ENVIM and MelonnPan from random split of samples in the                                         approximately the same as the distribution of MSE in ENVIM
Mallick study, so that the same conclusion was drawn that better                                (Supplemental Figure 2). We find no significant difference in
prediction power is in ENVIM than in MelonnPan.                                                 MSE between ENVIM and MelonnPan, which suggests that both

Frontiers in Cellular and Infection Microbiology | www.frontiersin.org                      8                                           October 2021 | Volume 11 | Article 734416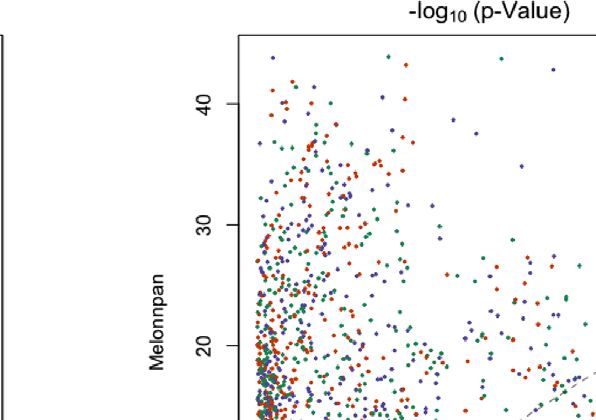
Xie et al. ENVIM Predicts Metabolites Using Microbiome
A
B
FIGURE 4 | (A) Evaluation using Spearman correlation r in training stage and testing stage between predicted values and the observed values by using DNA-seq
data only, RNA-seq data only, and both for ZOE 2.0 data, Lloyd-Price data, and Mallick data. (B) R-square in the training stage, as the percentage of variance
explained by prediction models to demonstrate the lack of overfitting.
methods predict these metabolites well in terms of MSE. The family data modalities that has the best ENVIM prediction power to
advantage of ENVIM is that we can predict substantially more show their top predicted metabolites, that is, the DNA gene family
well-predicted metabolites than MelonnPan—a consequence of data (124 metabolites as 25% among NM, Table 2) in ZOE 2.0 and
MelonnPan’s inability to build a well-performing model in the the RNA gene family data (393 metabolites as 75% among NM,
training step. When using PRISM as the training set and NLIBD Table 2) in Lloyd-Price. Since the Mallick study only has DNA data
as the testing set in the Mallick study, the above conclusion about available, the DNA gene family data are used. To note, both the
MSE remains the same (Supplemental Figure 3). Lloyd-Price study and the Mallick study have measured metabolites
in four metabolome LC-MS platforms (see the Cohorts and Data
ENVIM Outputs Including Predicted Description section) so that one metabolite may appear multiple
Individual Metabolites and Contributing times in the top list (for example, urobilin). The top 50 best
Gene Family Weights predicted metabolites for each study are presented in Figure 7.
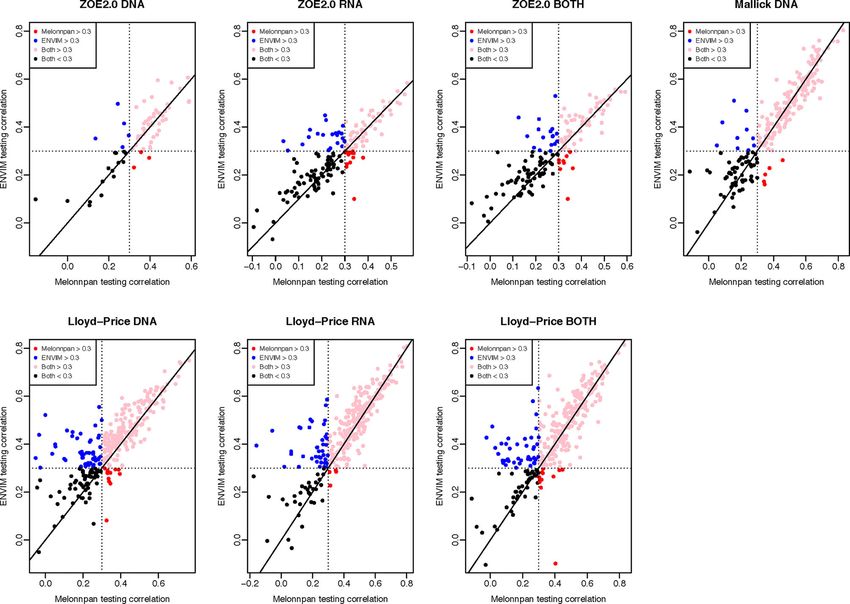
Top Well-Predicted Metabolite Compounds From The summarized prediction results are presented in
ENVIM Supplemental Table 1. To interpret the results, we take the
For simplicity, we present one modality from each of the three carbohydrate pathway as an example of a pathway that may
studies. For Lloyd-Price and ZOE 2.0, we choose one of the gene provide bacteria with nutrition, which includes a few compounds
Frontiers in Cellular and Infection Microbiology | www.frontiersin.org 9 October 2021 | Volume 11 | Article 734416
Xie et al. ENVIM Predicts Metabolites Using Microbiome
FIGURE 5 | For DNA, RNA, and both in each study and the training set, this shows the scatter plot of Spearman correlation in ENVIM (y-axis) and MelonnPan (x-
axis). Spearman correlation is based on observed metabolite abundance and predicted values. If our calculated correlation is NA, the metabolites will be not included
in this figure.
that have been well-predicted by the RNA gene family data. We are that there are not many overlapping genes (n < 10) between ZOE
aware that the prediction in this paper is not about longitudinal 2.0 data and Lloyd-Price data (data not shown).
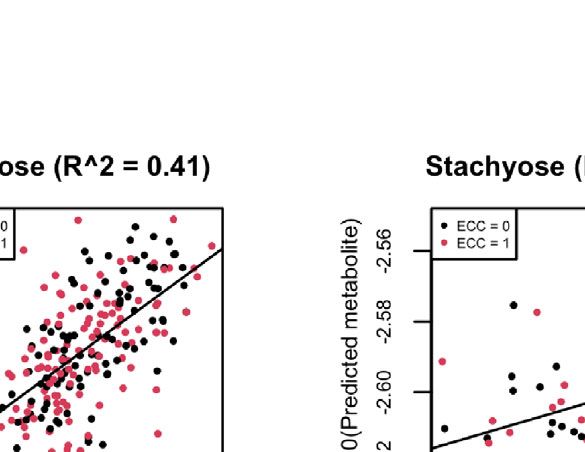
causal relation, but rather, for mathematical prediction. Here, we
also show four examples (trehalose, maltose, ribose, and stachyose) Gene Set Enrichment Analysis of Contributing Genes
that have high Spearman correlation on the log10 scale of the Within Species in ZOE 2.0
compositional data (Figure 8A). We perform gene set enrichment analysis to find the over-
represented species of the contributing gene families to predict
Comparison of Gene Family Lists (With Weight metabolites in ZOE 2.0. To test that, we start with the weight
Matrix) Across Three Datasets in ENVIM matrix of gene families and metabolites in the testing set. We
We extract gene family names that have non-zero entries in the identify the contributing gene families that have non-zero values
weight matrix for each metabolite, dataset, and gene family with any well-predicted metabolites.
modality (Supplemental Table 2) in ZOE 2.0. We compare We obtain the rank of each gene family in the weight matrix
the contributing gene family names across the ZOE 2.0 and based on the absolute value of the regression coefficients (“weights”)
Lloyd-Price to find the number of common contributing genes for each gene family. We use the information of correspondence
the different body sites share for predicting metabolites. We find between gene families and the species level (generated in HUMAnN
Frontiers in Cellular and Infection Microbiology | www.frontiersin.org 10 October 2021 | Volume 11 | Article 734416Xie et al. ENVIM Predicts Metabolites Using Microbiome FIGURE 6 | For DNA, RNA, and both in each study and the testing set, this shows the scatter plot of Spearman correlation in ENVIM (y-axis) and MelonnPan (x- axis). Spearman correlation is based on observed metabolite abundance and predicted values. Here, “Both ≥0.3” refers to the category of metabolites that have Spearman correlation ≥0.3 in both ENVIM- and MelonnPan-predicted results. “ENVIM ≥0.3” refers to the category of metabolites that have Spearman correlation ≥0.3 only between ENVIM-predicted and observed values. 2.0.) to identify the species corresponding to those contributing gene Here, we used a different procedure for the gene set enrichment families. For each species, we compare the difference in the tests compared to what was used in the MelonnPan (Mallick et al., cumulative distributions of gene family rank scores between the 2019) paper, in that the gene families in genera instead of species species and the background species using the Kolmogorov–Smirnov were summarized as a gene set, due to the small number of gene (KS) test that was also used in the original gene set enrichment families in each species in their prediction procedure. In fact, analysis (GSEA) paper (Subramanian et al., 2005). We use the ENVIM keeps many more genes than MelonnPan (because Benjamini–Hochberg false discovery rate (FDR) approach to ENVIM allows larger range of a) so that ENVIM can address the correct the KS p-values and get q-values. There are 36 species in ranks of all contributing gene families instead of the binary ZOE 2.0 DNA data and 73 species in ZOE 2.0 RNA data found to be prediction power of genes (i.e., whether a gene is used for significantly (q < 0.05) over-represented in the gene set enrichment prediction or not) used in MelonnPan and, furthermore, can analysis (Figure 9). perform GSEA at the species level for higher resolution of TABLE 3 | Prediction results in Mallick data, when using all samples in the PRISM study as the training set and the data in NLIBD study as the testing set. Mallick cohort (NM = 466) Training (ENVIM) Training (MelonnPan) Testing (ENVIM) Testing (MelonnPan) PRISM (training, n = 155) NLIBD (testing, n = 65) DNA only 387 (83%) 205 (44%) 160 (34%) 123 (26%) Frontiers in Cellular and Infection Microbiology | www.frontiersin.org 11 October 2021 | Volume 11 | Article 734416
Xie et al.                                                                                                                       ENVIM Predicts Metabolites Using Microbiome

TABLE 4 | Prediction results in Mallick data, when using half of the sample size in the PRISM study as the training set for 10 times and the data in NLIBD study as the
testing set.

Mallick cohort (NM = 466)                                 Training                             Training                            Testing                            Testing
PRISM (training, n = 77 or 78)                            (ENVIM)                            (MelonnPan)                          (ENVIM)                           (MelonnPan)
NLIBD (testing, n = 65)

Seed1                                                    429 (92%)                            161   (35%)                         147 (32%)                           96 (21%)
Seed2                                                    402 (86%)                            202   (43%)                         162 (35%)                           104 (22%)
Seed3                                                    427 (92%)                            164   (35%)                         140 (30%)                           92 (20%)
Seed4                                                    428 (92%)                            199   (43%)                         148 (32%)                           97 (21%)
Seed5                                                    439 (94%)                            211   (45%)                         160 (34%)                           111 (24%)
Seed6                                                    427 (92%)                            180   (39%)                         157 (34%)                           113 (24%)
Seed7                                                    424 (91%)                            178   (38%)                         143 (31%)                           98 (21%)
Seed8                                                    424 (91%)                            150   (32%)                         142 (30%)                           98 (21%)
Seed9                                                    425 (91%)                            159   (34%)                         150 (32%)                           101 (22%)
Seed10                                                   419 (90%)                            181   (39%)                         152 (33%)                           105 (23%)
Mean                                                     424 (91%)                            179   (38%)                         150 (32%)                           102 (22%)

contributing species. Our GSEA strategy also can help avoid the bias                         variable importance scores and modified the existing ENM to
of selecting for species that have larger numbers of genes.                                  accommodate the unique features of microbiome and
                                                                                             metabolome data. The newly developed method ENVIM predicts
Computational Speed                                                                          metabolites using metagenomics, metatranscriptomics, or both data
ENVIM was implemented in R statistical language. It can accurately                           types. We apply the algorithm in three datasets, i.e., the ZOE 2.0,
predict metabolites using matched microbiome gene family data.                               Mallick, and Lloyd-Price studies. These three studies have both
The mean running time in ENVIM of each metabolite using DNA                                  microbiome and metabolome data in the same matched samples,
gene family data is 5.2 min for ZOE 2.0 data (6.1 min for Lloyd-                             with reasonably large sample sizes. We are the first to use
Price data, 2 min for Mallick data). The mean running time in                                microbiome data to predict metabolites in more than one study
ENVIM using RNA gene family data is 4.2 min for ZOE 2.0 data                                 and different body sites. In addition, the ZOE 2.0 and Lloyd-Price
(3.7 min for Lloyd-Price data); the mean running time in ENVIM                               studies have both metagenomics and metatranscriptomics, so that
for both DNA and RNA gene family data is 4.5 min for ZOE 2.0                                 we can, for the first time, compare prediction performance using the
data (3.6 min for Lloyd-Price data) with MacOS Big Sur Version                               different gene family modalities (or called data types).
11.4 and the desktop iMac Pro 2020.                                                              We evaluated metagenomic and metatranscriptomic predictors
                                                                                             and compared the prediction performance between the previously
                                                                                             developed MelonnPan and ENVIM, among DNA, RNA, and both
DISCUSSION                                                                                   DNA and RNA gene family data using 1) the proportion of “well-
                                                                                             predicted” metabolites defined as those with Spearman correlation
We propose a new computational method for metabolite prediction                              between measured and predicted metabolite values ≥0.3, 2)
using microbiome data-based improved elastic net models. We                                  distribution of Spearman correlation, and 3) MSE. The correlation
chose different gene family sets based on random-forest-based                                suggests that Both (of DNA and RNA) provides robust prediction

TABLE 5 | Prediction results via Spearman correlation for metabolites that are found in metabolic pathways.

                                                  Training                               Training                                Testing                              Testing
                                                  (ENVIM)                              (MelonnPan)                              (ENVIM)                             (MelonnPan)

ZOE 2.0 (NM = 149)
   DNA only                                       129 (87%)                              35 (23%)                               57 (38%)                              28 (19%)
   RNA only                                       139 (93%)                              73 (49%)                               57 (38%)                              40 (27%)
   Both DNA and RNA                               142 (95%)                              73 (50%)                               60 (40%)                              46 (31%)
Mallick cohort (NM = 251)
   DNA only                                       231 (92%)                              132 (53%)                              94 (37%)                              71 (28%)
Lloyd-Price cohort (NM = 125)
   DNA only                                      121 (97%)                               71 (57%)                              70 (56%)                               40 (32%)
   RNA only                                      125 (100%)                              86 (69%)                              103 (82%)                              68 (54%)
   Both DNA and RNA                              124 (99%)                               92 (74%)                              105 (84%)                              79 (63%)

Based on the criterion of Spearman correlation ≥0.3 between observed and predicted metabolites, we present the numbers of well-predicted metabolites with different prediction
methods, datasets, and modality levels (DNA, RNA, and Both) and made a comparison between MelonnPan and ENVIM. NM is the number of metabolites to be predicted. Percentages in
parentheses (%) represent the numbers of well-predicted metabolites divided by the total number of metabolites (NM) to be predicted in each study. The Mallick cohort has only
metagenomics (DNA) data available and no pathway RNA data. The results from the Mallick cohort here are only based on filters (filtering out metabolites with mean relative abundance
10% non-zero). In ZOE 2.0 and Lloyd-Price, metabolite data presented in this table have been selected according to membership in
pathways and also satisfy the abovementioned filtering criteria.

Frontiers in Cellular and Infection Microbiology | www.frontiersin.org                  12                                         October 2021 | Volume 11 | Article 734416
Xie et al. ENVIM Predicts Metabolites Using Microbiome
FIGURE 7 | The best predicted 50 metabolite compounds (x-axis) in the three studies by ENVIM in the testing set. For Lloyd-Price and ZOE 2.0, we choose the
gene family data types that have the best ENVIM prediction power to show their top predicted metabolites, based on Table 2.
results that are never the worst among the three data types. Whether types of prediction methods is in studies that contain paired
DNA or RNA has better prediction performance depends on the microbiome and metabolome data in one batch of samples but
study. The percentage of well-predicted metabolites is higher for lack metabolome data in other batches of samples. In that case, all
metabolites that are in a metabolic pathway observed in the microbiome samples are sequenced, aligned, and processed
microbiome data. Such enrichment of well-predicted metabolites comparably, and the uncollected metabolome samples are also
in metabolic pathways supports the strong interaction between assumed to be from the same technical metabolome platform and
microbiome and metabolome. Across all datasets and data types, similar data processing steps (for example, as what we demonstrated
with or without the pathway filter, we find that ENVIM always in Tables 2, 5). However, the usage of these methods is not limited
outperforms MelonnPan. We also find that prediction performance only to this ideal case. The suitable usage scope has the assumptions
is better in Lloyd-Price and Mallick than in ZOE 2.0, which suggests of 1) the same population distribution of microbiome data in the
that the association between microbiome and metabolites is stronger training model and in the cohort to be predicted, 2) the same
in the gut than in the oral cavity, since oral metabolites may be more population distributions between the metabolome data in the
affected by environmental factors like food intake. More microbial training model and in the cohort to be predicted, and 3) similar
omics studies are needed to compare the prediction power across connection between microbiome and metabolome due to, for
different body sites and to understand how the microbiome interacts example, similar ethnicities, clinical characteristics, age groups,
with the metabolome differently at different body sites. and body sites (as shown in Table 3). Usage of the IBD Lloyd
Acknowledging that the reported findings are not to infer data to predict metabolites in the IBD Mallick study via ENVIM
causality but are demonstrative of mathematical prediction, we and MelonnPan has been considered. Although these two studies
show four well-predicted metabolites in ZOE 2.0 (Figure 8), as have been generated from the same body sites and similar LC-MS
examples of compounds that may play roles in bacterial metabolism. metabolome techniques, their microbiome data have been
As a result, the numbers of the measured metabolites and the processed in different versions of HUMAnN software (3.0 vs. 2.0),
numbers of the to-be predicted metabolites in each of the three and in different data scales (CPM vs. RPKM), their metabolome
studies are very different due to differences in technology platforms, data have been processed using different algorithms in different
data processing steps, and available data at different body sites. software, and different filtering criteria have been used in the two
Besides body sites, the data collection and processing steps may have studies. These differences suggest that the first and the second
large effects on the prediction performance. The distributional assumptions are not held well, and the prediction results are not
assumption, normalization, transformation, outlier filtering, and encouraging (data not shown). Furthermore, the assumptions of
missing data handling are important considerations before training similar population distributions depend on the measuring technical
the model. We have touched on that, but further exploration may be platforms, the data processing steps, and proper normalization
needed. According to what we observed, the ideal usage of these methods. The questions of what the best normalization method is
Frontiers in Cellular and Infection Microbiology | www.frontiersin.org 13 October 2021 | Volume 11 | Article 734416Xie et al. ENVIM Predicts Metabolites Using Microbiome
A B
FIGURE 8 | (A) Scatter plots of examples of four well-predicted metabolites in ZOE 2.0 by ENVIM, in the testing set. r is for Spearman correlation for method
evaluation. (B) Scatter plots of the same four well-predicted metabolites in ZOE 2.0 by ENVIM, in the training set, where R-square (Pearson Correlation) was shown
for the percentage of variance explained by prediction models to demonstrate that overfitting is not a big concern. The x-axis is the observed metabolites; the y-axis
is the predicted metabolites. Both x and y are in log10 scale of the compositional data for normality. ECC stands for early childhood caries, ECC = 0 (about 50% of
total samples in ZOE 2.0) is for the healthy group, and ECC = 1 (about 50% of total samples in ZOE 2.0) is for the ECC case group.
FIGURE 9 | Taxonomic enrichment of metabolite predictive species for the most contributing species to metabolite prediction, based on ZOE 2.0 DNA or RNA by
ENVIM. The top 20 significant over-represented bacteria with the smallest Q-values (Q < 0.05) for ZOE 2.0 data. The Q-value is based on the Kolmogorov–Smirnov
(KS) test p-values after FDR correction. Upper, DNA data; Lower, RNA data.
Frontiers in Cellular and Infection Microbiology | www.frontiersin.org 14 October 2021 | Volume 11 | Article 734416Xie et al. ENVIM Predicts Metabolites Using Microbiome
and which integration procedure best allows assumptions of similar ETHICS STATEMENT
population distributions to overcome the difference across cohorts/
technique/data processing are out of the scope of this paper but are Ethics approval was received by the Institutional Review Board of
very important for further data harmonization of microbiome- UNC-Chapel Hill (#14-1992) for the ZOE 2.0 study; all
related large datasets. participants’ guardians provided written informed consent for
Because higher well-predicted metabolite rates were observe in participation in the ZOE 2.0 study. For the Lloyd-Price and
the training compared to the testing datasets, overfitting of the Mallick cohorts, the data we have used are publically available on
machine learning model can be a concern; however, overfitting is line. Therefore, "ethical review and approval was not required for
not a great concern around ENVIM for the following reasons: 1) the study on human participants in accordance with the local
similar observed mean square error in the training set and the legislation and institutional requirements. Written informed
testing set (Supplemental Figures 2–4) and 2) small squared consent from the participants’ legal guardian/next of kin was
Spearman correlation (R-square) between fitted and observed not required to participate in this study in accordance with the
metabolites in the training sets (Figure 4B). Four well-predicted national legislation and the institutional requirements."
metabolites in ZOE 2.0 have no large R-square in the training set,
and similar patterns in the scatter plots between measured and
predicted metabolites are observed in both the training set and AUTHOR CONTRIBUTIONS
testing set (Figure 8B), and 3) the penalty terms in ENM, cross-
Conceptualization by DW and JX. Supervision by DW.
validation in tuning the penalty terms, and the use of
Investigation by JX and LH. Formal analysis by JX. Writing—
bootstrapping in random forest relax the potential overfitting
original draft preparation by JX, HC, BL, MP, KD, and DW.
problem. Although the overfitting concern is reasonably
Reviewed draft also by FZ. Discussion with DB and FZ. All authors
mitigated, it should be acknowledged that it may not be
contributed to the article and approved the submitted version.
perfectly avoided. With that in mind, the method performance
in the testing set is the most important. We observe that ENVIM
has a higher well-predicted metabolite percentage (Tables 2, 3, 5) FUNDING
and comparable MSE (Supplemental Figures 2, 3) when
compared with MelonnPan. We acknowledge NIH/NIDCR R03-DE02898, NIH/NIDCR
A limitation in the framework for ENVIM, as well as in the U01-DE025046, P30 CA016059 (Massey Cancer Center
framework for MelonnPan, is that the experimental design in Support Grant) for funding support, and NLM T15 training
studies, including time course or disease statuses, has yet to be grant #T15-LM012500 for funding support.
considered. However, since the purpose of ENVIM is prediction,
the prediction does not need to be conditional on the
experimental design. Instead, different disease statuses may ACKNOWLEDGMENTS
have different microbiome profiles and, correspondingly, have
We also acknowledge Prof. William Valdar for supporting JX.
different metabolome profiles. Therefore, the non-inclusion of a
design matrix in ENVIM is a limitation but not a drawback of the
prediction performance. SUPPLEMENTARY MATERIAL
In summary, we illustrate that the newly developed ENVIM
method for microbiome-based metabolite prediction provides The Supplementary Material for this article can be found online at:
good prediction performance and can be used to predict https://www.frontiersin.org/articles/10.3389/fcimb.2021.734416/
individual metabolites when only microbiome data are full#supplementary-material
available if the same technical microbiome/metabolome
platform, similar data processing steps, and the same body site Supplementary Figure 1 | Diagnosis for outlier samples in metabolome data.
The x-axis is the cumulative proportion of samples, and the y-axis is number of non-
and covariate values can be assumed, or when a proportion of missing values. The left lower tail dots that are far from the rest may be considered
samples in a study have no metabolome data. as sample outliers. For ZOE 2.0 data and Lloyd-Price data, we need to remove the
10 outliers subjects from ZOE 2.0 data and 15 outliers from Lloyd-Price data to
ensure the distribution of non-missing values is continuous.
Supplementary Figure 2 | Boxplot of -log10 of MSE for DNA, RNA, and BOTH in
DATA AVAILABILITY STATEMENT each of the three studies to compare ENVIM and MelonnPan.
The ZOE 2.0 microbiome data have been deposited in dbGaP
Supplementary Figure 3 | Boxplot of -log10 of MSE for DNA, RNA, and BOTH in
under the umbrella Trans-Omics for Precision Dentistry and Early Mallick study when PRISM data was used as training to predict metabolites in
Childhood Caries or TOPDECC (accession: phs002232.v1.p1). NLIBD data. This is to compare ENVIM and MelonnPan.
Metabolomics raw spectral data and associated clinical
traits have been deposited in the MetaboLights repository: Supplementary Figure 4 | Boxplot of -log10 of MSE for DNA, RNA, and BOTH in
each of the three studies, for all metabolites predicted by ENVIM.
https://www.ebi.ac.uk/metabolights/MTBLS2215. Descriptive and
clinical data for the parent ZOE 2.0 study have been deposited in Supplementary Table 1 | Overall prediction results, for all gene family data types,
https://doi.org/10.17615/8yjy-w790. all three datasets, and both methods, in Spearman correlation and MSE.
Frontiers in Cellular and Infection Microbiology | www.frontiersin.org 15 October 2021 | Volume 11 | Article 734416You can also read