PHYSICAL REVIEW ACCELERATORS AND BEAMS 24, 101302 (2021)
←
→
Page content transcription
If your browser does not render page correctly, please read the page content below
PHYSICAL REVIEW ACCELERATORS AND BEAMS 24, 101302 (2021)

                      Stable witness-beam formation in a beam-driven plasma cathode
                A. Knetsch ,1,* B. Sheeran,1,2 L. Boulton,1,3,4 P. Niknejadi,1 K. Põder,1 L. Schaper,1 M. Zeng,1
                S. Bohlen,1,2 G. Boyle,1 T. Brümmer,1 J. Chappell,5 R. D’Arcy,1 S. Diederichs,1,2 B. Foster,6
                     M. J. Garland,1 P. Gonzalez Caminal,1,2 B. Hidding,3,4 V. Libov,1 C. A. Lindstrøm,1
                A. Martinez de la Ossa,1 M. Meisel,1,2 T. Parikh,1 B. Schmidt,1 S. Schröder,1,2 G. Tauscher,1,2
                                   S. Wesch,1 P. Winkler,1,2 J. C. Wood,1 and J. Osterhoff1
                          1
                           Deutsches Elektronen-Synchrotron DESY, Notkestr. 85, 22607 Hamburg, Germany
                                             2
                                              University of Hamburg, Hamburg, Germany
                         3
                          SUPA, Department of Physics, University of Strathclyde, Glasgow, United Kingdom
                                         4
                                          The Cockcroft Institute, Daresbury, United Kingdom
                                        5
                                         University College London, London, United Kingdom
                   6
                     John Adams Institute for Accelerator Science at University of Oxford, Oxford, United Kingdom

                              (Received 1 July 2021; accepted 20 September 2021; published 7 October 2021)

                   Electron beams to be accelerated in beam-driven plasma wakes are commonly formed by a photocathode
                and externally injected into the wakefield of a preceding bunch. Alternatively, using the plasma itself as a
                cathode offers the possibility of generating ultrashort, low-emittance beams by trapping and accelerating
                electrons from the ambient plasma background. Here, we present a beam-driven plasma cathode realized
                via laser-triggered density-downramp injection, showing stable beam formation over more than a thousand
                consecutive events with an injection probability of 95%. The plasma cathode is highly tunable, resulting in
                the injection of electron bunches of tens of pC of charge, energies of up to 79 MeV, and relative energy
                spreads as low as a few percent. The stability of the injected beams was sufficiently high to experimentally
                determine their normalized emittance of 9.3 μm rms with a multishot method.

                DOI: 10.1103/PhysRevAccelBeams.24.101302

                     I. INTRODUCTION                                    plasma electrons. Research on external injection methods
                                                                        has predominantly concentrated on maximizing energy
   Plasma wakes excited by charged particle beams [1–3]
                                                                        transfer from the drive to the witness beam while preserving
are capable of generating GV/m accelerating gradients
                                                                        other beam parameters, such as energy spread [11,12].
[4,5]—orders of magnitude higher than those produced by
                                                                        Internal injection methods have the potential to provide
conventional radio-frequency-based technologies, thereby
                                                                        witness beams with charges of tens to hundreds of pico-
promising a drastic reduction in both the size and cost of
                                                                        coulombs, femtosecond bunch durations, and normalized
particle-accelerator facilities. Such a decrease is of par-
                                                                        transverse-emittance values much smaller than their drive
ticular significance for future linear colliders [6] and the
                                                                        beams [13–18]. Once injected, the phase-stable acceleration
provision of compact free-electron-laser photon sources.
                                                                        inherent to PWFAs allows for large single-stage energy gains
The research field of beam-driven plasma-wakefield accel-
                                                                        [19] while the near-luminal phase velocity of the wake
eration (PWFA) is dynamic, with advances ranging from
                                                                        ensures a relatively high injection threshold and therefore
the energy doubling of a 42 GeV electron beam over less
                                                                        maintains a low dark–current level, which could otherwise
than a meter [7] to the efficient energy transfer from the
                                                                        increase the emittance [20]. Beam-driven internal injection
beam driving the wake (the drive beam) to the trailing beam
                                                                        therefore offers the opportunity to generate a new class of
experiencing the accelerating field (the witness beam)
                                                                        beams with significantly enhanced brightness in comparison
[8–11]. Witness beams can be injected into the plasma
                                                                        to conventional accelerator sources—an extremely desirable
wake originating either from an external source, e.g., a
                                                                        feature for future photon sources and applications in high-
photocathode, or internally by the trapping of ambient
                                                                        energy physics. While a variety of complementary internal-
                                                                        injection methods have been shown to work in principle
  *
      alexander.knetsch@desy.de                                         [21–23], precise control over the injection process, and
                                                                        consequently the injected witness-beam parameters, has so
Published by the American Physical Society under the terms of           far remained relatively unexplored.
the Creative Commons Attribution 4.0 International license.
Further distribution of this work must maintain attribution to             Density-downramp injection (DDI) [24–29] is consid-
the author(s) and the published article’s title, journal citation,      ered to be one of the most promising methods to generate
and DOI.                                                                high-brightness beams from PWFAs [30]—a prediction

2469-9888=21=24(10)=101302(10)                                  101302-1               Published by the American Physical Society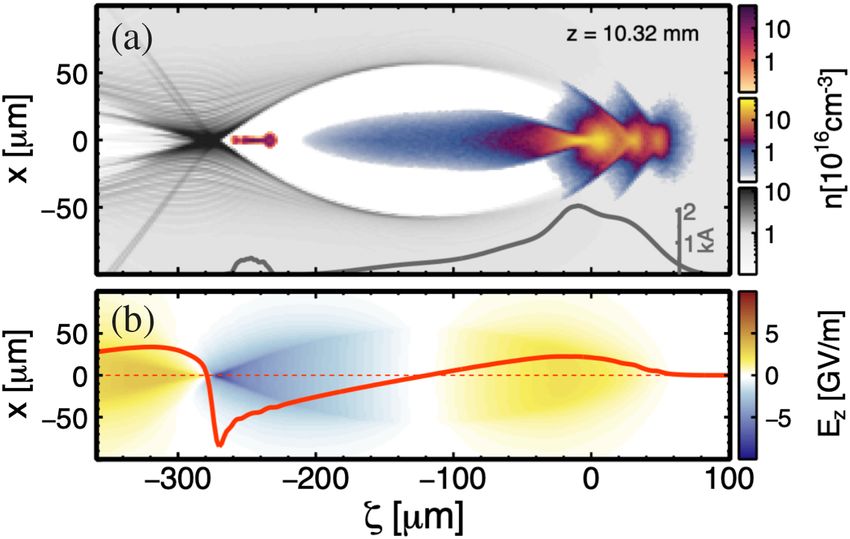
A. KNETSCH et al. PHYS. REV. ACCEL. BEAMS 24, 101302 (2021)
(b) (c)
Intensity (1014 Wcm-2)
Intensity (1015 Wcm-2)
4
0.1 y on
Electr ter
0.5
y (mm)
y (mm)
3 2 x z
ectrome
0 0 Sp
2
1
-0.5 1 -0.1
0
0
lary
-0.5 0 0.5 -0.1 0 0.1
Capil
x (mm) z (mm) US ing
(a)
-OT BP Imag es
R M d rupol
qua
ues
ontin
BP m line c S
M Bea o X-TD
OAP t
sing
Focu poles age
quad
ru y St
Dela
SP2
SP1 aser
tion L (e)
Plasma density (n0)
r
Lase Injec 0.075 4.5
ation (d) Head
Ioniz 2 4.0
Current (kA)
y (mm)
3.5
0.0
3.0
1
2.5
P Tail
-0.075 2.0
1.5
0
450 300 150 0 -150 -300 -0.075 0.0 0.075
Time (fs) z (mm)
FIG. 1. Schematic layout depicting the key elements of the experimental setup at FLASHFORWARD. (a) Laser and electron beamline
layout: P is the pick-off mirror for the transverse injection laser beam, SP1 and SP2 are spherical mirrors focusing the longitudinal
ionization laser and OAP is the off axis parabola focusing the injection laser. The BPMs are shown; US-OTR and DS-OTR represent the
upstream and downstream optical-transition-radiation screens, respectively. These can be moved into the beam path as alignment
diagnostics. Foci for the (b) ionization and (c) injection lasers on the US-OTR are shown. (d) is the measured current profile of the drive
beam. A side view of the plasma density calculated in the injection region from (c) is displayed in (e) (normalized to the background
plasma density ne ). The plasma density is calculated from ADK ionization rates [50,51]. Black lines in (e) and white lines in (b,c) are
axial projections.
encouraged by numerical studies showing witness beams the phase velocity decreases, allowing fast plasma electrons
with sub-μm transverse normalized emittances [31–34] to rephase into the accelerating region, where they rapidly
and five-dimensional brightness values of up to 1019 Am−2 attain relativistic speed and form a witness beam that is
rad−2 [34]. Furthermore, three-dimensional shaping of ramp subsequently accelerated in the wakefield. In laser-driven
gradients via laser ionization [17,18] enables extended plasma accelerators [36–38], DDI has been applied with
control over the injection process [35] and correspondingly excellent control over witness-beam energy [36,39] and
the witness-beam phase space. At a constant plasma density with injection probabilities of up to 99% [40]. In combination
ne , the wakefield phase velocity is equal to the drive beam’s with the advantages of PWFAs, it is, thus, an ideal candidate
velocity vd, and close to the vacuum speed of light c. for a reliable beam-driven plasma cathode. Assessing the
Therefore, witness beams remain phase stable over long efficacy of such a device forms the main topic of this work.
distances such that energy gains are proportional to drive- This paper describes experiments carried out at
beam energy, plasma length, and the transformer ratio [9,24]. FLASHFORWARD [41,42]—a beamline in the FLASH
The near-luminal phase velocity also precludes injection facility [43,44] dedicated to plasma-wakefield research.
of electrons forming the boundary of the plasma wake. To It reports on the experimental realization of a stable and
realize injection, a negative plasma-density gradient along controlled internal injection process in PWFA, utilizing a
the propagation direction of the driver is required in order to laser-induced density downramp. As such, it represents the
locally reduce the phase velocity of the wake. The phase first demonstration of a beam-driven plasma cathode that
velocity in such a gradient is can be reliably operated.
−1
1 ∂ne ðzÞ
vϕ ¼ vd ξþ1 ; ð1Þ II. EXPERIMENTAL SETUP
2ne ∂z
Figure 1 depicts the experimental setup at FLASHFORWARD.
where ξ ¼ z − ct is the longitudinal coordinate in the Drive beams with a charge of ð790 4Þ pC, an energy of
comoving frame, z is the longitudinal coordinate in the ð1116 6Þ MeV, and a peak current of 2.1 kA [see Fig. 1(d)]
laboratory frame, and t is time. Toward the back of the wake, were used to drive a plasma wake inside a capillary
101302-2
STABLE WITNESS-BEAM FORMATION IN A …                                     PHYS. REV. ACCEL. BEAMS 24, 101302 (2021)

plasma source. The drive beam, with a transverse rms               intensity-distribution of the laser, until the hydrodynamic
normalized emittance of ϵx;y ¼ ð14.0; 5.3Þ μm, was focused         expansion dominates on the nanosecond timescale [56,57].
at the capillary entrance by four quadrupoles. Using a             To avoid the regime of hydrodynamic expansion, the relative
combination of two cavity beam-position monitors (BPM)             time-of-arrival was set such that the injection laser arrives
[45] and a spectrometer object-plane scan, the spot size           20 ps and the injection laser 42 ps earlier than the electron
was determined to be σ dx;y ¼ ð25.5  1.6Þ μm and ð17.1           beam, as measured by delay-sensitive beam-heated plasma
0.8Þ μm [46]. Well-resolved characterization of the longi-         radiation [58].
tudinal phase space on an X-band transverse-deflection                The witness-beam charge was determined from excess
structure [47–49] downstream of the interaction point pro-         charge measured as the difference between a cavity BPM
vided a precise measurement of the drive-beam current profile      [45] directly downstream and a toroidal current transformer
shown in Fig. 1(e).                                                (toroid) upstream of the interaction chamber with a
   Plasma was generated via tunneling ionization inside            combined resolution of 1 pC [59]. As dark current
the constant-gas-flow capillary [36,52,53]. Two separate           originating from the FLASH linear accelerator can be
laser pulses—referred to as the ionization pulse and               defocused or absorped by the plasma cathode, the uncer-
injection pulse—propagated collinearly and perpendicu-             tainty in the excess-charge measurement can reach up to
larly, respectively, to the electron beam axis. The capil-         5 pC. Simultaneously with the excess charge-measurement,
lary had a total length of 50 mm with a circular access            detailed spectral and spatial information about the witness
port for the transverse injection laser located 20 mm              beams was retrieved from a LANEX scintillating phosphor
downstream of the entrance, leaving a total acceleration           screen as part of an imaging electron spectrometer capable
length of 30 mm.                                                   of profiling electron beams from a few tens of MeV
   Uncertainty about the plasma length and width was               to 2.4 GeV.
identified in previous work as stability limiting [22]. By
restricting the high-density plasma to the capillary length             III. STABLE WITNESS-BEAM FORMATION
and choosing a large spot size for the ionization laser, these        The first investigation explored how the witness beams
contributions to jitters were greatly reduced. With an             depended on the presence of the injection laser. This is
(x × y) vacuum spot size of ð333 × 461Þ μm full width              shown in Fig. 2. Panel (a) depicts the energy spectrum of
at half maximum (FWHM) [see Fig. 1(b)] and a meter-scale           the witness beam over 500 consecutive shots at a spec-
Rayleigh length, the ionization laser was able to ionize over      trometer imaging energy of 45 MeV. The corresponding
at least the length of the capillary and form a plasma             excess-charge values are plotted in panel (b). The injection
column sufficiently wide to contain the plasma wake. The           laser was blocked and unblocked for 100 events at a time.
plasma-density profile can be expected to follow the gas-          Witness beams were only measured in the spectrometer if
density profile with a taper developing toward the end of          the injection laser was released. Outside the spectral range
the capillary due to ionization defocusing (for details,
see the Appendix). The injection laser was focused much
more tightly than the ionization laser to a (z × y) spot size of            (a)
ð57 × 48Þ μm FWHM [see Fig. 1(c)] and reached signifi-
cantly higher intensity than the ionization laser to ionize
more strongly bound electrons of the 2∶1 helium-argon
gas mixture. Thus, combined laser ionization can form a
sharp density spike to initiate DDI, surrounded by a plateau
region where the witness beam is accelerated. By comparing
the measured drive-beam energy loss to three dimensional
particle-in-cell (PIC) simulations, conducted with the                      (b)
OSIRIS code [54], the plateau plasma density was deter-
mined to be 1.4þ0.4
                 −0.3 × 10
                          16
                              cm−3 .
   Spatial alignment between the laser arms and the electron
beam was achieved with screens reflecting optical transition
radiation at the injection point and downstream of the
capillary. Both injection and ionization laser arms were
derived from the same 25 TW Ti:sapphire laser system,
synchronized to the FLASH electron beam at the 100-                FIG. 2. (a) Energy spectra and (b) charge of the injected witness
femtosecond level [55] and compressed to a FWHM                    beam. The injection is switched off by blocking the injection laser
pulse duration of ð40  3Þ fs as measured in the injection-        for shot numbers 101–200 and 301–400. The mean value for each
laser beamline. The laser-ionized plasma on picosecond             group of 100 shots is indicated by a solid line, while the rms
timescales follows the plasma shape determined by the              variation of charge values is shown by a shaded area.

                                                             101302-3
A. KNETSCH et al.                                                                                    PHYS. REV. ACCEL. BEAMS 24, 101302 (2021)

        (a)                                                                                IV. SENSITIVITY TO LASER ENERGY AND
                                                                                                INJECTION-LASER ALIGNMENT
                                                                       The high injection probability and repeatability of the
                                                                    plasma cathode permit multishot characterization of the
                                                                    witness beam. For instance, variations of mean witness-
                                                                    beam charge, energy, and energy spread as a function of
                                                                    on-target ionization-laser energy are plotted in Fig. 4(a–c).
        (b)                                                         Analysis of the correlation coefficients yields, ρCharge ¼
                                                                    0.08, ρEnergy ¼ 0.34, and ρΔE=E ¼ 0.12, revealing a weak
                                                                    influence on witness-beam charge and thus indicating that
                                                                    the downramp-gradient did not vary strongly with laser
                                                                    energy. However, the influence on the witness-beam energy
                                                                    is much more pronounced. The relationship between laser
                                                                    energy and witness-beam energy is illustrated more clearly
        (c)                         (d)
                                                                    by systematically varying the laser energy over a broader
                                                                    range. The total laser energy was scanned in an on-target-
                                                                    energy range of 44–96 mJ for the ionization laser and a
                                                                    corresponding range of 3.5–7.7 mJ for the injection laser.
                                                                    Figure 4(d) shows a nearly linear correlation between laser
                                                                    energy and the witness-beam energy. The slope extracted
                                                                    from the data translates the measured rms laser-energy jitter
                                                                    of 1.5% to a contribution of 3.9% rms to the energy jitter of
FIG. 3. (a) Waterfall plot of the witness-beam spectrum for         the witness beam.
1885 consecutive shots. (b) The electron-beam mean energy              This contribution is sufficiently small that the effective
(blue) and rms energy spread (red). (c) Histogram of the witness-   accelerating field along the 30 mm acceleration length
beam charge, measured from the calibrated spectrometer screen       can be fine-tuned between 1.3 and 2.7 GV=m by varying
with a double-Gaussian fit shown in red. (d) Histogram of the       the laser energy. The observed correlation can likely be
witness beam mean energy. Each histogram has 50 bins.               explained by a higher plasma density throughout the

of the plot, no witness-beam signal was observed. An                                                    No. of events
excess charge of Qon ¼ ð32.1  9.6Þ pC was detected                                                     0 5 10 15
when the injection laser was unblocked. The equivalent
                                                                     E/E (%) E (MeV) Charge (pC)

                                                                                                   60 (a)                                               80
value when the injection laser was switched off was                                                                     (d)
Qoff ¼ ð0  5Þ pC. Both distributions are clearly separated                                        40                                                   75
by more than 2σ, unambiguously confirming that the

                                                                                                                                                             Mean energy (MeV)
                                                                                                   20                                                   70
witness-beam formation is triggered by the injection laser                                         60
                                                                                                        (b)                                             65
and DDI is established as the sole mechanism at play.
                                                                                                   50                                                   60
   Next, a dataset of 1885 consecutive shots taken at a
repetition rate of 2 Hz and recorded over a time span of                                           40                                                   55
approximately 15 min was used to explore the reliability of                                         8 (c)                                               50
the plasma cathode. Awaterfall plot of the projected witness-                                       6
                                                                                                                                                        45
beam energy spectra is shown in Fig. 3(a). No drift in spectral                                     4                                     Data
properties is observed. Figure 3(b) shows the evolution of the                                      2                                     Working point 40
mean energy and rms energy spread. An injected witness                                                   60 62 64       50    60    70     80    90   100
beam was measured for ð95.4  2.5Þ% of the shots, repre-                                           Laser energy (mJ)           Laser energy (mJ)
sented by the two distributions visible in Fig. 3(c). Analysis
of these distributions yields a mean witness charge and             FIG. 4. (a) Correlation plots between on-target ionization-laser
energy of ð33  10Þ pC and ð45  5Þ MeV, respectively,              energy and charge (a), mean energy (b), and relative energy
[see Fig. 3(c) and (d)] with an rms relative energy spread of       spread (c) for the injected witness beams in Fig. 3(a). Red lines
                                                                    indicate a linear fit through the data points. (d) Results of a
hΔE
  E i ¼ 4.4%. Furthermore, no correlation between the wit-          systematic laser-energy scan highlighting the relationship be-
ness beam charge or energy and the laser timing was detected        tween witness-beam energy and on-target laser energy. Error bars
up to ≈200 ps relative time-of-arrival between drive beam           indicate the standard error. The working point for the data
and laser pulses.                                                   presented in this paper is indicated by a green circle.

                                                              101302-4
STABLE WITNESS-BEAM FORMATION IN A …                                       PHYS. REV. ACCEL. BEAMS 24, 101302 (2021)

accelerating part of the plasma cathode from ionization of           were constant throughout the dataset and originated from
more strongly bound electrons at higher laser intensities,           two main sources: the rms y-position jitter of the electron
resulting in increased accelerating gradients. Plasma for-           beam at the injection position, σ ey ¼ 1.4 μm, measured by
mation is decoupled from wake excitation because the                 two cavity BPMs [45] around the plasma chamber, and the
driver does not ionize the plasma by itself. Therefore, any          rms variation of the laser-centroid y position, σ inj
                                                                                                                       y ¼ 4.2 μm,
change in witness-beam properties is a result of a change to         measured at the focus.
the plasma-density distribution. Energy-jitter in the witness           A comparison between the experimental data and a
beam can thus be further reduced e.g., by designing laser            PIC-simulated offset scan is plotted in Fig. 5, based on
systems with lower energy jitter. If the argon in the gas            the measured plasma profile [see Fig. 1(e)]. Here, 0 μm
mixture were to be replaced with a different gas e.g.,               corresponds to the highest simulated injected charge. The
hydrogen, the effect of ionization defocusing can be                 relative offset between the electron beam and injection laser
minimized and ionization along the gas-filled capillary              could not be measured to sub-spot-size accuracy. Rather, it
source could more easily saturate, reducing the sensitivity          was determined by fitting the simulation-based model to
to the laser energy at the cost of fine control over the             the data. The data presented in Figs. 2–4 were taken at the
witness-beam energy.                                                 working point indicated in Fig. 5 i.e., 24 μm offset from
    While witness-beam energy can be tuned by manipulat-             the center of the injection plasma. Both simulations and
ing the laser energy, the injected charge shows a low                experimental data show that the witness-beam charge can
sensitivity to laser energy; however, the relative position of       be maximized by optimizing positioning in y. Furthermore,
the injection laser and electron beam has a much stronger            the slope of the simulation-based model gives an estimate
influence. The relative y-position jitter between laser and          of the charge variation resulting from y-position jitter of
electron beam is expected to be the predominant influence            6.9 pC. Therefore, charge variation in the witness bunch
on the witness-beam charge, while other variations can be            can be explained predominantly by the position jitter
assumed to have a negligible effect. Variations in z position        between the electron beam and the injection laser, which
of the laser of σ inj
                    z ¼ 3.4 μm only influence the injection
                                                                     is dominated by the laser pointing jitter. Such jitter would
position along the electron-beam axis, which only changes            be eliminated e.g., by using an injection laser with a spot
the acceleration length not the injection process. This gives a      size that is wider than the plasma wake and has similar
maximum contribution to the final energy jitter of ≈10 keV.          intensity. Focusing optics that produce asymmetric foci will
    Similarily, the x-position jitter of the electron-beam waist     be considered for this purpose in the future.
σ ex ¼ 1.0 μm is much smaller than the Rayleigh length of
the injection-laser focus and is therefore also considered to              V. WITNESS-BEAM EMITTANCE AND
be negligible. Figure 5 shows the measured excess charge as                          DIVERGENCE
a function of injection-laser position in y relative to the             The brightness of a bunch of particles is dependent on its
electron-beam axis. Every data point plotted in Fig. 5               transverse emittance. Emittance-measurement techniques
represent an average of 20 events, with the error on the             are typically averaged over many shots and, therefore,
measured charge given by the rms variation of the witness-           require stable and reproducible sources. In the past, this has
beam charge. Error bars on the position, σ e;inj   y   ¼ 4.5 μm,     not been possible with beams internally injected into
                                                                     PWFAs due to the previous instability of the plasma
                                                                     cathode. Instead, single-shot methods were utilized that
                                                                     e.g., rely on assumptions on the beta-function of the beam
                                                                     [22] or an energy-independent beam-slice emittance to take
                                                                     advantage of large energy spreads and the chromaticity in
                                                                     quadrupole focusing [19]. Such methods will, however,
                                                                     be increasingly difficult to apply with envisioned future
                                                                     high-quality beams with low-energy spread [60] and low
                                                                     divergence. In that case, multishot methods, as commonly
                                                                     used in accelerators, will be more adequate. The high
                                                                     stability described in this paper made a quadrupole scan
                                                                     possible, enabling the first multishot measurement of the
                                                                     injected bunch’s transverse emittance.
FIG. 5. Effect of centroid laser-spot positioning with respect
to the electron beam. The laser position was measured on the            Figure 6(a) shows the results of such a scan, providing
upstream OTR camera while the charge was measured on the             the transverse beam size at the corresponding object plane
electron spectrometer screen (points with error bars). Results are   s. In the absence of focusing forces, a witness beam with
compared to simulation results, shown as squares with the plasma     transverse geometric emittance εx and a beta function β at
profile modeled as shown in Fig. 1(e). The working point for the     its virtual source point s0 will expand outside the plasma
data presented in this paper is indicated by a green circle.         such that it has a transverse rms beam size of

                                                               101302-5
A. KNETSCH et al.                                                                 PHYS. REV. ACCEL. BEAMS 24, 101302 (2021)

       (a)                                                 (b)              εnx ðs0 Þ ¼ ð9.3  0.3Þ μm, increasing by less than 0.2%
                                                                            before reaching the first quadrupole at a distance of
                                                                            0.658 m. An example of the witness-beam signal measured
                                                                            on the spectrometer screen is shown in Fig. 6(b). The
                                                                            visible oscillatory structure can be interpreted as transverse
                                                                            centroid oscillations of longitudinal witness-beam slices
                                                                            that have probably contributed to an increase in projected
                                                                            emittance during acceleration.

                                                                                               VI. CONCLUSION
FIG. 6. (a) Scan of the imaging quadrupole focusing strength.                  This paper demonstrates a plasma cathode with stability
Each data point represents a single event with an injected witness          at a level unprecedented in the field of beam-driven plasma
beam. Transverse beam sizes on the spectrometer screen and mean             injectors. The high degree of stability enabled detailed
Lorentz factor hγi were calculated from the spectrometer signal.            studies of the plasma cathode, revealed dependencies
From the quadrupole strength and hγi, the object plane s and the            between witness-beam and plasma parameters, and enabled
magnification were calculated to extract σ x ðsÞ at the corresponding       the first multishot emittance and divergence measurement
object plane. Error bars on σ x and s were calculated analogously
                                                                            of an internally injected witness beam. The presented
based on the rms energy spread. The exit of the capillary (shown as
a light blue line in (a) and the inset) is at s ¼ 0. Object planes in the
                                                                            results are compatible with very low emittance growth at
range between s ¼ 0.5 m–5.9 m lie too close to the quadrupoles              the extraction from the plasma. Effective accelerating
(shown as gray lines) to be imaged. (b) An example of a witness-            gradients, which can be precisely tuned in the range
beam signal as measured on the spectrometer screen.                         1.3–2.7 GV=m, were demonstrated. Sources of charge
                                                                            and energy jitter were identified, and mitigation strategies
                          sffiffiffiffiffiffiffiffiffiffiffiffiffiffiffiffiffiffiffiffiffiffiffiffiffiffiffiffiffiffiffiffiffiffiffiffiffiffi
                                                             ffi            were proposed for future applications. The setup described
                                                            2
                                             ðs   −   s 0 Þ                 here will enable future optimization of the working point to
                 σ x ðsÞ ¼ εx β þ                                    ð2Þ
                                                   β                       reach lower initial emittance e.g., by improving the overlap
                                                                            between injection-laser and electron beam, symmetric
at longitudinal position s. Fitting Eq. (2) to the data gives a             focusing of the drive-beam or via manipulation of the
divergence of θ¼ð0.650.01Þmrad and s0 ¼ð3816Þ mm.                         drive-beam current profile to reduce offset-oscillations in
   The fact that s0 is measured 381 mm downstream of the                    the witness beam. Furthermore, the setup will enable
capillary exit is likely an effect of a weak plasma wake,                   studying beam propagation after the exit of plasma stages,
driven in the laser-ionized low-density gas transition                      which is of high importance for the transport of low-
between the capillary exit and the vacuum. According to                     emittance beams from plasma cathodes in general. The
fluid simulations, the on-axis gas density is expected to                   presented results constitute a significant step toward stable,
drop at the capillary exit by two orders of magnitude over a                controllable beam-driven plasma cathodes and brightness-
distance of ≈40 mm, at which point it approaches the                        converter stages, which are of great interest for next-
measured ambient gas density in the experimental chamber                    generation photon-science and particle-physics facilities.
of 1014 cm−3 . This gas would be ionized because of the
long Rayleigh length of the ionization laser. Plasma wakes                                  ACKNOWLEDGMENTS
driven in such a low-density plasma continue to focus
                                                                               The authors thank M. Dinter, S. Karstensen, K. Ludwig,
witness beams for several centimeters beyond the capillary
                                                                            F. Marutzky, A. Rahali, V. Rybnikov, A. Schleiermacher, and
and continuously increase their beta functions [61], pos-
                                                                            S. Kottler, as well as the FLASH team, MVS group, divisions
sibly explaining the particularly low divergence observed in
                                                                            of high energy (FH), and machine (M) physics at DESY
this experiment.
                                                                            for their support. We also thank the OSIRIS consortium (IST/
   The transverse normalized emittance,
                                                                            UCLA) for access and support with the OSIRIS three-
                         sffiffiffiffiffiffiffiffiffiffiffiffiffiffiffiffiffiffiffiffiffiffiffiffiffiffiffiffiffiffiffiffiffiffiffiffiffiffiffiffiffi
                           2                                              dimensional code; M. Kirchen and S. Jalas, from the
                              ΔE                                            University of Hamburg, for making the pipeline-analysis
             ϵn ðsÞ ¼ hγi                 σ x 2 σ x0 2 þ ϵx 2 ;       ð3Þ
                               E                                            software available. We gratefully acknowledge the use of
                                                                            High-Performance Cluster (Maxwell) at DESY and Gauss
depends on the s-dependent rms beam divergence σ x0 , spot                  Centre for Supercomputing (GCS) e.V. resources. GCS has
size σ x , rms energy spread, and mean Lorentz factor hγi.                  supported this project by providing computing time through
Therefore, beams from plasma cathodes with high-energy                      the John von Neumann Institute for Computing (NIC) on the
spread and high divergence can suffer from emittance                        GCS Supercomputer JUWELS at Jülich Supercomputing
growth after exiting the plasma [62]. The measurement                       Centre (JSC). B. H. and L. B. acknowledge the support of the
described here gives an emittance at the plasma exit of                     European Research Council (ERC) under the European

                                                                      101302-6
STABLE WITNESS-BEAM FORMATION IN A …                                     PHYS. REV. ACCEL. BEAMS 24, 101302 (2021)

Unions Horizon 2020 research and innovation programme
(NeXource, ERC Grant agreement No. 865877).

         APPENDIX A: LASER IONIZATION
   Ionization laser and injection laser were separated with a
0.500 pick-off mirror that was inserted into the laser path to
reflect the central part of the 34 mm-diameter laser beam into
the injection-laser beamline. As depicted in Fig. 1(a), the
remaining part of the laser continued to propagate along the
ionization-laser arm. Focusing of the ionization laser was
                                                                  FIG. 7. Normalized integrated plasma-afterglow signal as a
achieved by two spherical mirrors with a resulting effective
                                                                  function of the time-of-arrival (TOA) between the drive beam and
focal length of 18 m. An f=51 off axis parabola focused the       the ionization (Ion.) and injection (Inj.) lasers; t ¼ 0 is defined as
injection laser perpendicular to the electron-beam axis           the TOA of the electron beam. Inset are examples of the signal
through a fused silica window. To minimize nonlinear              enhancement due to electron-beam-induced heating of the plasma
dispersion that can deteriorate the quality of the focal spot     formed by the ionization laser.
or pulse length, the window thickness was chosen to be
1.5 mm only, resulting in a maximal B-integral of 0.27. The
intensity of the injection laser was set to be significantly      camera images are depicted as insets. The visible transi-
higher than that of the ionization laser such that the latter     tions in Fig. 7 determine the TOA delay settings with
ionized argon up to its second level whilst the former was        respect to the electron beam. Once the lasers were set up,
capable of additionally ionizing the third ionization level of    the capillary was positioned to maximize laser transmission
argon and the first of helium (see Table I). At the same time,    through the capillary holes.
the required intensities are sufficiently low to avoid signifi-
cant ponderomotive heating of the plasma electrons [63].                     APPENDIX C: PIC SIMULATIONS
                                                                     The gas flow inside and outside the capillary was
             APPENDIX B: ALIGNMENT AND                            modeled with COMSOL and ANSYS. To simulate the plasma
                 SYNCHRONIZATION                                  generation by the ionization laser, the resulting model of
   The precise relative time-of-arrival between electron-         the gas-density profile and measurements of the laser
beam, ionization laser, and injection laser was adjusted          parameters served as input into a numerical study con-
utilizing plasma-afterglow observation of beam-heated             ducted with the code FBPIC [65]. These studies showed that
plasmas. The recombination light from the plasma after            the plasma density can develop a taper toward the down-
the passage of an electron beam with currents of order kA         stream end of the capillary due to ionization defocusing of
can be used to synchronize lasers to electron beams to            the ionization laser. Similar simulations confirmed that in
within a few femtoseconds [58]. This effect was used to           the case of the injection laser, the effect of the interaction
synchronize the two laser arms to the drive beam. For this        with plasma onto the laser-pulse is sufficiently small and
measurement, the experimental chamber was filled with             the shape of the plasma-density spike can be calculated
argon gas to 0.05 mbar and a plasma was ionized by the            from the intensity-distribution as measured in vacuum.
corresponding lasers with the capillary removed. Figure 7         The injection and acceleration of the witness beam was
shows the time-of-arrival (TOA) dependence of plasma              finally modeled with the three-dimensional PIC simulation
light collected by a charge-coupled device camera viewing         code OSIRIS [54]. Simulations were performed with a
from the top for each of the laser arms—examples of               comoving window of ð460 × 400 × 400Þ μm in ðz; x; yÞ
                                                                  with ð256 × 256 × 256Þ cells. A resolution convergence
                                                                  test was conducted. The drive-beam current profile, charge,
TABLE I. Relevant ionization energies [64] and the corre-         and spot size were modeled based on measurements. The
sponding laser intensities for a tunnel ionization rate [51] of   number of macroparticles per cell (PPC) for the drive beam
1 fs−1 at a laser wavelength of 800 nm.                           was 8. While the PPC for the background plasma electrons
Ionization            Ionization energy     IðWADK ¼ 1 fs−1 Þ     was 1, the PPC was increased to 8 in a radius of 100 μm
level                        (eV)              (W=cm2 )           around the density downramp to resolve the physics of
                                                                  the injection process more accurately. The modeled
Ar-I                       15.76               4.6 × 10¹⁴         plasma-density distribution was assumed with a plateau
Ar-II                      27.63               1.0 × 10¹⁵
                                                                  density of 1.4 × 1016 cm−3 . Since the detailed structure of
Ar-III                     40.74               2.1 × 10¹⁵
                                                                  the taper can vary with laser parameters and gas density, the
He-I                       24.59               2.2 × 10¹⁵
                                                                  knowledge of the precise on axis plasma density decreases
He-II                      54.42               1.2 × 10¹⁶
                                                                  with laser-propagation distance. As a result, the OSIRIS

                                                            101302-7
A. KNETSCH et al.                                                                PHYS. REV. ACCEL. BEAMS 24, 101302 (2021)
                                                                                1                                                     1
                                                                                     (a)         Start quadrupoles
                                                                               0.8                                                    0.8

                                                                                                                                            (mrad)
                                                                        (mm)
                                                                               0.6                                                    0.6

                                                                               0.4                                                    0.4

                                                                          x

                                                                                                                                               x'
                                                                               0.2                                                    0.2

                                                                                0                                                     0
                                                                               9.8
                                                                                     (b)

                                                                        ( m)
                                                                               9.6

                                                                               9.4

                                                                          n
                                                                               9.2
FIG. 8. Simulation snapshot during the witness-beam accel-                                 0.5                   1                  1.5
eration: Cut through the plasma wake with electron densities (a)                                        s (m)
of witness beam (top right-hand colorbar), drive-beam (central
colorbar), background plasma (bottom colorbar), and longi-             FIG. 10. (a) Fit result of measured waist of witness-beam and
tudinal current profile (solid gray line). (b) Longitudinal electric   corresponding s-dependent divergence. (b) Emittance-growth in
field as a central cut and an on axis one-dimensional projection       the drift-space downstream of the plasma cathode.
(solid red line).

simulations are assumed to only model the experiment with              giving, respectively, the mean value and error limits for s
sufficient accuracy until shortly after the injection and thus         and σ x for each data point. The measurement samples the
results are shown at a longitudinal position of z ¼ 10.32 mm           virtual waist of the free-space propagation of the witness
downstream of the injection-laser focus. A snapshot of the             beam outside thepplasma,                   which ffi follows Eq. (2). An
                                                                                                   ffiffiffiffiffiffiffiffiffiffiffiffiffiffiffiffiffiffiffiffiffiffiffiffiffiffiffiffiffi
simulated acceleration process can be seen in Fig. 8 and the           equation σ x ðsÞ ¼ A þ Bðs − s0 Þ2 , with fit parameters
slice properties and longitudinal phase space of the witness           A, B, and s0 was fitted to the data. From A ¼ β ϵx and
beam are shown in Fig. 9. The injection laser was positioned           B ¼ βϵx , the geometric emittance ϵx and the waist beta
ð23.5  4.5Þ μm off axis with respect to the electron beam             function β were calculated.
and varied to simulate the offset scan.                                    It can be shown that the normalized emittance of electron
                                                                       beams with nonzero energy spread can increase in the drift-
  APPENDIX D: EMITTANCE MEASUREMENT                                    space downstream of the waist [62]. For relativistic beams
                                                                       (vc ≈ 1) under the assumption that γ is independent of x and
   To calculate the datapoints shown in Fig. 6, the object             x0 , this effect is described by Eq. (3). Figure 10 illustrates
plane and magnification was evaluated depending on                     the postplasma emittance growth of the measured plasma
energy and focusing strength of the imaging quadrupoles.               cathode. The spot size σ x ðsÞ according to the fit results and
This calculation was performed for the mean energy, upper                            x ðsÞ
                                                                       σ x0 ðsÞ ¼ dσds     is plotted in panel (a), where the divergence
standard-deviation limit and lower standard-deviation limit,
                                                                       θ is the asymptotic limit of σ x0 ðsÞ for large distances s.
                                                                       The corresponding growth in normalized emittance is
                                                                       plotted in Fig. 10(b) and shows that the measurements
                                                                       are compatible with a small increase of less than 1% over
                                                                       1 m of propagation outside the plasma.

                                                                        [1] J. B. Rosenzweig, D. B. Cline, B. Cole, H. Figueroa, W.
                                                                            Gai, R. Konecny, J. Norem, P. Schoessow, and J. Simpson,
                                                                            Phys. Rev. Lett. 61, 98 (1988).
                                                                        [2] P. Chen, J. M. Dawson, R. W. Huff, and T. Katsouleas,
                                                                            Phys. Rev. Lett. 54, 693 (1985).
                                                                        [3] J. B. J. B. Rosenzweig, B. Breizman, T. Katsouleas, and
                                                                            J. J. Su, Phys. Rev. A 44, R6189 (1991).
                                                                        [4] T. Tajima and J. M. Dawson, Phys. Rev. Lett. 43, 267
FIG. 9. Longitudinal phase space of the simulated witness-                  (1979).
beam parameter (a) and slice parameters (b) after 10.32 mm of           [5] R. D. Ruth, A. W. Chao, L. Morton, and P. B. Wilson, Part.
acceleration.                                                               Accel. 17, 171 (1985), https://cds.cern.ch/record/157249.

                                                                101302-8
STABLE WITNESS-BEAM FORMATION IN A …                                        PHYS. REV. ACCEL. BEAMS 24, 101302 (2021)

 [6] B. Cros, P. Muggli, C. Schroeder, S. Hooker, P. Piot, J.         [27] M. C. Thompson, J. B. Rosenzweig, and H. Suk, Phys.
     England, S. Gessner, J. Vieira, E. Gschwendtner, J.-L. Vay            Rev. ST Accel. Beams 7, 011301 (2004).
     et al., arXiv:1901.10370.                                        [28] S. Bulanov, N. Naumova, F. Pegoraro, and J. Sakai, Phys.
 [7] I. Blumenfeld, C. E. Clayton, F. J. Decker, M. J. Hogan, C.           Rev. E 58, R5257 (1998).
     Huang, R. Ischebeck, R. Iverson, C. Joshi, T. Katsouleas,        [29] P. Tomassini, M. Galimberti, A. Giulietti, D. Giulietti,
     N. Kirby et al., Nature (London) 445, 741 (2007).                     L. A. Gizzi, L. Labate, and F. Pegoraro, Phys. Rev. ST
 [8] M. Litos, E. Adli, W. An, C. I. Clarke, C. E. Clayton, S.             Accel. Beams 6, 121301 (2003).
     Corde, J. P. Delahaye, R. J. England, A. S. Fisher, J.           [30] F. Albert, M.-E. Couprie, A. D. Debus, M. Downer, J.
     Frederico et al., Nature (London) 515, 92 (2014).                     Faure, A. Flacco, L. A. Gizzi et al., New J. Phys. 23,
 [9] G. Loisch, G. Asova, P. Boonpornprasert, R. Brinkmann,                031101 (2021).
     Y. Chen, J. Engel, J. Good, M. Gross, F. Grüner, H. Huck         [31] J. Grebenyuk, A. M. de la Ossa, T. Mehrling, and J.
     et al., Phys. Rev. Lett. 121, 064801 (2018).                          Osterhoff, Nucl. Instrum. Methods Phys. Res., Sect. A
[10] S. Corde, E. Adli, J. M. Allen, W. An, C. I. Clarke, C. E.            740, 246 (2014).
     Clayton, J. P. Delahaye, J. Frederico, S. Gessner, S. Z.         [32] A. Martinez de la Ossa, Z. Hu, M. J. V. Streeter, T. J.
     Green et al., Nature (London) 524, 442 (2015).                        Mehrling, O. Kononenko, B. Sheeran, and J. Osterhoff,
[11] C. A. Lindstrøm, J. M. Garland, S. Schröder, L. Boulton,              Phys. Rev. Accel. Beams 20, 091301 (2017).
     G. Boyle, J. Chappell et al., Phys. Rev. Lett. 126, 014801       [33] X. L. Xu, F. Li, W. An, T. N. Dalichaouch, P. Yu, W. Lu, C.
     (2021).                                                               Joshi, and W. B. Mori, Phys. Rev. Accel. Beams 20,
[12] R. Pompili, D. Alesini, M. Anania, M. Behtouei, M.                    111303 (2017).
     Bellaveglia, A. Biagioni, F. Bisesto, M. Cesarini, E.            [34] C. Zhang, C.-K. Huang, K. A. Marsh, X. L. Xu, F. Li, M.
     Chiadroni, A. Cianchi et al., Nat. Phys. 17, 499 (2021).              Hogan, V. Yakimenko, S. Corde, W. B. Mori, and C. Joshi,
[13] B. Hidding, G. Pretzler, J. B. Rosenzweig, T. Königstein,             Phys. Rev. Accel. Beams 22, 111301 (2019).
     D. Schiller, and D. L. Bruhwiler, Phys. Rev. Lett. 108,          [35] D. Ullmann, P. Scherkl, A. Knetsch, T. Heinemann, A.
     035001 (2012).                                                        Sutherland, A. Habib, O. Karger, A. Beaton, G. Manahan,
[14] F. Li, J. F. Hua, X. L. Xu, C. J. Zhang, L. X. Yan, Y. C. Du,         A. Deng et al., arXiv:2007.12634.
     W. H. Huang, H. B. Chen, C. X. Tang, W. Lu et al., Phys.         [36] A. J. Gonsalves, K. Nakamura, C. Lin, D. Panasenko, S.
     Rev. Lett. 111, 015003 (2013).                                        Shiraishi, T. Sokollik, C. Benedetti, C. B. Schroeder, C. G. R.
[15] A. Martinez de la Ossa, J. Grebenyuk, T. Mehrling, L.                 Geddes, J. Van Tilborg et al., Nat. Phys. 7, 862 (2011).
     Schaper, and J. Osterhoff, Phys. Rev. Lett. 111, 245003          [37] J. Faure, C. Rechatin, O. Lundh, L. Ammoura, and V.
     (2013).                                                               Malka, Phys. Plasmas 17, 083107 (2010).
[16] Y. Wan, C. J. Zhang, F. Li, Y. P. Wu, J. F. Hua, C. H. Pai, W.   [38] K. Schmid, A. Buck, C. M. S. Sears, J. M. Mikhailova, R.
     Lu, Y. Q. Gu, X. L. Xu, C. Joshi, and W. B. Mori, Plasma              Tautz, D. Herrmann, M. Geissler, F. Krausz, and L. Veisz,
     Phys. Controlled Fusion 58, 034015 (2016).                            Phys. Rev. ST Accel. Beams 13, 091301 (2010).
[17] G. Wittig, O. Karger, A. Knetsch, Y. Xi, A. Deng, J. B.          [39] K. Swanson, H.-E. Tsai, S. Barber, R. Lehe, H.-S. Mao,
     Rosenzweig, D. L. Bruhwiler, J. Smith, G. G. Manahan,                 S. Steinke, J. Van Tilborg, K. Nakamura, C. Geddes, C.
     Z. M. Sheng et al., Phys. Rev. ST Accel. Beams 18, 081304             Schroeder et al., Phys. Rev. Accel. Beams 20, 051301
     (2015).                                                               (2017).
[18] G. Wittig, O. S. Karger, A. Knetsch, Y. Xi, A. Deng, J. B.       [40] A. Buck, J. Wenz, J. Xu, K. Khrennikov, K. Schmid, M.
     Rosenzweig, D. L. Bruhwiler, J. Smith, Z. M. Sheng et al.,            Heigoldt, J. M. Mikhailova, M. Geissler, B. Shen, F.
     Nucl. Instrum. Methods Phys. Res., Sect. A 829, 83 (2016).            Krausz et al., Phys. Rev. Lett. 110, 185006 (2013).
[19] N. Vafaei-Najafabadi, W. An, C. Clayton, C. Joshi, K.            [41] A. Aschikhin, C. Behrens, S. Bohlen, J. Dale, N. Delbos,
     Marsh, W. Mori, E. Welch, W. Lu, E. Adli, J. Allen et al.,            L. di Lucchio, E. Elsen, J.-H. Erbe, M. Felber, B. Foster
     Plasma Phys. Controlled Fusion 58, 034009 (2016).                     et al., Nucl. Instrum. Methods Phys. Res., Sect. A 806, 175
[20] G. Manahan, A. Deng, O. Karger, Y. Xi, A. Knetsch, M.                 (2016).
     Litos, G. Wittig, T. Heinemann et al., Phys. Rev. Accel.         [42] R. D’Arcy, A. Aschikhin, S. Bohlen, G. Boyle, T.
     Beams 19, 011303 (2016).                                              Brümmer, J. Chappell, S. Diederichs, B. Foster, M. J.
[21] N. Vafaei-Najafabadi, K. A. Marsh, C. E. Clayton, W. An,              Garland, L. Goldberg et al., Phil. Trans. R. Soc. A 377,
     W. B. Mori, C. Joshi, W. Lu, E. Adli, S. Corde, M. Litos              20180392 (2019).
     et al., Phys. Rev. Lett. 112, 025001 (2014).                     [43] W. Ackermann, G. Asova, V. Ayvazyan, A. Azima, N.
[22] A. Deng, O. S. Karger, T. Heinemann, A. Knetsch, P.                   Baboi, J. Bähr, V. Balandin, B. Beutner, A. Brandt, A.
     Scherkl, G. G. Manahan, A. Beaton, D. Ullmann, G.                     Bolzmann et al., Nat. Photonics 1, 336 (2007).
     Wittig, A. F. Habib et al., Nat. Phys. 15, 1156 (2019).          [44] S. Schreiber and B. Faatz, High Power Laser Sci. Eng. 3,
[23] E. Oz, S. Deng, T. Katsouleas, P. Muggli, C. D. Barnes, I.            e20 (2015).
     Blumenfeld, F. J. Decker, P. Emma, M. J. Hogan, R.               [45] D. Lipka, D. Nölle, M. Siemens, and S. Vilcins, in
     Ischebeck et al., Phys. Rev. Lett. 98, 084801 (2007).                 Proceedings of LINAC (JACoW, Tsukuba, 2010).
[24] T. Katsouleas, Phys. Rev. A 33, 2056 (1986).                     [46] C. A. Lindstrøm, R. D’Arcy, M. J. Garland, P. Gonzalez, B.
[25] H. Suk, N. Barov, J. B. Rosenzweig, and E. Esarey, Phys.              Schmidt, S. Schröder, S. Wesch, and J. Osterhoff, Phys.
     Rev. Lett. 86, 1011 (2001).                                           Rev. Accel. Beams 23, 052802 (2020).
[26] R. J. England, J. B. Rosenzweig, and N. Barov, Phys. Rev.        [47] B. Marchetti, R. Assmann, B. Beutner, J. Branlard, F.
     E 66, 016501 (2002).                                                  Christie, R. D’Arcy, W. Decking, U. Dorda, J. Herrmann

                                                               101302-9
A. KNETSCH et al.                                                          PHYS. REV. ACCEL. BEAMS 24, 101302 (2021)

       et al., in Proceedings of IPAC17 (JACoW, Copenhagen,          [57] R. J. Shalloo, C. Arran, L. Corner, J. Holloway,
       2017), pp. 184–187.                                                J. Jonnerby, R. Walczak, H. M. Milchberg, and S. M.
[48]   R. D’Arcy, A. Aschikhin, P. Gonzalez Caminal, V. Libov,            Hooker, Phys. Rev. E 97, 053203 (2018).
       and J. Osterhoff, in Proceedings of the 9th International     [58] P. Scherkl, A. Knetsch, T. Heinemann, A. Sutherland, A. F.
       Particle Accelerator Conference (Joint Accelerator Con-            Habib, O. Karger, D. Ullmann, A. Beaton, G. Kirwan, G.
       ferences Website (JaCOW), Geneva, 2018).                           Manahan et al., arXiv:1908.09263.
[49]   R. DArcy, V. Libov, and J. Osterhoff, in Proceedings of       [59] D. Lipka, A. Affeldt, R. Awwad, N. Baboi, R. Barret, B.
       IBIC’16 (JACOW, Barcelona, 2016), pp. 760–763.                     Beutner, F. Brinker, W. Decking, A. Delfs, M. Drewitsch
[50]   D. L. Bruhwiler, D. A. Dimitrov, J. R. Cary, E. Esarey, W.         et al., in Proceedings of IBIC’16 (JACoW, Barcelona,
       Leemans, and R. E. Giacone, Phys. Plasmas 10, 2022                 2016), pp. 14–19.
       (2003).                                                       [60] G. G. Manahan, A. F. Habib, P. Scherkl, P. Delinikolas, A.
[51]   M. V. Ammosov, N. B. Delone, and V. P. Krainov, in                 Beaton, A. Knetsch, O. Karger, G. Wittig, T. Heinemann,
       Proceedings of SPIE 0664, High Intensity Laser Processes           Z.-M. Sheng et al., Nat. Commun. 8 (2017).
       (1986), Vol. 0664, https://doi.org/10.1117/12.938695.         [61] K. Floettmann, Phys. Rev. ST Accel. Beams 17, 054402
[52]   A. J. Gonsalves, K. Nakamura, J. Daniels, C. Benedetti,            (2014).
       C. Pieronek, T. C. De Raadt, S. Steinke, J. H. Bin, S. S.     [62] M. Migliorati, A. Bacci, C. Benedetti, E. Chiadroni, M.
       Bulanov, J. Van Tilborg, C. G. Geddes, C. B. Schroeder,            Ferrario, A. Mostacci, L. Palumbo, A. R. Rossi, L. Serafini,
       C. Tóth, E. Esarey, K. Swanson, L. Fan-Chiang, G.                  and P. Antici, Phys. Rev. ST Accel. Beams 16, 011302
       Bagdasarov et al., Phys. Rev. Lett. 122, 084801 (2019).            (2013).
[53]   A. Butler, D. J. Spence, and S. M. Hooker, Phys. Rev. Lett.   [63] C. B. Schroeder, J. L. Vay, E. Esarey, S. S. Bulanov, C.
       89, 185003 (2002).                                                 Benedetti, L.-L. Yu, M. Chen, C. G. R. Geddes, and
[54]   R. A. Fonseca, L. O. Silva, F. S. Tsung, V. K. Decyk, W.           W. P. Leemans, Phys. Rev. ST Accel. Beams 17, 101301
       Lu, C. Ren, W. B. Mori, S. Deng, S. Lee, T. Katsouleas,            (2014).
       and J. C. Adam, in International Conference on Computa-       [64] A. Kramida, Y. Ralchenko, and NIST ASD Team, NIST
       tional Science (Springer, Berlin, 2002), pp. 342–351.              Atomic Spectra Database Ionization Energies, 2020,
[55]   S. Schulz, I. Grguraš, C. Behrens, H. Bromberger, J. T.            https://physics.nist.gov/asd.
       Costello, M. K. Czwalinna, M. Felber, M. C. Hoffmann,         [65] R. Lehe, M. Kirchen, I. A. Andriyash, B. B. Godfrey,
       M. Ilchen, H. Y. Liu et al., Nat. Commun. 6 (2015).                and J. L. Vay, Comput. Phys. Commun. 203, 66
[56]   C. G. Durfee and H. M. Milchberg, Phys. Rev. Lett. 71,             (2016).
       2409 (1993).

                                                              101302-10
You can also read