Phase-Based Cortical Synchrony Is Affected by Prematurity
←
→
Page content transcription
If your browser does not render page correctly, please read the page content below
Cerebral Cortex, 2022;32: 2265–2276

                                                                               https://doi.org/10.1093/cercor/bhab357
                                                                               Advance Access Publication Date: 20 October 2021
                                                                               Original Article

                                                                                                                                                         Downloaded from https://academic.oup.com/cercor/article/32/10/2265/6404050 by EVES-Escola Valenciana dÉstudis de la Salut user on 09 June 2022
ORIGINAL ARTICLE

Phase-Based Cortical Synchrony Is Affected by
Prematurity
Pauliina Yrjölä 1,2,3 , Susanna Stjerna 1,3,4 , J. Matias Palva                                                            2,3,5 ,

Sampsa Vanhatalo 1,3,† and Anton Tokariev 1,3,†
1 Department  of Clinical Neurophysiology, BABA Center, Children’s Hospital, Helsinki University Hospital and
University of Helsinki, Helsinki, 00029 HUS, Finland, 2 Department of Neuroscience and Biomedical
Engineering, Aalto University, Helsinki, 00076 AALTO, Finland, 3 Neuroscience Center, Helsinki Institute of Life
Science, University of Helsinki, 00014 Helsinki, Finland, 4 Division of Neuropsychology, HUS Neurocenter,
Helsinki University Hospital and University of Helsinki, PL 340, 00029 HUS, Finland and 5 Centre for Cognitive
Neuroimaging, Institute of Neuroscience and Psychology, University of Glasgow, Glasgow G12 8QB, UK
Address correspondence to Pauliina Yrjölä, BABA center, Children’s Hospital, Helsinki University Hospital, P.O. Box 281, Stenbäckinkatu 11, 00029 HUS,
Helsinki, Finland. Email: pauliina.yrjola@aalto.fi; Anton Tokariev. Email: anton.tokariev@helsinki.fi
† Sampsa   Vanhatalo and Anton Tokariev contributed equally.

Abstract
Inter-areal synchronization by phase–phase correlations (PPCs) of cortical oscillations mediates many higher
neurocognitive functions, which are often affected by prematurity, a globally prominent neurodevelopmental risk factor.
Here, we used electroencephalography to examine brain-wide cortical PPC networks at term-equivalent age, comparing
human infants after early prematurity to a cohort of healthy controls. We found that prematurity affected these networks
in a sleep state-specific manner, and the differences between groups were also frequency-selective, involving brain-wide
connections. The strength of synchronization in these networks was predictive of clinical outcomes in the preterm infants.
These findings show that prematurity affects PPC networks in a clinically significant manner, suggesting early functional
biomarkers of later neurodevelopmental compromise that may be used in clinical or translational studies after early
neonatal adversity.
Key words: brain networks, neonatal EEG, neurodevelopment, phase coupling, preterm infant

Introduction                                                                   ex utero. This time window is known to be characterized by the
Approximately 10% of infants are born preterm, which inflicts                  growth of brain networks driven by a combination of genetic
lifelong disabilities in many key brain functions, including                   and activity-dependent mechanisms (Luhmann et al. 2016; Mol-
vision, learning, and language processing (WHO 2012; Johnson                   nár et al. 2020). The early cortical activity can be recorded
and Marlow 2017). Many of these functional abnormalities arise                 with scalp electroencephalography (EEG) and consists of spon-
from the impacts that prematurity has on neuronal networks.                    taneous intermittent bursts, which provide an early mecha-
Recent studies have demonstrated both structural (Batalle                      nism for inter-areal temporal correlations and define functional
et al. 2017; Guo et al. 2017) and functional (Tóth et al. 2017;                cortical networks (Vanhatalo and Kaila 2006). Therefore, the
Tokariev, Roberts, et al. 2019a; Tokariev, Stjerna, et al. 2019b)              early cortical activity is a driver, guide, and biomarker of the
effects of prematurity, some of which are shown to predict later               development of brain networks.
neurodevelopmental outcomes.                                                      The functional cortical networks can be characterized
    Prematurity implies that the infants spend a part or all of                by quantifying relationships between phase or amplitude
their third trimester of gestation in an unnatural environment,                attributes of neural signals from distinct brain regions. Prior

© The Author(s) 2021. Published by Oxford University Press.
This is an Open Access article distributed under the terms of the Creative Commons Attribution License (http://creativecommons.org/licenses/by/4.0/),
which permits unrestricted reuse, distribution, and reproduction in any medium, provided the original work is properly cited.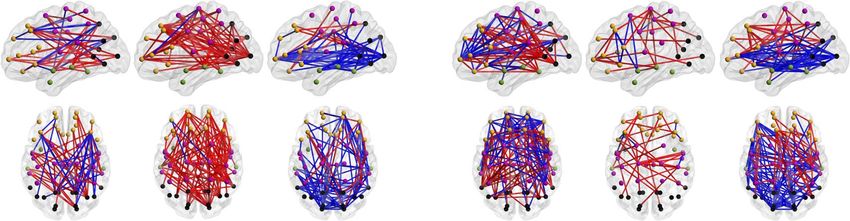
2266      Cerebral Cortex, 2022, Vol. 32, No. 10

research on neonatal EEG (Omidvarnia et al. 2014; Tokariev,             electrodes (ANT-Neuro, Berlin, Germany) located according to
Roberts, et al. 2019a; Tokariev, Stjerna, et al. 2019b) have often      International 10-20 standard layout. Signals from both groups
focused on the amplitude–amplitude correlations that reflect            were recorded mostly with the NicOne EEG amplifier (Cardi-
co-modulation of overall neuronal activity and gross cortical           nal Healthcare, Ohio/Natus, Pleasanton, USA), but few EP sub-
excitability over periods of seconds (Palva and Palva 2011; Hipp        jects were recorded with the Cognitrace amplifier (ANT B.V.,
et al. 2012; Engel et al. 2013; Tewarie et al. 2019). The other         Enschede, the Netherlands). EEG recordings for both groups were
                                                                        performed at term-equivalent age of 41.4 ± 1.4 weeks CA (con-

                                                                                                                                                 Downloaded from https://academic.oup.com/cercor/article/32/10/2265/6404050 by EVES-Escola Valenciana dÉstudis de la Salut user on 09 June 2022
commonly used measure of neuronal interactions is phase–
phase correlation (PPC) that is considered to reflect a spatiotem-      ceptional age, mean +/− SD). The original sampling frequency
porally accurate mechanism of inter-areal communication.                was 256 Hz or 500 Hz, but all data were resampled to 250 Hz
PPC is thought to arise from subsecond timing relationships             when exporting them into European Data Format.
in neuronal spiking (Womelsdorf et al. 2007; Palva and Palva
2011; Vidaurre et al. 2018), hence being able to support dynamic
                                                                        Clinical Assessments
integration in neuronal ensembles underlying several higher-
level brain functions (Bressler and Menon 2010; Palva and Palva         Newborn neurological assessments (Hammersmith Neonatal
2011). Moreover, it is now well known that the brain operates           Neurological Examination [HNNE]; Dubowitz et al. 1999) were
concurrently at multiple frequencies, giving rise to multiplex          conducted on the EP and HC cohorts at term-equivalent age
networks shaped by concerted actions of different coupling              to quantify the infants’ neurodevelopment. The HNNE was
mechanisms in several frequency bands (De Domenico et al.               selected due to its wide use in assessment of neurological
2016; Siebenhühner et al. 2016).                                        behavior in multiple populations (Romeo et al. 2011; Venkata
   Recent studies have suggested that PPC networks link to              et al. 2020). The test comprises 6 separate domains of neurode-
neurological performance (Tokariev, Stjerna, et al. 2019b) and          velopment: reflexes, movements, posture tonus, tone patterns,
early brain maturation (Gonzàlez et al. 2011; Van de Pol et al.         abnormal signs, and orientation and behavior. To render the
2018). However, the spatial and spectral extent of these findings,      outcomes suitable for studying associations with PPC networks,
as well as their clinical correlates, have remained unclear. Here,      we performed dimensionality reduction by principal component
we aimed to assess how the large-scale cortical PPC networks            analysis (PCA) as described earlier (Tokariev, Stjerna, et al. 2019b).
are affected by preterm birth of human infants. We analyzed             PCA generates uncorrelated linear combinations of the input
EEG recordings from a large cohort of preterm and healthy               data, that is, principal components, by maximizing variance. We
control (HC) infants using an infant-specific source modeling-          applied PCA to 3 individual tests (visual alertness, head raising
based analysis pipeline that allows noninvasive assessment of           in prone, and increased neck extensor tone), and then used
functional networks at the level of cortical sources. We asked          first 2 components (C1 and C2, respectively) as combination
whether prematurity leads to changes in the cortical networks           scores. In the post hoc assessment, the resulting C1 was shown
that are linked to sleep state, brain area, or oscillation frequency.   to correlate primarily with later motor performance (hereafter
Moreover, we wanted to study if prematurity-related changes             called “motor score”), whereas C2 was found to be associated
in cortical networks would have clinical significance, that is, be      with later cognitive and social performance (hereafter called
predictive of clinical neurological performance of the infants by       “cognitive score”) (Tokariev, Stjerna, et al. 2019b). Higher scores
the time of recording and/or later during childhood.                    represent higher cognitive/motor function.
                                                                            Long-term neurocognitive follow-up assessment was per-
                                                                        formed only on the EP infants at 2 years of age, using Bay-
Materials and Methods                                                   ley Scales of Infant and Toddler Development (Bayley 2006)
The overall analytical flow is shown in Figure 1 and described in       and the Griffiths Mental Developmental Scales (Huntley 1996).
detail in the following.                                                The neuropsychological follow-up data were not available for
                                                                        the HC infants. These neurocognitive assessment tests were
                                                                        chosen, because of their established, widespread clinical use
Subjects                                                                plus a broad impact on lifelong neurocognitive performance
The dataset included N = 46 early preterm (EP) and N = 67 healthy       and quality of life, hence supporting the translational potential
controls (HC) infants. The gestational ages (GA) of the EP group        of findings (Rogers and Hintz 2016; Hernandez 2018). While
(mean +/− standard deviation, SD) were 26.4 +/− 1.2 weeks and           some other outcomes such as gross motor development or
those of the HC group were 40.4 +/− 1.1 weeks. This dataset             hearing may be sometimes affected in EP infants, prior stud-
was collated from cohorts that have been published in previous          ies have suggested that these are most likely modified by a
studies (Rahkonen et al. 2013; Omidvarnia et al. 2014; Nevalainen       host of individual and treatment interventions (Kilbride et al.
et al. 2015; Tokariev, Videman, et al. 2016b; Leikos et al. 2019;       2018). As above, high scoring reflects higher neurocognitive
Tokariev, Roberts, et al. 2019a; Tokariev, Stjerna, et al. 2019b).      performance.
The study design was approved by the Ethics Committee of the
Helsinki University Central Hospital and informed consent was
                                                                        EEG Review and Preprocessing
obtained from a parent or guardian for each subject.
                                                                        Vigilance state assessment was performed through a combina-
                                                                        tion of electrophysiological and behavioral measures, the latter
EEG Recordings
                                                                        observed using polygraphic channels (chin electromyogram,
Multichannel scalp EEG data were collected from both infant             electrocardiogram, electrooculogram, and respiratory sensors;
groups during day sleep. The requirement for the recording              see also Omidvarnia et al. 2014, Tokariev, Roberts, et al. 2019a,
session was that each subject had to undergo 2 vigilance states:        Tokariev, Stjerna, et al. 2019b). EEG traces during AS exhibit
active sleep (AS) and quiet sleep (QS). EEG registration was            continuous fluctuations, with an irregular respiration and
performed using Waveguard caps with 19-28 sintered Ag/AgCl              occasional eye movements. Conversely, EEG during QS is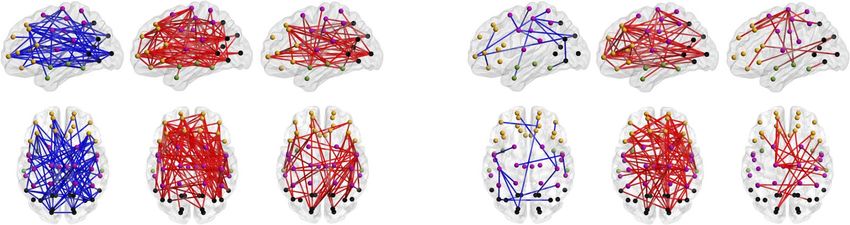
Phase-based Cortical Synchrony in Preterm Infants                     Yrjölä et al.           2267

                                                                                                                                                                           Downloaded from https://academic.oup.com/cercor/article/32/10/2265/6404050 by EVES-Escola Valenciana dÉstudis de la Salut user on 09 June 2022
Figure 1. Outline of the study design and analyses. (a) EEG recordings of day-time sleep were acquired from EP and HC cohorts. The recordings were classified into
AS and QS, and 5-min-long epochs were constructed for both sleep states. The selected epochs were filtered into 21 narrow frequency bands of semi-equal length
on a logarithmic scale and converted to cortical source signals applying a realistic infant head model with 58 cortical parcels. Functional connectivity analysis was
applied on the parcel signals by computing PPCs with the debiased weighted phase-lag index, yielding subject-specific adjacency matrices for both sleep states and
all frequency bands. (b) Statistical group differences in connectivity strength were computed (Wilcoxon rank sum test) for both sleep states and each frequency band.
The fraction of edges portraying significant differences (extent K) for 2 contrasts EP > HC (red) and EP < HC (blue) and the spatial distribution of the edges were then
visualized. (c) Finally, correlations of PPC strengths to newborn neurological and 2-year neurocognitive assessment scores were investigated (Spearman correlation).
The extent of edges with significant correlation between PPC and clinical outcomes (K) was computed and the spatial distribution of these edges visualized.

characteristically discontinuous, with a regular respiration                           forward–backward directions to compensate for phase delays
(André et al. 2010). We then selected 5-min long artifact-free                         introduced by infinite impulse response filters. Next, the
EEG epochs from representative periods of AS and QS. To avoid                          EEG data were downsampled to a new sampling frequency,
transition periods between vigilance states, representative sleep                      Fs = 100 Hz, and converted into average montage. Following
epochs were selected from within well-established patterns                             our previous work (Tokariev, Roberts, et al. 2019a), we filtered
of corresponding behavior and brain activity. Epochs that did                          the preprocessed EEG into 21 frequency bands of interest
not meet quality and length requirements were excluded from                            covering the physiologically relevant range 0.4–22 Hz (Vanhatalo
the data pool. As a result, we obtained 4 final groups: EP-AS                          et al. 2005). This narrow band approach was opted to allow
(N = 46), HC-AS (N = 53), EP-QS (N = 42), and HC-QS (N = 66). For                      sensitive scanning through the frequency domain and thereby
each subject, we selected the same N = 19 channels (Fp1, Fp2,                          capture networks that may not fall within predefined frequency
F7, F3, Fz, F4, F8, T7, C3, Cz, C4, T8, P7, P3, Pz, P4, P8, O1, O2) to                 bands. Band-pass filtering was implemented with pairs of
enable group-level analysis. All EEG signals were first prefiltered                    low- and high-pass filters. The first central frequency (Fc) was
within the 0.15–45 Hz frequency range using a combination of                           set to 0.5 Hz and subsequent frequencies were computed as
high- and low-pass Butterworth filters of the seventh order.                           Fc(i) = 1.2 × Fc(i−1), where i is the number of the frequency
All filtering in this work were implemented offline and in                             band. Cut-off frequencies for each band were taken as 0.85 × Fc
2268      Cerebral Cortex, 2022, Vol. 32, No. 10

and 1.15 × Fc correspondingly. This approach leads to 50%            connections and computed the ratio (K) of edges which were
overlapping frequency bands of semi-equal width in the               significantly different between the cohorts (Palva et al. 2010).
logarithmic scale.                                                   To estimate the potential number of false discoveries in the
                                                                     frequency-specific group contrasts, we employed the Storey–
                                                                     Tibshirani adaptive FDR method using q = 0.01 with respect to
Computation of Cortical Signals
                                                                     the size of the whole network (i.e., up to N = 1128 × 0.01 = 11

                                                                                                                                            Downloaded from https://academic.oup.com/cercor/article/32/10/2265/6404050 by EVES-Escola Valenciana dÉstudis de la Salut user on 09 June 2022
Band-pass filtered EEG was further source reconstructed to           connections in each network were classified as potential false
allow better spatial separation of cortical activities using a       discoveries), (Storey and Tibshirani 2003; Puoliväli et al. 2020).
realistic infant head model (Tokariev, Stjerna, et al. 2019b)        Effect size for the significantly different patterns was computed
and dynamic statistical parametric mapping (Dale et al. 2000).       as a module of the mean of rank-biserial correlation values
Theoretically, source reconstruction could be marginally more        for corresponding connections. The influence of age differences
accurate by using individual head models based on individual         on network strength was investigated by correlating the global
magnetic resonance imaging (MRI) images taken near the time          mean connectivity strength with age for each group per fre-
of EEG recording, especially in the preterm infants where brain      quency and sleep state (Spearman correlation, two-tailed test,
structure might somewhat deviate from an average population.         α-level 0.05). P-values of both sleep states were pooled together
This would also need digitization of the EEG coordinates in          separately for each group and controlled for multiple compar-
each recorded individual. However, obtaining such MRI data and       isons by the Benjamini–Hochberg procedure (Benjamini and
electrode digitizations is not technically or ethically possible     Hochberg 1995).
in human infants, hence we opted to use the common MRI                   Parallel to the primary analysis, a cross-check for statis-
template from one infant as the average head model. As the           tical group comparison was performed using network-based
source space, we used normal to cortical surface (at term age)       statistics (NBS) (Zalesky et al. 2010) separately for the 21 fre-
dipoles of fixed orientation (N = 8014). The scalp and inner/outer   quency bands and 2 sleep states using 2 one-tailed tests (EP > HC
skull shells were segmented from MRI data from healthy full-         and EP < HC). NBS is a multiple comparisons method designed
term infant. Following previous studies (Despotovic et al. 2013;     specifically for network analysis. It assumes that connections
Odabaee et al. 2014; Tokariev, Vanhatalo, et al. 2016a), tissue      reflecting true effects are interconnected into networks encom-
conductivities were set to: 0.43 S/m for scalp, 1.79 S/m for         passing more than a single connection. The connected compo-
intracranial volume, and 0.2 S/m for skull. Finally, cortical        nents are defined in a topological space, in contrary to other
sources were clustered into N = 58 parcels according to the          cluster-based methods, which use a physical space (Genovese
scheme optimized for infant EEG. Cortical signals representing       et al. 2002; Zalesky et al. 2010). The initial threshold for the t-
neural activity of each parcel were computed as the weighted         statistic was set to 2.5, followed by the post hoc permutation
mean of source signals belonging to the host parcels (Tokariev,      test to correct the family-wise error rate (5000 permutations,
Stjerna, et al. 2019b).                                              α = 0.05).

Computation of Functional Connectivity                               Clinical Correlation
To estimate functional connectivity, we computed PPCs between        The connectivity strength of each edge across the infant group
all pairs of parcels using the debiased weighted phase-lag index,    was correlated with the corresponding standardized neurolog-
(Vinck et al. 2011). We opted to use this metric because of          ical assessments at term-equivalent age and with the corre-
its robustness to artificial interactions caused by volume con-      sponding neurocognitive performance scores at 2 years of age
duction (Palva and Palva 2012; Palva et al. 2018). Connectivity      (Spearman, two-tailed test with α-level 0.05) with CA as a covari-
was estimated using whole 5-min-long epochs, at 21 frequency         ate. We computed the fraction of edges showing significant
bands and for both vigilance states (AS and QS). This led to a       clinical correlation (K) for each frequency band and sleep state.
set of 58 × 58 PPC matrices for each subject, accumulating to        Only the EP cohort had performance scores tested at 2 years
a total of 1653 pairwise connections. Then, we assessed how          of age. Some subjects had missing clinical scores, rendering
reliably the PPC interaction can be captured in each individual      the number of subjects used for each correlation to: C1: EP-AS
parcel pair. This was done by forward/inverse simulations as         (N = 39), EP-QS (N = 36), HC-AS (N = 30), HC-QS (N = 51); C2: EP-
detailed before (Tokariev, Stjerna, et al. 2019b). The EEG-derived   AS (N = 39), EP-QS (N = 36), HC-AS (N = 40), HC-QS (N = 51); Grif-
connectivity matrices were corrected with a binary “fidelity”        fiths Visual: EP-AS (N = 35), EP-QS (N = 32); Griffiths Motor: EP-
mask, which defines the reliable connections when using the          AS (N = 39), EP-QS (N = 36); Bayley Cognitive: EP-AS (N = 32), EP-QS
given electrode layout. This procedure aims to improve the           (N = 30); Bayley Language comprehension: EP-AS (N = 30), EP-QS
reliability of cortical-level network estimation from a subop-       (N = 28). Multiple comparisons correction was implemented with
timal number of recording electrodes, which are usually used         the Storey–Tibshirani adaptive FDR with q = 0.05 (i.e., 2.5% of the
in clinical recordings as discussed in Tokariev, Vanhatalo, et al.   positive and negative correlations separately were classified as
(2016a).                                                             potential false discoveries). The Spearman ρ-value was used for
                                                                     estimating effect size: It was computed for all significant edges
                                                                     and averaged across the full network.
Network Analysis
To test network differences between EP and HC cohorts, we
                                                                     Analysis Software
applied the Wilcoxon rank sum test (2 one-tailed tests, α = 0.01)
in an edge-by-edge manner with defined directions (EP > HC and       Source reconstruction was conducted using the Brainstorm
EP < HC). This was done for each frequency band and for each         (Tadel et al. 2011; https://neuroimage.usc.edu/brainstorm/Intro
sleep state separately. As a result of such edgewise scanning,       duction) and the openMEEG (Gramfort et al. 2010; https://ope
we obtained matrices of P-values corresponding to the network        nmeeg.github.io/) software packages. Analyses were performed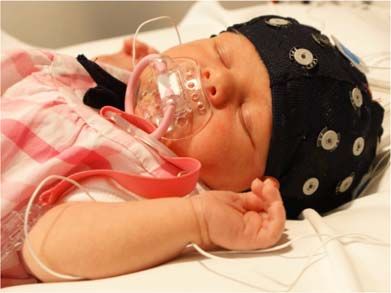
Phase-based Cortical Synchrony in Preterm Infants Yrjölä et al. 2269
Downloaded from https://academic.oup.com/cercor/article/32/10/2265/6404050 by EVES-Escola Valenciana dÉstudis de la Salut user on 09 June 2022
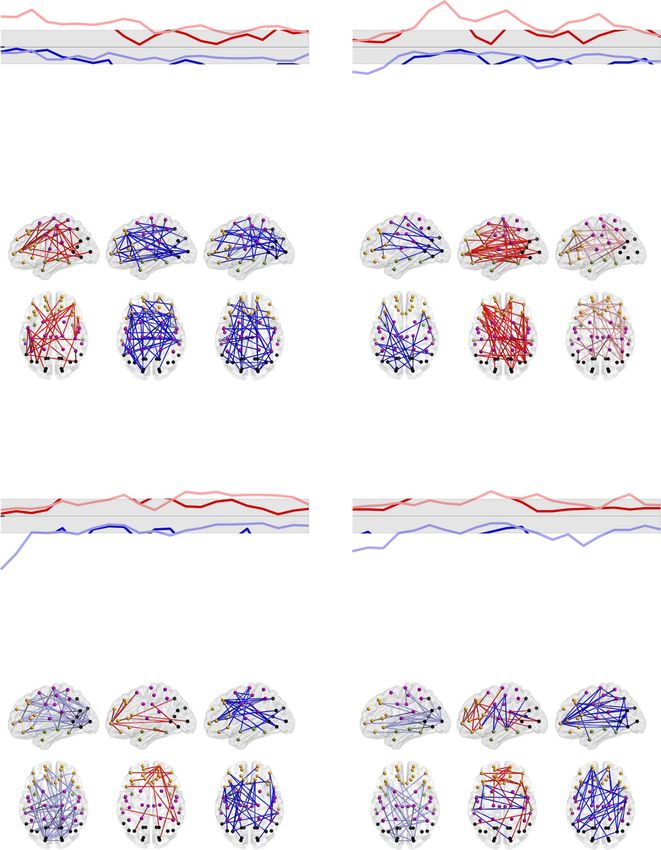
Figure 2. Effects of prematurity on cortical PPC networks. (a) Network density (K) of significant PPC group differences (2 one-tailed Wilcoxon rank-sum tests, α = 0.01)
during AS (left) and QS (right) as a function of frequency. Networks that are stronger in EP (EP > HC) are shown in red, whereas networks with suppressed connectivity in
EP (EP < HC) are presented in blue. The gray shaded area depicts the boundaries of the q-level showing the potential level of false discoveries (q = 0.01). The data presented
in the figure are provided in Figure 2—source data 1 and matrices of the P-values and effect sizes of all networks in Figure 2—source data 2. (b) Spatial visualizations
present PPC network comparisons at the frequencies with the most extensive group differences. The color coding of the networks (red, blue) corresponds to that of (a).
with Matlab R2020a (MathWorks, Natick, MA) and NBS Connec- of the network with increased (1.8–3.1 Hz) and decreased (1.5–
tome (Zalesky et al. 2010), (https://www.nitrc.org/projects/nbs/), 4.5 Hz) connectivity strengths in the EP infants. During QS, the
and the visualization of brain networks was carried out with most prominent group differences were within the delta band:
BrainNet Viewer (Xia et al. 2013; https://www.nitrc.org/projects/ The EP infants exhibited stronger connectivity (K = 10% at 1.8 Hz,
bnv/). P < 0.01, q = 0.01) in mostly long-range inter-areal connections,
The Matlab script implementing the network analyses of while there were weaker short-range connections (K = 8% at
group differences and clinical correlation can be found at 1.2 Hz, P < 0.01, q = 0.01) within the frontal lobe and a few projec-
https://github.com/pauliina-yrjola/Preterm-Phase. tions to the parietal and occipital lobes. Networks at alpha and
beta frequencies were suppressed in the EP infants during both
Results sleep states, and they involved dense basal connections linking
occipital cortices to frontal and temporal areas. All findings were
PPC Networks Are Affected by Prematurity characterized by gradual changes relative to frequency band, as
in a Frequency-Specific Manner shown in Figure 2—figure supplement 1.
To evaluate the impact of prematurity on cortical networks as The possible systematic effect of age on PPC values was
a function of frequency, we estimated the extent of significant checked, yet no significant correlations were found between
PPC network differences between EP and HC groups at each spe- mean connectivity strength and age at any frequency (Spear-
cific frequency. We described the extent of patterns reflecting man, two-tailed test, α = 0.05, Benjamini–Hochberg correction).
group differences as a fraction (K) and visualized the spatial Effect sizes, computed by the rank-biserial correlation over each
distribution of these patterns (Fig. 2). significant network, are presented in Figure 2—figure supple-
We found broad sleep- and frequency-specific differences in ment 2. We also validated the results with an alternative analysis
PPC networks between EP and HC infants (Fig. 2). During AS, using NBS (Zalesky et al. 2010), with 2 one-tailed tests (for details,
the most extensive group differences were observed within the see Methods), and found similar spectral and spatial patterns in
theta frequency band (peak at Fc = 5.3 Hz; Fig. 2a) with stronger group comparisons (Figure 2—figure supplement 3). The find-
connections in the EP group (K = 10%, P < 0.01, q = 0.01) that were ings together suggest that exposure to prematurity affects the
uniformly distributed over the whole cortex (Fig. 2b). Smaller organization of cortical PPC networks at multiple oscillatory
subnetworks (K = 2–4%, P < 0.01, q = 0.01) over multiple cortical frequencies, yet the target network is highly dependent on
regions were found at delta frequencies, showing different edges frequency.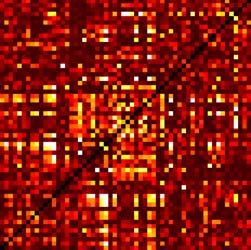
2270      Cerebral Cortex, 2022, Vol. 32, No. 10

Connectivity Strength Correlates with Neurological                       correlation to motor scores during both sleep states at the lowest
Performance in Preterm Infants                                           frequencies (Fc = 0.5, 0.6 Hz; K = 4%, P < 0.05, q = 0.05).
                                                                             The cognitive performance score showed negative correla-
Next, we studied how the strength of cortical PPC networks
                                                                         tions at low (AS and QS; Fc = 0.5 Hz; K = 5–8%, P < 0.05, q = 0.05)
correlates to neurological performance at the time of new-
                                                                         and high frequencies (AS only; Fc = 16 Hz; K = 6%, P < 0.05,
born EEG recordings. To this end, we correlated the connectivity
                                                                         q = 0.05). A few connections displayed positive correlations with
strengths of each PPC network connection (N = 1128) of the EP

                                                                                                                                                    Downloaded from https://academic.oup.com/cercor/article/32/10/2265/6404050 by EVES-Escola Valenciana dÉstudis de la Salut user on 09 June 2022
                                                                         cognitive performance during AS at Fc = 1.8 Hz (K = 4%, P < 0.05,
group to the neurological performance of the corresponding
                                                                         q = 0.05), linking frontal nodes to other regions.
infants, assessed using compound scores which are associ-
                                                                             Language comprehension correlated to PPC networks in AS
ated with later motor and cognitive outcomes (Tokariev, Stjerna,
                                                                         (peak at Fc = 1.8 Hz, K = 5%, P < 0.05, q = 0.05), involving connec-
et al. 2019b). We quantified the extent of significantly correlated
                                                                         tions between frontal and temporal regions. A negative correla-
connections using a density measure (K) and visualized the
                                                                         tion between PPC strength and language comprehension scores
networks showing broad spatial effects (Fig. 3).
                                                                         was present in long-range connections at lower frequencies
    The cognitive score was positively correlated with an
                                                                         during QS (Fc = 0.5 Hz, K = 5%, P < 0.05, q = 0.05), as well as a brain-
extensive pattern at higher delta frequencies in both sleep states
                                                                         wide network at mid-frequencies during AS (Fc = 7.7 Hz, K = 4%,
(AS: 1.2–4.5 Hz, K = 5–14%, QS: 1.2–3.1 Hz, K = 6–10%, P < 0.05,
                                                                         P < 0.05, q = 0.05).
q = 0.05). The corresponding spatial patterns incorporated broad
                                                                             Effect sizes were computed as the mean of Spearman ρ of
networks linking multiple distal areas. In contrast, the motor
                                                                         the positive and negative networks separately and are presented
score showed only mildly elevated density, or small networks,
                                                                         as a function of frequency in Figure 4—figure supplement 1.
with positive correlation at 2.6–4.5 Hz during AS (K = 4–8%,
                                                                         The spatial distributions at all investigated frequency ranges are
P < 0.05, q = 0.05) and a negative correlation at 1.5–1.8 Hz during
                                                                         shown in Figure 4—figure supplement 2–5. A summary of the
QS (K = 5–6%, P < 0.05, q = 0.05). Effect sizes (mean of Spearman ρ
                                                                         most prominent correlations is presented in Figure 5.
over the positive and negative correlation networks separately)
are depicted in Figure 3—figure supplement 1. A comparable
analysis for HCs (Figure 3—figure supplement 2) showed                   Discussion
only a few negative correlations between edge strength and
                                                                         Our study shows that spontaneous cortical activity in the
neurological scores. The spatial distributions for all investigated
                                                                         human infants exhibits large-scale PPC structures, which are
frequency bands are presented in Figure 3—figure supplement
                                                                         spectrally and spatially selective and co-vary with vigilance
3 for the motor score and Figure 3—figure supplement 4 for the
                                                                         states. Moreover, we show that the globally most significant
cognitive score.
                                                                         clinical risk factor, preterm birth (WHO 2012), leads to frequency-
    These findings together suggest that the relationship
                                                                         selective changes in these networks and that the newborn
between cortical networks and neurological performance is
                                                                         networks of ex-preterm infants also correlate to neurocognitive
affected by prematurity. The EP infants exhibit brain-wide
                                                                         performance. Our work employed novel realistic cortical source
relationships between cortical networks and neurological
                                                                         reconstruction and independent parallel analyses to validate the
performance, which is not seen in the HC infants.
                                                                         results on clinical network correlations. Our findings are broadly
                                                                         consistent with recent work on adults showing that multiple
                                                                         frequency-specific PPC networks coexist (De Domenico et al.
Correlation of Functional Connectivity
                                                                         2016; Siebenhühner et al. 2016; Yu et al. 2017; Vidaurre et al.
and Neurological Performance Extends
                                                                         2018) and correlate with normal and pathological behaviors
to Long-Term Neurocognitive Outcomes                                     (Siebenhühner et al. 2016; Yu et al. 2017). Our work extends
Finally, we examined the relation of PPC networks to long-term           prior studies reporting prematurity effects on the temporally
neurocognitive development, assessed at 2 years of age using             loose amplitude correlations (Omidvarnia et al. 2014; Tokariev,
standardized Bayley (Bayley 2006) and Griffiths (Huntley 1996)           Roberts, et al. 2019a); here, we provide evidence that the cortico-
scores. Akin to our analysis above on newborn clinical perfor-           cortical interactions in newborn infants are already accurate
mance, we correlated the strength of individual connections in           enough to give rise to spectrally and spatially specific PPC
the PPC networks of the EP infants to their clinical outcome             structures, and pathological effects therein.
measures at 2 years of age. Most of the significant correlations             It has recently become clear that brain function relies on
emerged for visual, motor, cognitive, and language comprehen-            several co-existing frequency-specific PPC networks, which are
sion scores at lower frequencies (Fig. 4), forming mostly spatially      reported to show temporal dynamics between awake states
constrained patterns.                                                    in adults (Siebenhühner et al. 2016; Vidaurre et al. 2018) or
   Visual scores correlated negatively with PPC during AS with           between sleep states in the neonatal studies (Tokariev, Videman,
peaks at Fc = 2.6 Hz and Fc = 7.7 Hz (K = 6–8%, P < 0.05, q = 0.05).     et al. 2016b; Tokariev, Stjerna, et al. 2019b). Here, we show that
The correlation networks incorporated multiple areas over the            medical adversities can affect these PPC networks in a selective
whole cortex. A small set of positively correlating connections          manner, at preferential frequencies, and with preferential
was found at Fc = 0.5 Hz during both sleep states (K = 5–6%,             spatial distributions, as well as differing between vigilance
P < 0.05, q = 0.05).                                                     states. For instance, prematurity caused an increase in middle
   Motor scores featured a prominent positive correlation dur-           frequency PPC in long-range connections throughout the brain,
ing both sleep states at Fc = 1.5 Hz (K = 7%, P < 0.05, q = 0.05) with   while the changes in higher frequencies were more localized in
a dense spatial distribution over several cortical regions. We           the middle and long-range connections in the basal brain areas.
also found a somewhat smaller extent network with a positive             These effects were more pronounced during AS for the middle
correlation to motor score during QS at a slightly higher fre-           frequencies, while high-frequency findings were essentially
quency (Fc = 3.1 Hz; K = 5%, P < 0.05, q = 0.05). Finally, a subset of   similar between sleep states. The findings are compatible with
mostly occipital interhemispheric connections showed negative            a notion that the functional significance of frequency-specific
Phase-based Cortical Synchrony in Preterm Infants                      Yrjölä et al.          2271

                                                                                                                                                                          Downloaded from https://academic.oup.com/cercor/article/32/10/2265/6404050 by EVES-Escola Valenciana dÉstudis de la Salut user on 09 June 2022
Figure 3. PPC networks of ex-preterm infants at term age predict neurological outcome. Density (K) of PPC patterns that associate to neurological scores linked to
later motor and cognitive performance (Spearman, two-tailed test with CA as a covariate, α = 0.05) as a function of frequency. The gray shaded area depicts the FDR
boundaries (q = 0.05). The opaque brains show the spatial distributions of networks taken at the most characteristic peaks of the density curves. Red coloring pictures
networks with positive correlation (ρ > 0), while blue coloring shows negatively correlated connections (ρ < 0) in both the graphs and 3-dimensional plots. The graph
data are provided in Figure 3—source data 1 and the full P-value and effect size matrices in Figure 3—source data 2.

PPC networks depends on their context, the brain state, in                            et al. 2017). The frontal involvement in many found PPC effects
addition to their given frequency. The previously described                           may be explained by the way how frontal regions develop late
diffuse and extensive white matter abnormalities after pre-                           (Mrzljak et al. 1992; Vasung et al. 2017) and establish their
maturity (Dimitrova et al. 2020) may provide a straightforward                        cortico-cortical pathways via the subcortical cross-roads, a
histological underpinning for the changes. Since PPC is known                         key site in early developmental brain insults (Judas et al. 2005;
to require high temporal precision in neuronal communication                          Vasung et al. 2010). The well-established transient emergence
(Womelsdorf et al. 2007; Palva and Palva 2012), any compromise                        of exuberant connections during early development (Kostović
in neuronal conduction velocities due to myelination changes                          et al. 2019; Innocenti 2020), followed by their later activity-
would readily explain the observed decrease in higher frequency                       dependent pruning, may offer a histological underpinning for
PPC networks. The major white matter tracts are presumably                            the observed higher PPC levels in the long-range connections
often affected (Kostović et al. 2014; Vasung et al. 2016; Vasung                     of the preterm infants. The high inter-individual variability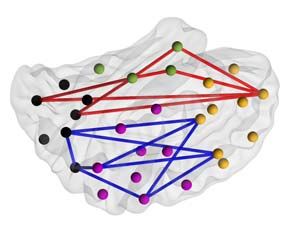
2272        Cerebral Cortex, 2022, Vol. 32, No. 10

                                                                                                                                                                              Downloaded from https://academic.oup.com/cercor/article/32/10/2265/6404050 by EVES-Escola Valenciana dÉstudis de la Salut user on 09 June 2022

Figure 4. Correlation of PPC network strength to 2-year neurocognition. The upper graphs show the frequency-wise summary of the proportion of network edges (K)
that show a significant correlation between PPC strength and the given neurocognitive performance score (Spearman, two-tailed test with CA as a covariate, α = 0.05).
The FDR (q = 0.05) boundaries are depicted as a gray shaded area. The strongest peaks in these plots were selected for the 3-dimensional visualizations of networks as
indicated with arrows. Color coding represents the sign of correlation (red: ρ > 0, blue ρ < 0) and hues represent sleep states (dark: AS, light: QS) in the graphs and the
spatial visualizations. The data displayed in the curves are provided in Figure 4—source data 1 and the P-value and effect size matrices from which the graphs were
created in Figure 4—source data 2.

of structural effects, however, does not allow an accurate                              (Zhang et al. 2021). A full understanding of the present findings
prediction of the spatial topography in the EEG-based network                           would require combining the known structural connectome
change. It is also commonly observed that the network changes                           (Kostović et al. 2014; Vasung et al. 2016; Vasung et al. 2011) to
may be more diffuse than their associated structural changes                            the spatially and spectrally selective PPC network topologies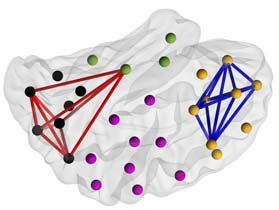
Phase-based Cortical Synchrony in Preterm Infants           Yrjölä et al.       2273

                                                                                       not found in the group of HC infants. That observation sug-
                                                                                       gests an altered relationship between PPC networks and neu-
                                                                                       rocognitive phenotypes in prematurely born infants, which calls
                                                                                       for a reasonable mechanistic explanation. It is possible that
                                                                                       the network–phenotype relationship becomes amplified in the
                                                                                       preterm cohort that is known to exhibit considerable variation

                                                                                                                                                             Downloaded from https://academic.oup.com/cercor/article/32/10/2265/6404050 by EVES-Escola Valenciana dÉstudis de la Salut user on 09 June 2022
                                                                                       in their histological maturation (Dimitrova et al. 2020). Prior
                                                                                       studies have shown brain-wide effects of prematurity on the
                                                                                       histological structures of white matter tracts (Dimitrova et al.
                                                                                       2020; Kostović et al. 2014; Vasung et al. 2016; Vasung et al.
                                                                                       2011), and these changes were shown to correlate with several
                                                                                       characteristics of newborn or later neurocognitive performance
                                                                                       (Stjerna et al. 2015; Vollmer et al. 2017; Girault et al. 2019;
                                                                                       Toulmin et al. 2020). An alternative mechanism is that the effects
                                                                                       found in EP infants reflect a transient network immaturity (a.k.a.
                                                                                       dysmaturity, Lombroso 1979; Tharp 1990) that would catch up
                                                                                       during later development. Testing this hypothesis would need
                                                                                       repeated EEG network studies in the EP infants near term-
                                                                                       equivalent age, as well as a relevant control group, to show a
                                                                                       developmental catch up in the PPC networks (Tokariev, Videman,
Figure 5. Summary of main correlations. The graphs show a summary of network           et al. 2016b) or in other functional brain age (Stevenson et al.
density (K) at each frequency for correlations to outcome measures at term-            2020).
equivalent age (TEA) and 2 years of age (Spearman, two-tailed test with CA as              The present results suggest a clinically meaningful effect
a covariate, α = 0.05). Positive correlations (ρ > 0) are shown in shades of red and
                                                                                       on PPC networks that could potentially serve as a functional
negative correlations (ρ < 0) in shades of blue. K is thresholded at 5% to highlight
                                                                                       biomarker to benchmark early therapeutic interventions (Ewen
the most salient correlations. The data presented in the figure are provided in
Figure 5—source data 1.                                                                et al. 2019; Sahin et al. 2020). Such biomarkers could be
                                                                                       constructed from, for example, the strength of coupling in
                                                                                       the frequency-specific subnetworks identified in our work. Our
described in our work. Recent work in adults has suggested                             current study needs to be considered as observational work that
that functional and structural networks may share common                               identified putative analysis pipelines and network markers.
skeletons (Finger et al. 2016; Mostame and Sadaghiani, 2020).                          Future prospective studies on larger cohorts are needed to
The high dimensionality in the newborn EEG-based network                               reduce the complexity of analytic procedures and to validate
data, however, precludes a straightforward combination with                            the consistency of findings. Our sample size estimation, based
anatomical connectome templates.                                                       on the effect sizes observed in this work, suggests that a cohort
    Our present findings extend the long-held clinical tradition                       of 113 infants is required for such a study (α = 0.05, β = 0.1, see
where QS is considered to be the most sensitive state in                               Hulley et al. 2013). Such work would also define the perceived
disclosing effects of prematurity in the EEG records. In                               added value of network assessment from the perspective
the clinical visual review, the EEG signal is considered to                            of monitoring early neurodevelopment and benchmarking
exhibit dysmature/immature features (Lombroso 1979; Tharp                              early therapeutic interventions. In addition, these network
1990), and the most robust feature is augmented “inter-                                effects may offer a unique translational bridge as a functional
hemispheric asynchrony,” or temporal nonoverlap between                                benchmark between preclinical models of prematurity and the
cortical bursting (Räsänen et al. 2013; Koolen et al. 2014).                           human preterm infants.
While the clinically perceived interhemispheric asynchrony
considers QS and amplitude correlations only, here we show
that robust prematurity effects are also seen in the PPC                               Supplementary Material
networks, and they are clear during AS. Moreover, the func-                            Supplementary material can be found at Cerebral Cortex online.
tional significance of the PPC network during AS is shown
by their pronounced correlations to subject-level clinical
performance.                                                                           Notes
    The strength of PPC connectivity in several brain-wide
subnetworks was found to correlate to infants’ neurological                            We want to thank the infants’ parents and research nurses
performance at term age, which extends prior reports on                                for participation and technical assistance in the study. Dr
clinical correlations to frontally connected delta frequency                           Aulikki Lano, Dr Marjo Metsäranta and Prof. Sture Andersson
networks (Tokariev, Stjerna, et al. 2019b). Clinical correlations                      are acknowledged for their efforts in the previously published
were clearly widest for the composite score, which emphasizes                          study cohorts that provided some data to this work. Conflict of
features of newborn performance that preempt later cognitive                           Interest: None declared.
development (Tokariev, Stjerna, et al. 2019b). Comparison
to neurocognitive performance at 2 years of age showed
also several albeit smaller PPC subnetworks with significant
                                                                                       Funding
correlations.                                                                          Finnish Pediatric Foundation, the Finnish Academy (313242,
    While our findings suggest clinically meaningful functions                         288220, 321235), Juselius Foundation, Aivosäätiö, Neuroscience
for the herein characterized PPC networks in the EP infants, it                        Center at University of Helsinki, and Helsinki University Central
was somewhat unexpected that comparable correlations were                              Hospital.
2274      Cerebral Cortex, 2022, Vol. 32, No. 10

References                                                             Gramfort A, Papadopoulo T, Olivi E, Clerc M. 2010. OpenMEEG:
                                                                          Opensource software for quasistatic bioelectromagnetics.
André M, Lamblin M-D, d’Allest AM, Curzi-Dascalova L,
                                                                          Biomed Eng Online. 9(1):1–20.
   Moussalli-Salefranque F, Tich SNT, Vecchierini-Blineau M-F,
                                                                       Guo T, Duerden EG, Adams E, Chau V, Branson HM, Chakravarty
   Wallois F, Walls-Esquivel E, Plouin P. 2010. Electroencephalog-
                                                                          MM, Poskitt KJ, Synnes A, Grunau RE, Miller SP. 2017.
   raphy in premature and full-term infants. Developmental
                                                                          Quantitative assessment of white matter injury in
   features and glossary. Neurophysiol Clin. 40(2):59–124.

                                                                                                                                              Downloaded from https://academic.oup.com/cercor/article/32/10/2265/6404050 by EVES-Escola Valenciana dÉstudis de la Salut user on 09 June 2022
                                                                          preterm neonates: association with outcomes. Neurology.
Batalle D, Hughes EJ, Zhang H, Tournier J-D, Tusor N, Aljabar
                                                                          88(7):614–622.
   P, Wali L, Alexander DC, Hajnal JV, Nosarti C, et al. 2017.
                                                                       Hernandez AL. 2018. The impact of prematurity on social and
   Early development of structural networks and the impact of
                                                                          emotional development. Clin Perinatol. 45(3):547–555.
   prematurity on brain connectivity. NeuroImage. 149:379–392.
                                                                       Hipp J, Hawellek DJ, Corbetta M, Siegel M, Engel AK. 2012. Large-
Bayley N. 2006. Bayley scales of infant and toddler development. San
                                                                          scale cortical correlation structure of spontaneous oscillatory
   Antonio (TX): Harcourt Assessment.
                                                                          activity. Nat Neurosci. 15(6):884–890.
Benjamini Y, Hochberg Y. 1995. Controlling the false discovery
                                                                       Hulley SB, Cummings SR, Browner WS, Grady D, Newman TB.
   rate: a practical and powerful approach to multiple testing. J
                                                                          2013. Designing clinical research: an epidemiologic approach. 4th
   Royal Statist Soc B (Methodological). 57(1):289–300.
                                                                          ed. Philadelphia: Lippincott Williams & Wilkins. Appendix
Bressler S, Menon V. 2010. Large-scale brain networks in cog-
                                                                          6C, p. 79.
   nition: emerging methods and principles. Trends Cogn Sci.
                                                                       Huntley M. 1996. The Griffiths mental developmental scales man-
   14(6):277–290.
                                                                          ual from birth to two years. Thames, UK: Association for the
Dale A, Liu AK, Fischl BR, Buckner RL, Belliveau JW, Lewine JD,
                                                                          Research in Infant and Child Development.
   Halgren E. 2000. Dynamic statistical parametric mapping:
                                                                       Innocenti G. 2020. The target of exuberant projections in devel-
   combining fMRI and MEG for high-resolution imaging of
                                                                          opment. Cereb Cortex. 30(6):3820–3826.
   cortical activity. Neuron. 26(1):55–67.
                                                                       Judas M, Rados M, Jovanov-Milosevic N, Hrabac P, Stern-Padovan
De Domenico M, Granell C, Porter MA, Arenas A. 2016. The
                                                                          R, Kostovic I. 2005. Structural, immunocytochemical, and MR
   physics of spreading processes in multilayer networks. Nat
                                                                          imaging properties of periventricular crossroads of growing
   Phys. 12(10):901–906.
                                                                          cortical pathways in preterm infants. AJNR Am J Neuroradiol.
Despotovic I, Cherian PJ, de Vos M, Hallez H, Deburchgraeve W,
                                                                          26(10):2671–2684.
   Govaert P, Lequin M, Visser GH, Swarte RM, Vansteenkiste E,
                                                                       Johnson S, Marlow N. 2017. Early and long-term outcome of
   et al. 2013. Relationship of EEG sources of neonatal seizures
                                                                          infants born extremely preterm. Arch Dis Child. 102(1):97–102.
   to acute perinatal brain lesions seen on MRI: a pilot study.
                                                                       Kilbride H, Aylward GP, Carter B. 2018. What are we measuring as
   Hum Brain Mapp. 34(10):2402–2417.
                                                                          outcome? Looking beyond neurodevelopmental impairment.
Dimitrova R, Pietsch M, Christiaens D, Ciarrusta J, Wolfers T,
                                                                          Clin Perinatol. 45(3):467–484.
   Batalle D, Hughes E, Hutter J, Cordero-Grande L, Price AN,
                                                                       Koolen N, Dereymaeker A, Räsänen O, Jansen K, Vervisch J, Matic
   et al. 2020. Heterogeneity in brain microstructural develop-
                                                                          V, De Vos M, Van Huffel S, Naulaers G, Vanhatalo S. 2014.
   ment following preterm birth. Cereb Cortex. 30(9):4800–4810.
                                                                          Interhemispheric synchrony in the neonatal EEG revisited:
Dubowitz L, Dubowitz V, Mercuri E. 1999. The neurological assess-
                                                                          activation synchrony index as a promising classifier. Front
   ment of the preterm and full-term newborn infant. 2nd ed. Cam-
                                                                          Hum Neurosci. 8:1030.
   bridge, UK: Mac Keith Press.
                                                                       Kostović I, Sedmak G, Judas M. 2019. Neural histology and neu-
Engel A, Gerloff C, Hilgetag CC, Nolte G. 2013. Intrinsic coupling
                                                                          rogenesis of the human fetal and infant brain. NeuroImage.
   modes: multiscale interactions in ongoing brain activity.
                                                                          188:743–773.
   Neuron. 80(4):867–886.
                                                                       Kostović I, Kostović-Srzentić M, Benjak V, Jovanov-Milošević N,
Ewen J, Sweeney JA, Potter WZ. 2019. Conceptual, regulatory
                                                                          Radoš M. 2014. Developmental dynamics of radial vulnera-
   and strategic imperatives in the early days of EEG-based
                                                                          bility in the cerebral compartments in preterm infants and
   biomarker validation for neurodevelopmental disabilities.
                                                                          neonates. Front Neurol. 5:139.
   Front Integr Neurosci. 13:45.
                                                                       Leikos S, Tokariev A, Koolen N, Nevalainen P, Vanhatalo S. 2019.
Finger H, Bönstrup M, Cheng B, Messé A, Hilgetag C, Thomalla G,
                                                                          Cortical responses to tactile stimuli in preterm infants. Eur J
   Gerloff C, König P. 2016. Modeling of large-scale functional
                                                                          Neurosci. 51(4):1059–1073.
   brain networks based on structural connectivity from DTI:
                                                                       Lombroso C. 1979. Quantified electrographic scales on 10 pre-
   comparison with EEG derived phase coupling networks and
                                                                          term healthy newborns followed up to 40–43 weeks of con-
   evaluation of alternative methods along the modeling path.
                                                                          ceptional age by serial polygraphic recordings. Electroen-
   PLoS Comput Biol. 12(8):e1005025.
                                                                          cephalogr Clin Neurophysiol. 46(4):460–474.
Genovese C, Lazar NA, Nichols T. 2002. Thresholding of statistical
                                                                       Luhmann H, Sinning A, Yang J-W, Reyes-Puerta V, Stüttgen MC,
   maps in functional neuroimaging using the false discovery
                                                                          Kirischuk S, Kilb W. 2016. Spontaneous neuronal activity in
   rate. NeuroImage. 15(4):870–878.
                                                                          developing neocortical networks: from single cells to large-
Girault J, Cornea E, Goldman BD, Knickmeyer RC, Styner M,
                                                                          scale interactions. Front Neural Circuits. 10:40.
   Gilmore JH. 2019. White matter microstructural development
                                                                       Molnár Z, Luhmann HJ, Kanold PO. 2020. Transient cortical cir-
   and cognitive ability in the first 2 years of life. Hum Brain
                                                                          cuits match spontaneous and sensory-driven activity during
   Mapp. 40(4):1195–1210.
                                                                          development. Science. 370(6514):eabb2153.
Gonzàlez JJ, Mañas S, De Vera L, Méndez LD, López S, Garrido
                                                                       Mostame P, Sadaghiani S. 2020. Phase- and amplitude-coupling
   JM, Pereda E. 2011. Assessment of electroencephalographic
                                                                          are tied by an intrinsic spatial organization but show diver-
   functional connectivity in term and preterm neonates. Clin
                                                                          gent stimulus-related changes. NeuroImage. 219:117051.
   Neurophysiol. 122(4):696–702.
Phase-based Cortical Synchrony in Preterm Infants Yrjölä et al. 2275
Mrzljak L, Uylings HB, Kostovic I, van Eden CG. 1992. Prenatal Vanhatalo S, Roberts JA. 2020. Automated cot-side tracking of
development of neurons in the human prefrontal cortex. II. functional brain age in preterm infants. Ann Clin Transl Neurol.
A quantitative Golgi study. J Comp Neurol. 316(4):485–496. 7(6):891–902.
Nevalainen P, Rahkonen P, Pihko E, Lano A, Vanhatalo S, Stjerna S, Sairanen V, Gröhn R, Andersson S, Metsäranta M,
Andersson S, Autti T, Valanne L, Metsäranta M, Lauronen Lano A, Vanhatalo S. 2015. Visual fixation in human new-
L. 2015. Evaluation of somatosensory cortical processing in borns correlates with extensive white matter networks and
Downloaded from https://academic.oup.com/cercor/article/32/10/2265/6404050 by EVES-Escola Valenciana dÉstudis de la Salut user on 09 June 2022
extremely preterm infants at term with MEG and EEG. Clin predicts long-term neurocognitive development. J Neurosci.
Neurophysiol. 126(2):275–283. 35(12):4824–4829.
Odabaee M, Tokariev A, Layeghy S, Mesbah M, Colditz PB, Ramon Storey J, Tibshirani R. 2003. Statistical significance for
C, Vanhatalo S. 2014. Neonatal EEG at scalp is focal and genomewide studies. Proc Natl Acad Sci. 100(16):9440–9445.
implies high skull conductivity in realistic neonatal head Tadel F, Baillet S, Mosher JC, Pantazis D, Leahy RM. 2011. Brain-
models. NeuroImage. 96:73–80. storm: a user-friendly application for MEG/EEG analysis. Com-
Omidvarnia A, Fransson P, Metsäranta M, Vanhatalo S. 2014. put Intell Neurosci. 2011:1–13.
Functional bimodality in the brain networks of preterm and Tewarie P, Hunt BA, O’Neill GC, Byrne A, Aquino K, Bauer M,
term human newborns. Cereb Cortex. 24(10):2657–2668. Mullinger KJ, Coombes S, Brookes MJ. 2019. Relationships
World Health Organization, March of Dimes, The Partnership for between neuronal oscillatory amplitude and dynamic func-
Maternal, Newborn & Child Health, Save the Children. 2012. tional connectivity. Cereb Cortex. 29(6):2668–2681.
Born too soon: the global action report on preterm birth. Who.int Tharp B. 1990. Electrophysiological brain maturation in prema-
[Internet]. https://www.who.int/reproductivehealth/publica ture infants: an historical perspective. J Clin Neurophysiol.
tions/maternal_perinatal_health/9789241503433/en/ [cited 7(3):302–314.
2021 January 14]. Tokariev A, Roberts JA, Zalesky A, Zhao X, Vanhatalo S, Breaks-
Palva J, Monto S, Kulashekhar S, Palva S. 2010. Neuronal syn- pear M, Cocchi L. 2019a. Large-scale brain modes reorganize
chrony reveals working memory networks and predicts indi- between infant sleep states and carry prognostic information
vidual memory capacity. Proc Natl Acad Sci. 107(16):7580–7585. for preterms. Nat Commun. 10(1):1–9.
Palva J, Wang SH, Palva S, Zhigalov A, Monto S, Brookes MJ, Schof- Tokariev A, Stjerna S, Lano A, Metsäranta M, Palva JM, Vanhatalo
felen J-M, Jerbi K. 2018. Ghost interactions in MEG/EEG source S. 2019b. Preterm birth changes networks of newborn cortical
space: a note of caution on inter-areal coupling measures. activity. Cereb Cortex. 29(2):814–826.
NeuroImage. 173:632–643. Tokariev A, Vanhatalo S, Palva JM. 2016a. Analysis of infant
Palva S, Palva JM. 2011. Functional roles of alpha-band phase cortical synchrony is constrained by the number of record-
synchronization in local and large-scale cortical networks. ing electrodes and the recording montage. Clin Neurophysiol.
Front Psychol. 2:204. 127(1):310–323.
Palva S, Palva JM. 2012. Discovering oscillatory interaction net- Tokariev A, Videman M, Palva JM, Vanhatalo S. 2016b. Functional
works with M/EEG: challenges and breakthroughs. Trends brain connectivity develops rapidly around term age and
Cogn Sci. 16(4):219–230. changes between vigilance states in the human newborn.
Puoliväli T, Palva S, Palva JM. 2020. Influence of multiple hypoth- Cereb Cortex. 26(12):4540–4550.
esis testing on reproducibility in neuroimaging research: Tóth B, Urbán G, Haden GP, Márk M, Török M, Stam CJ, Win-
a simulation study and python-based software. J Neurosci kler I. 2017. Large-scale network organization of EEG func-
Methods. 337:108654. tional connectivity in newborn infants. Hum Brain Mapp.
Rahkonen P, Nevalainen P, Lauronen L, Pihko E, Lano A, Van- 38(8):4019–4033.
hatalo S, Pesonen AK, Heinonen K, Räikkönen K, Valanne Toulmin H, O’Muircheataigh J, Counsell SJ, Falconer S, Chew A,
L, et al. 2013. Cortical somatosensory processing mea- Beckmann CF, Edwards AD. 2020. Functional thalamocortical
sured by magnetoencephalography predicts neurodevelop- connectivity at term equivalent age and outcome at 2 years
ment in extremely low-gestational-age infants. Pediatr Res. in infants born preterm. Cortex. 135:17–29.
73(6):763–771. Vanhatalo S, Kaila K. 2006. Development of neonatal EEG activity:
Räsänen O, Metsäranta M, Vanhatalo S. 2013. Development of a from phenomenology to physiology. Semin Fetal Neonatal Med.
novel robust measure for interhemispheric synchrony in the 11(6):471–478.
neonatal EEG: activation synchrony index (ASI). NeuroImage. Vanhatalo S, Palva JM, Andersson S, Rivera C, Voipio J, Kaila K.
69:256–266. 2005. Slow endogenous activity transients and developmen-
Romeo D, Ricci D, Brogna C, Cilauro S, Lombardo M, Romeo M, tal expression of K+–Cl- cotransporter 2 in the immature
Mercuri E. 2011. Neurological examination of late-preterm human cortex. Eur J Neurosci. 22(11):2799–2804.
infants at term age. Eur J Paediatr Neurol. 15(4):353–360. Venkata S, Pournami F, Prabhakar J, Nandakumar A, Jain N.
Rogers E, Hintz SR. 2016. Early neurodevelopmental outcomes of 2020. Disability prediction by early Hammersmith neonatal
extremely preterm infants. Semin Perinatol. 40(8):497–509. neurological examination: a diagnostic study. J Child Neurol.
Sahin M, Sweeney JA, Jones SR. 2020. Editorial: biomarkers 35(11):731–736.
to enable therapeutics development in neurodevelopmental Van de Pol LA, van’t Westende C, Zonnenberg I, Koedam E, van
disorders. Front Integr Neurosci. 14:616641. Rossum I, de Haan W, Steenweg M, van Straaten E, Stam C.
Siebenhühner F, Wang SH, Palva JM, Palva S. 2016. Cross- 2018. Strong relation between an EEG functional connectivity
frequency synchronization connects networks of fast and measure and postmenstrual age: a new potential tool for
slow oscillations during visual working memory mainte- measuring neonatal brain maturation. Front Hum Neurosci.
nance. elife. 5:e13451. 12:286.
Stevenson N, Oberdorfer L, Tataranno M-L, Breakspear M, Vasung L, Huang H, Jovanov-Milošević N, Pletikos M, Mori S, Kos-
Colditz PB, de Vries LS, Benders MJ, Klebermass-Schrehof K, tović I. 2010. Development of axonal pathways in the humanYou can also read