Association between cytomegalovirus infection, reduced gray matter volume, and resting-state functional hypoconnectivity in major depressive ...
←
→
Page content transcription
If your browser does not render page correctly, please read the page content below
Translational Psychiatry                                                                                                                            www.nature.com/tp

ARTICLE                 OPEN

Association between cytomegalovirus infection, reduced gray
matter volume, and resting-state functional hypoconnectivity
in major depressive disorder: a replication and extension
                ✉
Haixia Zheng 1 , Bart N. Ford 1,2, Rayus Kuplicki1, Kaiping Burrows1, Peter W. Hunt3, Jerzy Bodurka1,4, T. Kent Teague5,6,7,
Michael R. Irwin 8,9,10, Robert H. Yolken11, Martin P. Paulus 1,12 and Jonathan Savitz 1,12

© The Institute of Laureate Institute for Brain Research 2021

    Human cytomegalovirus (HCMV) is a neurotropic herpes virus known to cause neuropathology in patients with impaired immunity.
    Previously, we reported a reduction in the gray matter volume (GMV) of several brain regions in two independent samples of
    participants who were seropositive for HCMV (HCMV+) compared to matched participants who were seronegative for HCMV
    (HCMV−). In addition to an independent replication of the GMV findings, this study aimed to examine whether HCMV+ was
    associated with differences in resting-state functional connectivity (rsfMRI-FC). After balancing on 11 clinical/demographic variables
    using inverse probability of treatment weighting (IPTW), GMV and rsfMRI-FC were obtained from 99 participants with major
    depressive disorder (MDD) who were classified into 42 HCMV+ and 57 HCMV− individuals. Relative to the HCMV− group, the
    HCMV+ group showed a significant reduction of GMV in nine cortical regions. Volume reduction in the right lateral orbitofrontal
    cortex (standardized beta coefficient (SBC) = −0.32, [95%CI, −0.62 to −0.02]) and the left pars orbitalis (SBC = −0.34, [95%CI, −0.63
    to −0.05]) in the HCMV+ group was also observed in the previous study. Regardless of the parcellation method or analytical
    approach, relative to the HCMV− group, the HCMV+ group showed hypoconnectivity between the hubs of the sensorimotor
    network (bilateral postcentral gyrus) and the hubs of the salience network (bilateral insula) with effect sizes ranging from
    SBC = −0.57 to −0.99. These findings support the hypothesis that a positive HCMV serostatus is associated with altered
    connectivity of regions that are important for stress and affective processing and further supports a possible etiological role of
    HCMV in depression.

    Translational Psychiatry (2021)11:464 ; https://doi.org/10.1038/s41398-021-01558-6

INTRODUCTION                                                                             immunocompetent individuals (13.9%, 5 out of 36 cases) with a
Human cytomegalovirus (HCMV) is a common neurotropic herpes                              variety of neuropathological changes (mostly cerebrovascular
virus that infects up to 75% of the US population [1]. HCMV has                          alterations) [4]. These strands of evidence raise the possibility that
been identified as a major cause of neuropathology in immuno-                             under certain circumstances HCMV-induced neuropathology may
logically-naïve or immune-compromised patients (congenital                               also occur in individuals not classically considered to be
infection, AIDS patients, transplant recipients) [2–4]. Although                         immunocompromised. Thus, it is important to investigate whether
HCMV can evade the host immune system to establish life-long                             HCMV infection is playing a mechanistic role in the CNS alterations
latent infections and periodically reactivate in hosts subjected to                      characteristic of neuropsychiatric disorders.
stress or with weakened immunity [5–7], HCMV-induced neuro-                                 Individuals with major depressive disorder (MDD) may be
pathology has generally not been studied in medically healthy                            particularly vulnerable to the reactivation of HCMV given the link
populations. However, HCMV infection has been associated with                            between depression, stress, and impaired viral immunity [15–17]. We
cognitive decline [8], increased risk of neurological and psychiatric                    recently reported a reduction in the gray matter volume (GMV) of
disorders (i.e., stroke, depression, anxiety, schizophrenia, and                         several brain regions in two independent samples of participants
bipolar disorder) [9–12], and has been hypothesized to contribute                        who were seropositive for HCMV (HCMV+) compared to matched
to the progression of Alzheimer’s disease [13, 14]. Furthermore,                         participants who were seronegative for HCMV (HCMV−) [18].
HCMV DNA was found in the brains of a percentage of                                      Although only two of these regions, the left fusiform gyrus, and

1
 Laureate Institute for Brain Research, Tulsa, OK, USA. 2Oklahoma State Univerisity, Department of Pharmacology and Physiology, Tulsa, OK, USA. 3Department of Medicine, the
University of California, San Francisco, School of Medicine, San Francisco, CA, USA. 4Stephenson School of Biomedical Engineering, University of Oklahoma, Norman, OK, USA.
5
 Department of Surgery, University of Oklahoma School of Community Medicine, Tulsa, OK, USA. 6Department of Psychiatry, University of Oklahoma School of Community
Medicine, Tulsa, OK, USA. 7Department of Biochemistry and Microbiology, Oklahoma State University Center for Health Sciences, Tulsa, OK, USA. 8Cousins Center for
Psychoneuroimmunology at UCLA, Los Angeles, CA, USA. 9Semel Institute for Neuroscience at UCLA, Los Angeles, CA, USA. 10David Geffen School of Medicine, Los Angeles, CA,
USA. 11Stanley Division of Developmental Neurovirology, Johns Hopkins School of Medicine, Baltimore, MD, USA. 12Oxley College of Health Sciences, The University of Tulsa,
Tulsa, OK, USA. ✉email: hzheng@laureateinstitute.org

Received: 12 March 2021 Revised: 3 August 2021 Accepted: 11 August 2021
H. Zheng et al.
                  2
                      the right supramarginal gyrus, were replicated across both samples,        Information System (PROMIS) [44] scales for depression and anxiety,
                      the effect sizes suggested that the association between HCMV and           Patient Health Questionnaire 9 (PHQ-9) [45] for depressive symptoms,
                      reduced GMV might be widespread across other cortical regions              Customary Drinking and Drug use Record (CDDR) [46] structured interview
                      such as orbitofrontal, temporal, and parietal areas. The samples in        for lifetime alcohol use, as well as the childhood trauma questionnaire
                      question were composed of individuals with MDD and healthy                 (CTQ) [47] for early life stress. Data were collected between October 2018
                                                                                                 and March 2020. Exclusion criteria included: inclusion in previous GMV
                      controls (HCs), but post hoc analyses showed that the MDD                  paper [18], MDD in full remission, comorbid psychiatric disorders (except
                      participants drove the association between HCMV and brain volume.          for anxiety disorders), substance use disorders (except for alcohol use
                      In a second paper [19], we reported reduced white matter integrity in      disorder), neurological disorders, unstable medical disorders, a history of
                      two independent HCMV + MDD samples in the left and right inferior          moderate-to-severe traumatic brain injury at the time of data collection, a
                      fronto-occipital fasciculus, a large bundle of white matter fibers that     positive urine drug screen, a body mass index (BMI) 40 kg/m2, a
                      connects the parietal and occipital lobe to the orbitofrontal cortex via   history of autoimmune disorders (except hypothyroidism), missing
                      the insula and the temporal lobe [20, 21]. It is noteworthy that the       neuroimaging data (structural and functional images) and general MRI
                      orbitofrontal cortex, insula, and temporal regions have long been          exclusion criteria. Approval for the current study was obtained from the
                                                                                                 Western Institutional Review Board, and written informed consent was
                      documented as a target for herpes simplex encephalitis [22–24].
                                                                                                 obtained from all participants.
                      Together this evidence raises two important questions. First, are
                      HCMV-associated structural brain changes also anatomically localized
                      in orbitofrontal and temporal areas, and second, is HCMV serostatus        Anti-CMV IgG antibodies and C-reactive protein
                      associated with changes in brain function in MDD?                          Serum was isolated from morning blood samples following standard
                         There is a growing consensus that the human brain is organized          laboratory procedures and frozen at −80 oC. Thawed samples were tested
                                                                                                 blind to diagnosis for IgG antibodies using a semiquantitative solid-phase
                      into complex networks that fundamentally support a wide range              ELISA (IBL America, catalog #EI2570-9601G). A sample was considered
                      of cognitive and affective functioning [25–28], such as attention          HCMV seropositive if it had an optical density (OD) value of 20% over the
                      [29], memory [30], interoceptive/exteroceptive sensation [31, 32],         supplied cutoff standard, equivalent to approximately ten international
                      and emotion regulation [33]. Resting-state functional connectivity         antibody units. Due to the non-normal distribution, the OD values were
                      (FC), that is, the low-frequency blood oxygen level-dependent              quantified as plate-adjusted z-scores with a mean value for each plate of
                      (BOLD) signal temporal correlations between spatially distant              two and a standard deviation of one.
1234567890();,:

                      brain regions, provides a straightforward approach to study the               The concentration of C-reactive protein (CRP) was measured using
                      functional organization and connectivity properties of the human           whole venous blood with the Diazyme high sensitivity CRP point of care
                                                                                                 (POC) test kit (#DZ135B-SMA-discontinued) on the SMART 700 analyzer
                      brain. These slow, synchronized oscillations between areas are
                                                                                                 (Diazyme Laboratories). The measurement range was from 0.5 to 23 mg/L.
                      robust [34] and collectively form complex functional networks
                      [25–28]. For instance, the well-known default mode network
                      reflects self-referential thinking [35]; the salience network is            Image acquisition
                      involved in processing emotion or monitoring for interoceptive/            T1-weighted anatomical images were acquired on two identical 3 T
                      exteroceptive salient events [36]; the dorsal attention network and        scanners (GE Discovery MR750) using an MPRAGE sequence with the
                                                                                                 following parameters: FOV = 240 mm, 186 slices, slice thickness = 0.9 mm,
                      frontoparietal network (also known as the central executive                voxel dimensions = 0.938 × 0.938 × 0.9 mm3, image matrix = 256 × 256,
                      network) supports top-down cognitive control [37]; and the                 TR/TE = 5/2.012 ms, acceleration factor R = 2 in the phase encoding
                      sensorimotor network underlies somatosensory processing                    direction, flip angle = 8°.
                      [38, 39]. A meta-analysis of 27 seed-based voxel-wise resting-                Resting-state functional image data were acquired on the same scanners
                      state FC datasets yielded evidence for abnormalities in FC across          with the following parameters: Single-shot gradient-recalled echoplanar
                      and within large-scale networks in MDD, reporting hypoconnec-              imaging (EPI) sequence with Sensitivity Encoding depicting BOLD contrast.
                      tivity within and between the salience, dorsal attention, and              FOV = 240 mm, slice thickness = 2.9 mm, gap = 0 mm, matrix = 128 × 128,
                      frontoparietal networks, but hyperconnectivity within default              axial slices = 39, voxel size = 1.875 × 1.875 × 2.9 mm3, TR/TE = 2000/27 ms,
                      mode network and between the default mode network and the                  number of TRs = 180. Data were collected with two 6-min duration runs.
                                                                                                 Therefore, the total number of TRs = 180 × 2. During the acquisition,
                      frontoparietal network [40]. Although the precise function of              participants were instructed to “focus on the cross, clear your mind, and try
                      large-scale networks remains a matter of debate, resting-state FC          not to think of anything in particular with eyes open”.
                      offers a noninvasive and efficient way to explore a potentially
                      important neurobiological signature of HCMV infection in MDD.
                         Here, we tested the relationship between HCMV serostatus and            Individual-level image processing
                                                                                                 For T1-weighted anatomical images, cortical reconstruction and volumetric
                      GMV and resting state FC in a fully independent sample composed of         segmentation were performed using FreeSurfer version 6.0.0. [48] Whole-
                      individuals with MDD. Our aims were threefold. First, to determine if      brain GMVs were estimated from individual anatomical images, including
                      we could replicate the association between HCMV infection and              68 cortical regions (34 regions per hemisphere) using the Desikan-Killiany
                      reduced GMV in the context of MDD. Second, to determine the                atlas [49, 50]. Visual inspection of all cortical segmentation was performed
                      anatomical specificity of any such HCMV effect. Third, to link              before analysis for quality assurance purposes. FreeSurfer has been
                      anatomical findings to function using the resting-state FC analyses to      validated against histological measurements and demonstrates good test-
                      corroborate and elaborate the putative impact of HCMV on the brain.        retest reliability [51].
                      Findings from the current study would provide further evidence for            For resting-state functional images, preprocessing and individual level
                      the hypothesis that HCMV infection is responsible for some of the          analysis was performed using the SPM12 software (Welcome Department
                      neuroimaging abnormalities observed in MDD. These putative                 of Imaging Neuroscience, Institute of Neurology, London, UK) with the
                      neuropathological effects could theoretically be preventable given         CONN-toolbox [52] version 19 (https://web.conn-toolbox.org) in Matlab
                      the existence of well-tolerated anti-HCMV medications and the              2016a. The standard preprocessing pipeline implemented in the CONN-
                                                                                                 toolbox was applied. The initial five scans were removed to eliminate
                      ongoing development of HCMV vaccines [41, 42].                             equilibration effects. Functional images were co-registered to the
                                                                                                 structural image and normalized to Montreal Neurological Institute
                                                                                                 (MNI) space with 2 mm isotropic voxels. Slice-timing correction and head
                      METHODS                                                                    motion correction were performed. Images were smoothed with an 8 mm
                      Participants                                                               full width at half maximum Gaussian kernel. Band-pass filtering was set to
                      The current study included 99 participants aged 18–55 years who received   a frequency window from 0.01 to 0.1 Hz. Potential outlier scans were
                      a DSM-V diagnosis of MDD (with or without a comorbid anxiety disorder)     identified with framewise displacement above 0.9 mm or global BOLD
                      based on the Mini International Neuropsychiatric Inventory (MINI) [43].    signal changes above 5 SD [53]. A component-based noise-correction
                      Participants completed the Patient-Reported Outcomes Measurement           “aCompCor” strategy [54] implemented in this toolbox was used to

                                                                                                                        Translational Psychiatry (2021)11:464
H. Zheng et al.
3
control physiological, and movement confounds. This denoising method unmeasured confounding for both significant GMV and FC findings using
applied ordinary least squares regression to regress out the noise the “EValue” package. The E-value estimates the minimum effect an
components from the BOLD signal, including noise components from unmeasured confounder would need to have to be able to explain away
cerebral white matter and cerebrospinal areas, head motion parameters an observed association with the outcome of interest.
derived from preprocessing, identified outlier scans, and scan sections.
One participant who had head movement estimates above 3 mm was
excluded. RESULTS
To relate the FC results with the GMV findings, we used the same Study population and covariates balance
Desikan-Killiany atlas to define the cortical regions of interest (ROI, total 68
ROIs) to compute the whole-brain ROI-to-ROI FC maps for each individual. Demographic and clinical characteristics before and after applying
The BOLD signal was first averaged over each defined ROI, and the Z-score IPTW are summarized in Table 1. After applying IPTW, the
of the correlation coefficient between each pair of ROIs was defined as FC. demographic differences between HCMV+ and HCMV− dimin-
However, the Desikan-Killiany atlas may not be sufficient to fully capture ished substantially (i.e., standardized mean differences between
the brain’s FC as it parcellates the brain into relatively large regions based HCMV+ and HCMV− groups for eleven measured potential
on anatomical structure. To overcome this limitation, large-scale network- confounders were all less than 0.1, indicating well-balanced
based parcellation was also used in the current study. Specifically, five groups). The plot of weights and propensity score distributions in
commonly reported large-scale networks’ ten hub regions were used as Supplementary Fig. 1 demonstrated that no extreme weights were
seeds to compute the ROI-to-ROI inter-network FC (between the ten hub present, and the propensity weighting achieved the balance
regions) and the seed-to-voxel whole-brain FC of large-scale networks for
each individual. These network hub regions were predefined by the CONN between the HCMV+ and HCMV− groups. Although there was a
toolbox [52] based on independent component analyses of the Human lower percentage of depression without anxiety comorbidity in
Connectome Project (497 subjects), including (1) medial prefrontal cortex the HCMV+ MDD group relative to the HCMV− MDD group, the
and posterior cingulate cortex for the default mode network; (2) left and overall anxiety severity did not differ across groups (Table 1).
right lateral sensorimotor cortex for the sensorimotor network; (3) left There were no statistically significant group differences in any of
and right anterior insula for the salience network; (4) left and right the measured covariates between HCMV+ and HCMV− sub-
intraparietal sulcus for the dorsal attention network; and (5) left and right groups. There was no significant difference in medication type
dorsolateral prefrontal cortex for the frontoparietal network (also known as and depressive symptoms between the HCMV+ and HCMV−
the central executive network). Information and coordinates are summar-
groups before and after IPTW (Table 1).
ized in Supplementary Table S1.
GMV differences between HCMV+ and HCMV−
Group-level statistical analysis Consistent with our previous publication, relative to HCMV−
For the GMV replication analysis, the statistical analysis in the current study subjects, HCMV+ subjects showed widespread reductions in
followed the identical statistical procedural used in the previous study [18]. GMVs, most prominently in orbitofrontal, temporal, and parietal
Briefly, (1) inverse probability of treatment weighting (IPTW) [55, 56]
methodology was used to balance the following independent variables to regions (Fig. 1C). Relative to HCMV− subjects, HCMV+ subjects
mitigate potential confounding bias: age, sex, BMI, education, income, showed a reduction of GMV in 49 out of 68 cortical regions
PROMIS depression score, PROMIS anxiety score, medication status (yes/ although only nine of these regions were statistically significant
no), early-life stress (CTQ score), number of depressive episodes (MINI (puncorrected < 0.05, Fig. 1A, B and Table 2), i.e., the left inferior
interview), and lifetime alcohol use (CDDR interview). The stabilized temporal gyrus (SBC = −0.35, [95%CI, −0.70 to −0.01], note that
weights were estimated using the “ipw” package. (2) Standardized mean SBC is a measure of differences between groups in units of
differences were calculated to examine covariate balance before and after standard deviation), left lateral orbitofrontal gyrus (SBC = −0.32,
IPTW. (3) To confirm the effect of HCMV on GMV while accounting for the [95%CI, −0.62 to −0.02]), left pars orbitalis gyrus (SBC = −0.34,
weights and estimating robust standard error, weighted generalized linear
[95%CI, −0.63 to −0.05]), left pars triangularis (SBC = −0.40, [95%
regression models from the “Survey” package were used at each of the
regions. The total intracranial volume (TIV) was added into the model as a CI, −0.75 to −0.04]), left precentral gyrus (SBC = −0.37, [95%CI,
covariate to adjust for individual differences in overall brain size. A total −0.66 to −0.08]), left rostral middle frontal gyrus (SBC = −0.38,
number of four missing data points for these eleven variables were [95%CI, −0.72 to −0.04]), right lateral orbitofrontal gyrus
imputed using the k nearest neighbor algorithm with k = 10 (R, DMwR (SBC = −0.39, [95%CI, −0.70 to −0.08]), right postcentral gyrus
package). The statistical significance was determined by a threshold of (SBC) = −0.36, [95%CI, −0.71 to −0.02]), and right precentral
puncorrected < 0.05 (two-tailed). These statistical analyses were performed gyrus (SBC = −0.49, [95%CI, −0.80 to −0.18]). No regions were
using RStudio V1.1.463 and R version 3.5.3. significantly larger in the HCMV+ versus the HCMV− group
For the FC group-level analyses, differences in each pair of ROI-to-ROI and (Supplementary Table S2). Taken together, the significant volume
Seed-to-Voxel connectivity between HCMV+ and HCMV− were tested differences observed were of small-to-medium effect size.
separately using general linear models implemented in the CONN-toolbox
with age, sex, and BMI as covariates. An ROI/Seed level threshold of
Puncorrected < 0.001 and a false discovery rate (FDR) multi-test correction of FC differences between HCMV + and HCMV−
PFDR < 0.05 was used as the statistical threshold to identify the significant FC Five pairs of anatomical-based ROI-to-ROI FC showed significant
alterations. Subject level ROI-to-ROI and Seed-to-Voxel connectivity data differences between HCMV+ and HCMV− groups (pFDR < 0.05,
were exported to R and the effect size was estimated while adjusting for Fig. 2A and Table 2). Relative to HCMV− subjects, HCMV+ subjects
eleven measured covariates using the weighted generalized linear showed hypo-connectivity in the left insula-to- right postcentral
regression models (weights obtained from IPTW). All the significant findings
without IPTW adjustment were also reported as a sensitivity analysis. gyrus (SBC = −0.73, [95%CI, −1.11 to −0.35]), right insula-to-left
In exploratory analyses, the relationships between the significant GMV/ postcentral gyrus (SBC = −0.65, [95%CI, −1.06 to −0.24]), right
FC findings and semiquantitative anti-HCMV IgG level and log-transformed insula-to-right postcentral gyrus (SBC = −0.57, [95%CI, −1.00
CRP concentration were examined within the MDD HCMV+ subgroup. to −0.13]), and left postcentral gyrus-to-right superior temporal
Additionally, the correlation coefficient between the significant GMV/FC gyrus (SBC = −0.68, [95%CI, −1.05 to −0.31]). Relative to HCMV−
findings and depressive symptom severity (measured by each of the nine subjects, HCMV+ subjects also showed hyper-connectivity in the
PHQ-9 items and the total PHQ-9 score) was tested in all participants. The right postcentral gyrus-to-right inferior parietal gyrus (SBC = 0.69,
FDR was used for control for multiple testing. [95%CI, 0.28 to 1.10]). Thus, in comparison to the volumetric
Finally, two sensitivity analyses were carried out to test the robustness of changes, ROI-to-ROI FC differences were of medium effect size.
the findings. First, general linear regression models controlling for age, sex,
BMI, and TIV were performed to assess the sensitivity of observed results to Large-scale network-based Seed-to-Voxel analyses revealed that
the selection of balancing covariates (IPTW model). Second, we calculated HCMV+ subjects showed significant hypo-connectivity within the
E-values [57] to evaluate the robustness of the results to potential salience network and the sensorimotor network relative to HCMV−
Translational Psychiatry (2021)11:464H. Zheng et al.
4
Table 1. Demographic and clinical characteristics of study participants before and after applying inverse probability of treatment weighting (IPTW).
Before applying IPTW After applying IPTW
HCMV− HCMV+ pa SMDb HCMV− HCMV+ pa SMDb
n 57 42 57.18 41.58
Age (mean (SD)) 30.5 (11.4) 31.6 (10.8) 0.62 0.10 29.7 (11.1) 29.6 (10.1) 0.96 0.01
Sex = Male (%) 11 (19.3) 9 (21.4) 0.99 0.05 12.1 (21.1) 8.6 (20.6) 0.95 0.01
BMI (mean (SD)) 25.49 (4.82) 28.72 (5.81) 0.00 0.61 26.74 (5.32) 26.63 (5.88) 0.93 0.02
Education (mean (SD))c 6.77 (1.55) 6.21 (1.69) 0.09 0.34 6.44 (1.68) 6.36 (1.52) 0.83 0.05
Income (mean (SD))d 10.51 (1.39) 10.69 (0.66) 0.44 0.17 10.60 (1.15) 10.70 (0.64) 0.54 0.10
Depress severity (mean (SD))e 63.50 (6.80) 62.29 (6.99) 0.39 0.18 63.26 (7.09) 62.89 (6.83) 0.81 0.05
Anxiety severity (mean (SD))f 62.79 (6.46) 63.13 (5.71) 0.79 0.06 62.75 (6.35) 62.96 (5.74) 0.87 0.04
Anxiety comorbidity (%)g 0.03 0.77 0.05 0.75
Dep 23 (40.4) 6 (14.3) 21.1 (36.9) 5.7 (13.8)
Dep + Alc 0 (0.0) 1 (2.4) 0.0 (0.0) 1.0 (2.4)
Dep + Anx 24 (42.1) 17 (40.5) 25.2 (44.1) 16.4 (39.3)
Dep + Panic 1 (1.8) 1 (2.4) 1.2 (2.1) 0.8 (1.9)
Dep + PTSD 4 (7.0) 9 (21.4) 5.7 (10.0) 8.5 (20.4)
Dep + Soc phobia 5 (8.8) 8 (19.0) 4.0 (6.9) 9.2 (22.2)
Medicated (%)h 21 (36.8) 10 (23.8) 0.25 0.29 17.0 (29.8) 11.9 (28.6) 0.91 0.03
Medication type (%)g
NDRI 5 (8.8) 1 (2.4) 4.1 (7.1) 1.3 (3.2)
SNRI 3 (5.3) 1 (2.4) 2.5 (4.4) 0.8 (2.0)
SSRI 12 (21.1) 5 (11.9) 9.7 (17.0) 7.3 (17.5)
other 1 (1.8) 3 (7.1) 0.7 (1.3) 2.5 (5.9)
CTQ (mean (SD))i 45.1 (15.1) 50.8 (19.7) 0.11 0.33 48.5 (17.2) 47.6 (18.8) 0.83 0.05
Number of episodes (mean (SD))j 4.14 (3.49) 4.41 (3.49) 0.70 0.08 4.14 (3.55) 4.19 (3.51) 0.95 0.01
Alcohol use (mean (SD))k 4.43 (2.32) 4.14 (2.37) 0.55 0.12 4.14 (2.43) 4.16 (2.21) 0.97 0.01
HCMV IgG level (mean (SD))l 1.25 (0.23) 2.96 (0.59)H. Zheng et al.
5
Fig. 1 Gray matter volume differences between HCMV+ and HCMV−. A Illustration of regions that showed an effect of HCMV. Nine regions
were significantly smaller in HCMV+ versus HCMV− subjects at puncorrected < 0.05. Two out of these nine regions (lPORB and rLORB) were also
significantly decreased in the original study at puncorrected < 0.05. B Standardized beta coefficient (equivalent to Cohen’s d) as effect size with
95% CI is estimated from the IPTW adjusted regression model. The robust standard error was used to calculate the 95%CI. C Mapping of the
HCMV effect at all the cortical regions without thresholding (for exact values see Supplementary Table S1). Colors represent the standardized
beta coefficients estimated from the IPTW adjusted regression model. They range from −0.5 to 0.5, indicating that the mean gray matter
volume of the HCMV+ subgroup in the given region increased or decreased by 0.5 standard deviations relative to the HCMV− subgroup. Blue
colors represent smaller gray matter volumes in HCMV+ groups, whereas yellow-red colors represent larger gray matter volumes in HCMV+
groups. Consistent with the original findings, relative to HCMV− subjects, HCMV+ subjects showed widespread smaller gray matter volumes,
most prominently in orbitofrontal, temporal, and parietal regions. rLORB right lateral orbitofrontal gyrus, rPREC right precentral gyrus, rPOSC
right postcentral gyrus, lLORB right lateral orbitofrontal gyrus, lPORB left pars orbitalis gyrus, lITEM left inferior temporal gyrus, lRMP left rostral
middle frontal gyrus, LPTRI left pars triangularis, lOREC left precentral gyrus.
subjects (voxel-level puncorrected < 0.001, cluster level pFDR < 0.05, between semiquantitative HCMV IgG level and any neuroimaging
Fig. 2B and Table 2). The strength of FC between the right anterior findings (Table 2).
insula of the salience network and the left postcentral cluster was
also significantly lower in the HCMV+ group relative to the HCMV− Correlations between specific depressive symptoms and
group (cluster size = 274 voxels, SBC = −0.91, [95%CI, −1.28 to neuroimaging findings
−0.54]). Further, the strength of FC between the right sensorimotor Exploratory correlation analyses between specific depressive
cortex and the left frontal operculum cluster was significantly lower symptoms and neuroimaging findings were performed in all the
in the HCMV+ group relative to the HCMV− group (cluster size = MDD subjects. Only the regions that showed significant GMV/FC
405 voxels, SBC = −0.99, [95%CI, −1.36 to −0.62]). No significant difference between HCMV+ and HCMV− groups were tested.
within-network differences were found between HCMV+ and There were no significant correlations between specific depressive
HCMV− when seeds were placed in the hub regions of default symptoms (indexed by each of PHQ-9 items and the total PHQ-9
mode network, central executive network, and dorsal attention score) after FDR correction. The correlation coefficient values are
network. No significant network differences (between the ten summarized in Supplementary Fig. S3.
predefined network hub regions) were found between HCMV+ and
HCMV− using a threshold of pFDR < 0.05. Results significant at Sensitivity analysis
puncorrected < 0.05 are reported in Supplementary Fig. S2 to show the Sensitivity analysis using a general linear regression model
putative inter-network connection alterations in association with controlling for age, sex, BMI, and TIV yielded similar results with
HCMV serostatus. There was hypoconnectivity between sensor- a larger effect size than the IPTW model (Supplementary Table S3).
imotor network, salience network, and dorsal attention network, Based on our dataset and the observed effect size, the estimated
and hyperconnectivity between default mode network and E-value ranged from 2.02 to 4.01, suggesting that the observed
frontoparietal network observed when using a threshold of HCMV effects were at least moderately robust to potential
puncorrected < 0.05 (Supplementary Fig. S2). The effect sizes of these unmeasured confounders (Supplementary Table S3). The E-value
connectivity differences were large. methodology estimates the joint minimum strength of association
on the risk ratio scale that an unmeasured confounder must have
Correlations between HCMV IgG level, CRP, and neuroimaging with both treatment and outcome in order to fully explain away
findings an observed effect. Thus, to explain away the observed effect of
Correlation analyses were performed in the HCMV+ subgroup for the HCMV on GMV and FC, a putative unmeasured confounder would
nine cortical regions of reduced GMV, the five pairs of ROI-to-ROI FC, need to increase the likelihood of having a smaller GMV/ lower FC
and the two pairs of Seed-to-Voxel FC that showed significant and being HCMV+ by at least 2.02 to 4.01 times each.
alterations. Although no significant correlations survived FDR
correction, CRP concentration was inversely correlated with the left
pars orbitalis volume (r = −0.31, puncorrected = 0.049) and the left pars DISCUSSION
triangularis volume (r = −0.32, puncorrected = 0.044), as well as the FC This study aimed to examine whether HCMV+ was associated
between right postcentral gyrus and right inferior parietal gyrus with differences in GMV or with altered resting state FC and
(r = −0.35, puncorrected = 0.03). There were no significant correlations yielded three main findings. (1) Consistent with our previous
Translational Psychiatry (2021)11:4646
Table 2. HCMV effect on gray matter volume and resting-state functional connectivity.
Association with HCMV Correlation with IgG Correlation with CRP
Gray matter volume (Regions) SBCa 95%CIb puncorrected r puncorrected r puncorrected
L inferior temporal gyrus −0.35 −0.70 to −0.01 0.05* −0.05 0.75 −0.09 0.59
L lateral orbitofrontal gyrus −0.32 −0.62 to −0.02 0.04* 0.00 0.98 −0.24 0.14
L pars orbitalis −0.34 −0.63 to −0.05 0.02* −0.09 0.58 −0.31 0.05*
L pars triangularis −0.40 −0.75 to −0.04 0.03* −0.08 0.61 −0.32 0.04*
L precentral gyrus −0.37 −0.66 to −0.08 0.01** 0.08 0.60 −0.13 0.43
L rostral middle frontal gyrus −0.38 −0.72 to −0.04 0.03* −0.10 0.52 −0.24 0.13
R lateral orbitofrontal gyrus −0.39 −0.70 to −0.08 0.01** −0.02 0.90 −0.16 0.32
R postcentral gyrus −0.36 −0.71 to −0.02 0.04* 0.07 0.68 0.07 0.67
R precentral gyrus −0.49 −0.80 to −0.18 0.002** 0.08 0.63 −0.13 0.44
Functional connectivity (ROI-to-ROI) SBC 95%CI pFDR r puncorrected r puncorrected
L Insula–R Postcentral gyrus −0.73 −1.11 to −0.35 0.005*** −0.02 0.90 −0.18 0.26
R Insula–L Postcentral gyrus −0.65 −1.06 to −0.24 0.04*** −0.19 0.23 −0.12 0.47
R Insula – R Postcentral gyrus −0.57 −1.00 to −0.13 0.04*** 0.05 0.76 −0.07 0.65
L Postcentral gyrus– R Superior temporal gyrus −0.68 −1.05 to −0.31 0.04*** −0.22 0.17 −0.20 0.22
R Postcentral gyrus – R Inferior parietal gyrus 0.69 0.28–1.10 0.04*** −0.19 0.23 −0.35 0.03*
(Network Seed-to-Voxel)
H. Zheng et al.
Sensorimotor.R Lateral sensorimotor cortex – L Frontal −0.99 −1.36 to −0.62 HCMV−.
b
95%CI, 95% confidence interval, robust standard errors were used to calculate 95%CI.
Translational Psychiatry (2021)11:464H. Zheng et al.
7
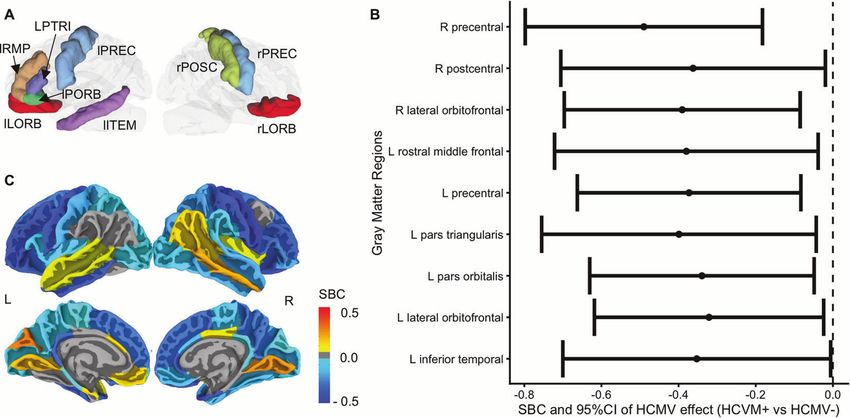
Fig. 2 Functional connectivity differences between HCMV+ and HCMV−. A Illustration of anatomical structural (Desikan-Killiany atlas)-
based ROI-to-ROI analyses findings (pFDR < 0.05). The figure represents connections were increased (orange-red color) or decreased (green-
blue color) connectivity was found in HCMV+ relative to HCMV− participants. B Functional network-based Seed-to-Voxel analyses identified
two FC pairs that were significantly lower in HCMV+ relative to HCMV− participants (voxel-level puncorrected < 0.001, cluster level pFDR < 0.05).
That is 1. from right anterior insula for the salience network to left postcentral cluster (cluster size = 274 voxels, peak coordinate x, y, z = −36,
−16, +50); 2. from right lateral sensorimotor cortex for the sensorimotor network to the left frontal operculum cluster (cluster size = 405
voxels, peak coordinate x, y, z = −36, +22, +08). The ROI/seed regions and the identified clusters were exported as binary maps and rendered
using DSI-studio for visualization. Effect sizes (standardized beta coefficient) ranged from −0.57 to −0.99. Please see Table 2 for details.
report of GMV reductions in HCMV+ MDD participants, nine anatomical distribution of HCMV-associated structural brain
regions were significantly reduced in volume in HCMV+ changes and herpes simplex encephalitis-associated neuropathol-
compared with HCMV− participants matched on up to 11 ogy [22–24] needs further testing in postmortem brain samples.
different potential confounding variables. No regions were We used both anatomical-based parcellation (ROI-to-ROI analyses)
significantly larger in HCMV+ versus HCMV− participants. (2) Of and network-based parcellation (Seed-to-Voxel analyses) to inves-
these regions, the reduction in the volume of the right lateral tigate alterations of FC in the context of HCMV infection. Both
orbitofrontal cortex and the left pars orbitalis (the orbital approaches highlighted hypoconnectivity between the salience
component of inferior frontal gyrus) was observed in the HCMV network and sensorimotor network in the HCMV+ group versus
+ group in this study was also present in our previous publication the HCMV− group. The insula (particularly, the anterior insula) and
[18]. (3) the HCMV+ group showed hypoconnectivity between the the salience network have long been recognized for their essential
hubs of the sensorimotor network (bilateral postcentral gyrus) and role in interoceptive/exteroceptive salient stimuli detection, emotion
the hubs of the salience network (bilateral insula). Taken together, regulation, and coordination of other brain large-scale network
these findings support the hypothesis that positive HCMV dynamics to guide behavior (i.e., dynamic switching between
serostatus is associated with altered connectivity of regions that default mode network and central executive network) [36, 37, 72]. In
are important for stress and affective processing and further the FC literature, hypoconnectivity in the salience network or insula
supports a possible etiological role of HCMV in depression. cortex has been consistently observed in MDD [36, 73] relative to
Reduced GMV in the orbitofrontal cortex appeared to be most HCs. The primary somatosensory cortex, the postcentral gyrus, has
robustly associated with HCMV infection in the context of MDD. direct control over the stress response as it has a direct neuronal
The orbitofrontal cortex receives and integrates sensory- connection to the adrenal medulla [74]. Recent studies have
visceromotor inputs [58, 59], and has been demonstrated to be reported decreased FC between the insula and postcentral gyrus
involved in decision making, reward prediction, emotion identi- in depressed patients with bipolar disorder relative to HCs [75, 76].
fication, and the hedonic experience [60–64]. Indeed, reduced Further, the circulating IL-6 concentration was negatively correlated
GMV or thickness of the orbitofrontal cortex has been reported in with the FC between the insula and postcentral gyrus [76].
the ENIGMA consortium MDD cohort as well as meta-analyses of Additionally, the inter-network connectivity (FC between the ten
MDD populations [65–67]. Although not statistically significant in predefined hub regions) also revealed a hypoconnectivity between
our previous study, we also found that the middle frontal gyrus, the salience network and the sensorimotor network, hypoconnec-
sensorimotor cortex, and inferior temporal gyrus showed sig- tivity between the sensorimotor network and the dorsal attention
nificant reductions in GMV in the HCMV+ group relative to the network, and hyperconnectivity between the default mode network
HCMV− group. These results are consistent with our previous and the frontoparietal network in the HCMV+ group relative to the
finding that HCMV associated GMV reductions are distributed HCMV− group (Supplementary Fig. S2). Although consistent with
across cortical regions but are most prominent in orbitofrontal, previous findings from FC meta-analyses in MDD [40], these results
temporal, and parietal regions. Decreased GMV or thickness in did not survive FDR correction and therefore need to be treated
these regions was also observed in other neurotropic viral with caution. Together, our finding raises the possibility that HCMV
infections, such as herpes simplex virus, measles virus, and HIV infection may impair the functional coupling between the salience
[68–71], raising a possibility that these regions maybe particularly and sensorimotor network systems, which are thought to play a vital
vulnerable to viral infection. The apparent similarity in the role in stress response and emotional processing.
Translational Psychiatry (2021)11:464H. Zheng et al.
8
Leboyer and colleagues previously reported an inverse correla- findings provide further support to the hypothesis that HCMV
tion between HCMV IgG titer and right hippocampal volumes in infection may play an etiological role in a vulnerable subgroup of
patients with schizophrenia and bipolar disorder [11]. Here, we MDD patients. Future studies with larger longitudinal samples or
found inverse correlations between CRP concentration and pars clinical trials with anti-HCMV treatments are warranted to validate the
orbitalis volume and the pars triangularis volume, as well as the FC findings and explore clinical applications.
between the right postcentral gyrus and right inferior parietal gyrus.
However, we did not observe a significant association between
HCMV IgG level and any of the neuroimaging findings. This may be CODE AVAILABILITY
because our measure of IgG antibody titer is only a semiquanti- The full neuroimaging processing script and statistical analyses code are available
tative, indirect measure of HCMV shedding. Further, IgG antibodies from the corresponding author on reasonable request.
have a half-life ofH. Zheng et al.
9
fasciculus, and Meyer’s loop of the optic radiation. Am J Neuroradiol. 49. Desikan RS, Ségonne F, Fischl B, Quinn BT, Dickerson BC, Blacker D, et al. An
2004;25:677–91. automated labeling system for subdividing the human cerebral cortex on MRI
22. Damasio AR, Van Hoesen GW. The limbic system and the localisation of herpes scans into gyral based regions of interest. Neuroimage. 2006;31:968–80.
simplex encephalitis. J Neurol Neurosurg Psychiatry. 1985;48:297–301. 50. Fischl B, Salat DH, Busa E, Albert M, Dieterich M, Haselgrove C, et al. Whole brain
23. Davis LE, Johnson RT. An explanation for the localization of herpes simplex segmentation: automated labeling of neuroanatomical structures in the human
encephalitis? Ann Neurol. 1979;5:2–5. brain. Neuron. 2002;33:341–55.
24. Esiri MM. Herpes simplex encephalitis. an immunohistological study of the dis- 51. Cardinale F, Chinnici G, Bramerio M, Mai R, Sartori I, Cossu M, et al. Validation of
tribution of viral antigen within the brain. J Neurol Sci. 1982;54:209–26. FreeSurfer-estimated brain cortical thickness: comparison with histologic mea-
25. Power JD, Cohen AL, Nelson SM, Wig GS, Barnes KA, Church JA, et al. Functional surements. Neuroinformatics. 2014;12:535–42.
network organization of the human brain. Neuron. 2011;72:665–78. 52. Whitfield-Gabrieli S, Nieto-Castanon A. Conn: a functional connectivity toolbox
26. Thomas Yeo BT, Krienen FM, Sepulcre J, Sabuncu MR, Lashkari D, Hollinshead M, for correlated and anticorrelated brain networks. Brain Connect. 2012;2:125–41.
et al. The organization of the human cerebral cortex estimated by intrinsic 53. Power JD, Mitra A, Laumann TO, Snyder AZ, Schlaggar BL, Petersen SE. Methods
functional connectivity. J Neurophysiol. 2011;106:1125–65. to detect, characterize, and remove motion artifact in resting state fMRI. Neu-
27. Bassett DS, Sporns O. Network neuroscience Danielle. Nat Neurosci. roimage. 2014;84:320–41.
2017;20:353–64. 54. Behzadi Y, Restom K, Liau J, Liu TT. A component based noise correction method
28. Fox MD, Snyder AZ, Vincent JL, Corbetta M, Van Essen DC, Raichle ME. The human (CompCor) for BOLD and perfusion based fMRI. Neuroimage. 2007;37:90–101.
brain is intrinsically organized into dynamic, anticorrelated functional networks. 55. Austin PC. An introduction to propensity score methods for reducing the effects
Proc Natl Acad Sci USA. 2005;5:9673–8. of confounding in observational studies. Multivar Behav Res. 2011;46:399–424.
29. Rosenberg MD, Scheinost D, Greene AS, Avery EW, Kwon YH, Finn ES, et al. 56. Austin PC, Stuart EA. Moving towards best practice when using inverse prob-
Functional connectivity predicts changes in attention observed across minutes, ability of treatment weighting (IPTW) using the propensity score to estimate
days, and months. Proc Natl Acad Sci USA. 2020;117:3797–807. causal treatment effects in observational studies. Stat Med. 2015;34:3661–79.
30. Liang X, Zou Q, He Y, Yang Y. Topologically reorganized connectivity architecture 57. Van Der Weele TJ, Ding P. Sensitivity analysis in observational research: intro-
of default-mode, executive-control, and salience networks across working ducing the E-Value. Ann Intern Med. 2017;167:268–74.
memory task loads. Cereb Cortex. 2016;26:1501–11. 58. Carmichael ST, Price JL. Sensory and premotor connections of the orbital and
31. Sepulcre J, Sabuncu MR, Yeo TB, Liu H, Johnson KA. Stepwise connectivity of the medial prefrontal cortex of macaque monkeys. J Comp Neurol. 1995;363:642–64.
modal cortex reveals the multimodal organization of the human brain. J Neu- 59. Critchley HD, Mathias CJ, Dolan RJ. Fear conditioning in humans: the influence of
rosci. 2012;32:10649–61. awareness and autonomic arousal on functional neuroanatomy. Neuron.
32. Kleckner IR, Zhang J, Touroutoglou A, Chanes L, Xia C, Simmons WK, et al. Evi- 2002;33:653–63.
dence for a large-scale brain system supporting allostasis and interoception in 60. Walton ME, Devlin JT, Rushworth MFS. Interactions between decision making and
humans. Nat Hum Behav. 2017;1:0069. performance monitoring within prefrontal cortex. Nat Neurosci. 2004;7:1259–65.
33. Kohn N, Eickhoff SB, Scheller M, Laird AR, Fox PT, Habel U. Neural network of 61. Gottfried JA, O’Doherty J, Dolan RJ. Encoding predictive reward value in human
cognitive emotion regulation - An ALE meta-analysis and MACM analysis. Neu- amygdala and orbitofrontal cortex. Science. 2003;301:1104–7.
roimage. 2014;87:345–55. 62. Hornak J, Bramham J, Rolls ET, Morris RG, O'Doherty J, Bullock PR, et al. Changes
34. Damoiseaux JS, Rombouts SARB, Barkhof F, Scheltens P, Stam CJ, Smith SM, et al. in emotion after circumscribed surgical lesions of the orbitofrontal and cingulate
Consistent resting-state networks across healthy subjects. Proc Natl Acad Sci USA. cortices. Brain. 2003;126:1691–712.
2006;103:13848–53. 63. Kringelbach ML, O’Doherty J, Rolls ET, Andrews C. Activation of the human
35. Buckner RL, Andrews-Hanna JR, Schacter DL. The brain’s default network: anat- orbitofrontal cortex to a liquid food stimulus is correlated with its subjective
omy, function, and relevance to disease. Ann N Y Acad Sci. 2008;1124:1–38. pleasantness. Cereb Cortex. 2003;13:1064–71.
36. Uddin LQ. Salience processing and insular cortical function and dysfunction. Nat 64. Kringelbach ML. The human orbitofrontal cortex: linking reward to hedonic
Rev Neurosci. 2015;16:55–61. experience. Nat Rev Neurosci. 2005;6:691–702.
37. Cocchi L, Zalesky A, Fornito A, Mattingley JB. Dynamic cooperation and com- 65. Schmaal L, Hibar DP, Sämann PG, Hall GB, Baune BT, Jahanshad N, et al. Cortical
petition between brain systems during cognitive control. Trends Cogn Sci. abnormalities in adults and adolescents with major depression based on brain
2013;17:493–501. scans from 20 cohorts worldwide in the ENIGMA Major Depressive Disorder
38. Huang S, Li Y, Zhang W, Zhang B, Liu X, Mo L, et al. Multisensory competition is Working Group. Mol Psychiatry. 2017;22:900–9.
modulated by sensory pathway interactions with fronto-sensorimotor and 66. Kempton MJ, Salvador Z, Munafò MR, Geddes JR, Simmons A, Frangou S, et al.
default-mode network regions. J Neurosci. 2015;35:9064–77. Structural neuroimaging studies in major depressive disorder. Meta-analysis and
39. Chang EF, Niziolek CA, Knight RT, Nagarajan SS, Houde JF. Human cortical sen- comparison with bipolar disorder. Arch Gen Psychiatry. 2011;68:675–90.
sorimotor network underlying feedback control of vocal pitch. Proc Natl Acad Sci 67. Koolschijn PCMP, van Haren NEM, Lensvelt-Mulders GJLM, Hulshoff Pol HE, Kahn
USA. 2013;110:2653–8. RS. Brain volume abnormalities in major depressive disorder: a meta-analysis of
40. Kaiser RH, Andrews-Hanna JR, Wager TD, Pizzagalli DA. Large-scale network magnetic resonance imaging studies. Hum Brain Mapp. 2009;30:3719–35.
dysfunction in major depressive disorder: a meta-analysis of resting-state func- 68. Misra UK, Kalita J, Phadke RV, Wadwekar V, Boruah DK, Srivastava A, et al. Acta
tional connectivity. JAMA Psychiatry. 2015;72:603–11. tropica usefulness of various MRI sequences in the diagnosis of viral encephalitis.
41. Marty FM, Ljungman P, Chemaly RF, Maertens J, Dadwal SS, Duarte RF, et al. Acta Trop. 2010;116:206–11.
Letermovir prophylaxis for cytomegalovirus in hematopoietic-cell transplanta- 69. Bradshaw MJ, Venkatesan A. Herpes simplex virus-1 encephalitis in adults:
tion. N. Engl J Med. 2017;377:2433–44. pathophysiology, diagnosis, and management. Neurotherapeutics. 2016. https://
42. Diamond DJ, La Rosa C, Chiuppesi F, Contreras H, Dadwal S, Wussow F, et al. A doi.org/10.1007/s13311-016-0433-7.
fifty-year odyssey: prospects for a cytomegalovirus vaccine in transplant and 70. Aydin K, Okur O, Tatli B, Sarwar SG, Ozturk C, Dilber C. Reduced gray matter
congenital infection. Expert Rev Vaccines. 2018;17:889–911. volume in the frontotemporal cortex of patients with early subacute sclerosing
43. Sheehan DV, Lecrubier Y, Sheehan KH, Amorim P, Janavs J, Weiller E, et al. The panencephalitis. Ajnr Am J Neuroradiol. 2009;30:271–5.
Mini-International Neuropsychiatric Interview (M.I.N.I.): the development and 71. Kallianpur KJ, Kirk GR, Sailasuta N, Valcour V, Shiramizu B, Nakamoto BK, et al.
validation of a structured diagnostic psychiatric interview for DSM-IV and ICD-10. Regional cortical thinning associated with detectable levels of HIV DNA. Cerebral
J Clin Psychiatry. 1998;59(Suppl 20):22–33;quiz 34-57. Cortex. 2012. https://doi.org/10.1093/cercor/bhr285.
44. Gershon RC, Rothrock N, Hanrahan R, Bass M, Cella D. The use of PROMIS and 72. Cauda F, D'Agata F, Sacco K, Duca S, Geminiani G, Vercelli A. Functional con-
assessment center to deliver patient-reported outcome measures in clinical nectivity of the insula in the resting brain. Neuroimage. 2011;55:8–23.
research. J Appl Meas. 2010;11:304–14. 73. Kaiser RH, Andrews-Hanna JR, Wager TD, Pizzagalli DA. Large-scale network
45. Kroenke K, Spitzer RL, Williams JB. The PHQ-9: validity of a brief depression dysfunction in major depressive disorder. JAMA Psychiatry. 2015;72:603–11.
severity measure. J Gen Intern Med. 2001;16:606–13. 74. Dum RP, Levinthal DJ, Strick PL. Motor, cognitive, and affective areas of the
46. Brown SA, Myers MG, Lippke L, Tapert SF, Stewart DG, Vik PW. Psychometric cerebral cortex influence the adrenal medulla. Proc Natl Acad Sci USA.
evaluation of the Customary Drinking and Drug Use Record (CDDR): a measure of 2016;113:9922–7.
adolescent alcohol and drug involvement. J Stud Alcohol. 1998;59:427–38. 75. Yin Z, Chang M, Wei S, Jiang X, Zhou Y, Cui L, et al. Decreased functional con-
47. Bernstein DP, Stein JA, Newcomb MD, Walker E, Pogge D, Ahluvalia T, et al. nectivity in insular subregions in depressive episodes of bipolar disorder and
Development and validation of a brief screening version of the childhood trauma major depressive disorder. Front Neurosci. 2018;12:1–9.
questionnaire. Child Abus Negl. 2003;27:169–90. 76. Chen P, Chen F, Chen G, Zhong S, Gong J, Zhong H, et al. Inflammation is
48. Dale AM, Fischl B, Sereno MI. Cortical surface-based analysis. Neuroimage. associated with decreased functional connectivity of insula in unmedicated
1999;9:179–94. bipolar disorder. Brain Behav Immun. 2020;89:615–22.
Translational Psychiatry (2021)11:464H. Zheng et al.
10
77. Gianella S, Moser C, Vitomirov A, McKhann A, Layman L, Scott B, et al. Presence of preparation, review, or approval of the manuscript; and decision to submit the
asymptomatic cytomegalovirus and Epstein-Barr virus DNA in blood of persons manuscript for publication. Dr. Hunt receives support from Merck (donated drug) for
with HIV starting antiretroviral therapy is associated with non-AIDS clinical a clinical trial of letermovir. Dr. Paulus is an advisor to Spring Care, Inc., a behavioral
events. AIDS. 2020;34:849–57. health startup, he has received royalties for an article about methamphetamine in
78. Zhou W, Wang C, Ding M, Bian Y, Zhong Y, Shen H, et al. Different expression UpToDate. All other authors have no disclosures to report.
pattern of human cytomegalovirus-encoded microRNAs in circulation from virus
latency to reactivation. J Transl Med. 2020;18:1–13.
79. Barrett LF, Simmons WK. Interoceptive predictions in the brain. Nat Rev Neurosci. AUTHOR CONTRIBUTIONS
2015;16:419–29. Conception and design of work: H.Z. and J.S., Data acquisition: B.N.F., K.B., J.B., T.K.T.,
80. Chen WG, Schloesser D, Arensdorf AM, Simmons JM, Cui C, Valentino R, et al. The R.H.Y., M.P.P., and J.S., Data analysis: H.Z. and R.K., Interpretation of results: H.Z., M.R.I.,
emerging science of interoception: sensing, integrating, interpreting, and reg- R.H.Y., M.P.P., and J.S., Drafting manuscript: H.Z. and J.S., Revision of manuscript:
ulating signals within the self. Trends Neurosci. 2021;44:3–16. H.Z., B.N.F., R.K., K.B., P.W.H., J.B., T.K.T., M.R.I., R.H.Y., M.P.P., and J.S., Funding: H.Z., M.P.P.,
81. Berntson GG, Khalsa SS. Neural circuits of interoception. Trends Neurosci. and J.S.
2021;44:17–28.
82. Alcendor DJ, Charest AM, Zhu WQ, Vigil HE, Knobel SM. Infection and upregu-
lation of proinflammatory cytokines in human brain vascular pericytes by human
cytomegalovirus. J Neuroinflammation. 2012;9:95. COMPETING INTERESTS
83. Poland SD, Costello P, Dekaban GA, Rice GPA. Cytomegalovirus in the brain: The authors declare no competing interests.
in vitro infection of human brain-derived cells. J Infect Dis. 1990;162:1252–62.
84. Tsutsui Y, Kosugi I, Kawasaki H. Neuropathogenesis in cytomegalovirus infection:
indication of the mechanisms using mouse models. Rev Med Virol. ADDITIONAL INFORMATION
2005;15:327–45.
Supplementary information The online version contains supplementary material
85. van Den Pol AN, Mocarski E, Saederup N, Vieira J, Meier TJ. Cytomegalovirus cell
available at https://doi.org/10.1038/s41398-021-01558-6.
tropism, replication, and gene transfer in brain. J Neurosci. 1999;19:10948–65.
86. Glass CK, Saijo K, Winner B, Marchetto MC, Gage FH. Mechanisms underlying
Correspondence and requests for materials should be addressed to Haixia Zheng
inflammation in neurodegeneration. Cell. 2010;140:918–34.
87. Kohm AP, Fuller KG, Miller SD. Mimicking the way to autoimmunity: an evolving
Reprints and permission information is available at http://www.nature.com/
theory of sequence and structural homology. Trends Microbiol. 2003;11:101–5.
reprints
88. Halenius A, Hengel H. Human cytomegalovirus and autoimmune disease. Biomed
Res Int. 2014;2014:472978.
Publisher’s note Springer Nature remains neutral with regard to jurisdictional claims
89. Slobedman B, Barry PA, Spencer JV, Avdic S, Abendroth A. Virus-encoded
in published maps and institutional affiliations.
homologs of cellular iterleukin-10 and their control of host immune function.
J Virol. 2009;83:9618–29.
90. Kotenko SV, Saccani S, Izotova LS, Mirochnitchenko OV, Pestka S. Human cyto-
megalovirus harbors its own unique IL-10 homolog (cmvIL-10). Proc Natl Acad Sci
USA 2000;97:1695–700.
Open Access This article is licensed under a Creative Commons
91. Klenerman P, Oxenius A. T cell responses to cytomegalovirus. Nat Rev Immunol.
Attribution 4.0 International License, which permits use, sharing,
2016. https://doi.org/10.1038/nri.2016.38.
adaptation, distribution and reproduction in any medium or format, as long as you give
appropriate credit to the original author(s) and the source, provide a link to the Creative
Commons license, and indicate if changes were made. The images or other third party
ACKNOWLEDGEMENTS material in this article are included in the article’s Creative Commons license, unless
The authors thank all the research participants and wish to acknowledge the indicated otherwise in a credit line to the material. If material is not included in the
contributions of Brenda Davis, Debbie Neal, Chibing Tan, and Ashlee Taylor from the article’s Creative Commons license and your intended use is not permitted by statutory
laboratory of TKT at the University of Oklahoma Integrative Immunology Center regulation or exceeds the permitted use, you will need to obtain permission directly
towards the transport, processing, and handling of all blood samples. This work was from the copyright holder. To view a copy of this license, visit http://creativecommons.
supported by The William K. Warren Foundation, the National Institute of Mental org/licenses/by/4.0/.
Health (R21MH11387; R01MH123652), and the National Institute of General Medical
Sciences (P20GM121312). The funding sources had no role in the study’s design
and conduct: collection, management, analysis, and interpretation of the data; © The Institute of Laureate Institute for Brain Research 2021
Translational Psychiatry (2021)11:464You can also read