ASYMMETRIC THINNING OF THE CEREBRAL CORTEX ACROSS THE ADULT LIFESPAN IS ACCELERATED IN ALZHEIMER'S DISEASE - MPG.PURE
←
→
Page content transcription
If your browser does not render page correctly, please read the page content below

ARTICLE
                  https://doi.org/10.1038/s41467-021-21057-y                 OPEN

                  Asymmetric thinning of the cerebral cortex across
                  the adult lifespan is accelerated in Alzheimer’s
                  disease
                  James M. Roe1 ✉, Didac Vidal-Piñeiro 1, Øystein Sørensen 1, Andreas M. Brandmaier 2, Sandra Düzel2,
                  Hector A. Gonzalez3, Rogier A. Kievit 4, Ethan Knights4, Simone Kühn2,5, Ulman Lindenberger 5,
                  Athanasia M. Mowinckel1, Lars Nyberg6, Denise C. Park3, Sara Pudas 6, Melissa M. Rundle3,
1234567890():,;

                  Kristine B. Walhovd 1,7, Anders M. Fjell1,7, René Westerhausen 1 & The Australian Imaging Biomarkers and
                  Lifestyle Flagship Study of Ageing*

                  Aging and Alzheimer’s disease (AD) are associated with progressive brain disorganization.
                  Although structural asymmetry is an organizing feature of the cerebral cortex it is unknown
                  whether continuous age- and AD-related cortical degradation alters cortical asymmetry.
                  Here, in multiple longitudinal adult lifespan cohorts we show that higher-order cortical
                  regions exhibiting pronounced asymmetry at age ~20 also show progressive asymmetry-loss
                  across the adult lifespan. Hence, accelerated thinning of the (previously) thicker homotopic
                  hemisphere is a feature of aging. This organizational principle showed high consistency
                  across cohorts in the Lifebrain consortium, and both the topological patterns and temporal
                  dynamics of asymmetry-loss were markedly similar across replicating samples. Asymmetry-
                  change was further accelerated in AD. Results suggest a system-wide dedifferentiation of the
                  adaptive asymmetric organization of heteromodal cortex in aging and AD.

                  1 Center for Lifespan Changes in Brain and Cognition, Department of Psychology, University of Oslo, Oslo, Norway. 2 Center for Lifespan Psychology, Max

                  Planck Institute for Human Development, Berlin, Germany. 3 Center for Vital Longevity, University of Texas, Dallas, TX, USA. 4 MRC Cognition and Brain
                  Sciences Unit, University of Cambridge, Cambridge, UK. 5 Department of Psychiatry and Psychotherapy, University Medical Center Hamburg-Eppendorf,
                  Hamburg, Germany. 6 Umeå Center for Functional Brain Imaging and Department of Integrative Medical Biology, Umeå University, Umeå, Sweden.
                  7 Department of Radiology and Nuclear Medicine, Oslo University Hospital, Oslo, Norway. *A list of authors and their affiliations appears at the end of

                  the paper. ✉email: j.m.roe@psykologi.uio.no

                  NATURE COMMUNICATIONS | (2021)12:721 | https://doi.org/10.1038/s41467-021-21057-y | www.nature.com/naturecommunications                              1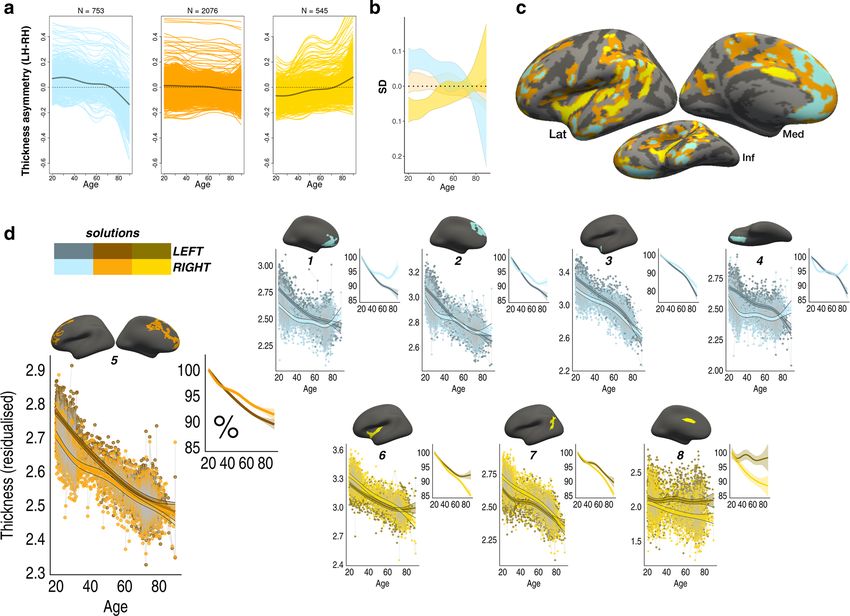
ARTICLE                                                                  NATURE COMMUNICATIONS | https://doi.org/10.1038/s41467-021-21057-y

H
         ealthy aging and Alzheimer’s disease (AD) are associated            performed vertex-wise Generalized Additive Mixed Models
         with progressive disruption of structural brain                     (GAMMs)32 after resampling individual LH and RH thickness
         organization1,2 and the dedifferentiation of functionally           maps to a common surface33,34 (Fig. 1c and Supplementary
specialized systems3–7. Despite being a global organizing property           Fig. 1). Next, we applied data-driven clustering to identify regions
of the cortex8,9 with plausible relevance for hemispheric specia-            of cortex with similar profiles of changing thickness asymmetry
lization10, cortical thickness asymmetry has been mostly over-               across adult life (Fig. 1d, e). We hypothesized that cortical regions
looked in studies examining cortical aging. Yet an asymmetrically            that are strongly asymmetric in young adulthood—as a plausible
organized cortex gives rise to efficient functional network orga-             structural marker of hemispheric specialization reflecting optimal
nization11–14 and thus may support cognition15,16. Hence, as the             brain organization10—will exhibit changing asymmetry in aging.
cortex thins over time17, cortical thickness asymmetry may also              Finally, we predicted that similar changes in regional thickness
change, which may be informative for declining brain function.               asymmetry will occur faster in AD and show this using a long-
Here, utilizing large longitudinal data sets from five healthy aging          itudinal clinical dementia data set.
cohorts and one dementia cohort, we aimed to establish the
trajectories of asymmetric cortical thinning and examine devia-
                                                                             Results
tions from these trajectories in AD patients.
                                                                             Asymmetry-change analyses. To identify cortical regions chan-
   Of the few cross-sectional studies assessing age effects upon
                                                                             ging in thickness asymmetry across adult life, we ran vertex-wise
cortical thickness asymmetry, reported results have been
                                                                             GAMMs with Age × Hemisphere (i.e., age-related change in
inconsistent8,15,18,19. For example, in prefrontal regions known to
                                                                             asymmetry) as the effect of interest in the LCBC discovery
be especially vulnerable in aging17,20, a steeper relationship for
                                                                             sample. Significant age-related changes in asymmetry were found
thickness with age has been reported in both the right hemisphere
                                                                             in large portions of prefrontal, anterior/middle temporal, insular,
(RH)18 and left hemisphere (LH)15 between ages 5 and 60. Still,
                                                                             and lateral parietal cortex (Fig. 2a), with particularly pronounced
recent large-scale meta-analyses in the ENIGMA consortium
                                                                             effects in medial prefrontal cortex (mPFC). The main effect of
found no evidence for age effects upon frontal asymmetry8, and
                                                                             Hemisphere (i.e., irrespective of Age) revealed a clear
studies have linked age to both loss19 and widespread exacerba-
                                                                             anterior–posterior pattern of general thickness asymmetry in
tion of18 thickness asymmetries established earlier in life. Con-
                                                                             adult life (Fig. 2b), consistent with a recent meta-analysis8. Cri-
flicting results may be partly ascribable to differences in sample
                                                                             tically, Age × Hemisphere effects conformed well to the main
size and test power, and linear modeling of cross-sectional age
                                                                             effect of Hemisphere, indicating that regions of cortex char-
effects across developmental and aging samples known to follow
                                                                             acterized by strong asymmetry also exhibit changing thickness
nonlinear brain trajectories over time21,22. Methodological dif-
                                                                             asymmetry with age. Note that the direction of asymmetry-
ferences such as whether age effects upon thickness asymmetry
                                                                             change effects is not interpretable from the GAMM interaction
were probed regionally8,19 or vertex-wise across the cortex15,18
                                                                             (see next section). An equivalent analysis with a linear mixed-
may also help explain divergent results. Longitudinal lifespan
                                                                             effect (LME) model showed comparable results (see Supple-
studies examining intraindividual asymmetry change have the
                                                                             mentary Note 1 and Supplementary Fig. 2).
potential to resolve inconsistencies and capture nonlinear
asymmetry-change trajectories, but are currently absent from the
literature. Thus, the foundational question of whether and where             Clustering of asymmetry trajectories. To explore asymmetry
the cerebral hemispheres thin at different rates in aging                    trajectories underlying the Age × Hemisphere GAMM interac-
remains open.                                                                tion, we clustered the cortex to identify regions exhibiting similar
   Regions of cortex that thin most in healthy aging overlap with            profiles of changing thickness asymmetry across the adult life-
regions exhibiting more degeneration in AD, indicating acceler-              span. PAM clustering36 indicated that asymmetry trajectories
ated change trajectories in AD23–25, and that normal and                     were optimally partitioned using a three-cluster solution (mean
pathological brain aging may at least partly exist on a con-                 silhouette width = 0.46; Fig. 1e). Figure 3a–c shows the resulting
tinuum26. Thus, hypothesized changes in asymmetry across                     three-cluster partition. Cluster 1 consisted of vertices exhibiting
healthy adult life may be evident to a greater extent in AD.                 mean loss of leftward asymmetry with age (negative slope from
Although cross-sectional findings are somewhat conflicting19,27,28             positive intercept) and mapped onto medial, orbitofrontal, dor-
and meta-analyses report scant evidence for increased LH vul-                solateral frontal, and anterior temporal cortex. Conversely,
nerability in AD29, early longitudinal findings indicate that dis-            Cluster 3 vertices exhibited mean loss of rightward asymmetry
ease progression may be associated with faster LH degeneration               with age (positive slope from negative intercept), and mapped
in medial and prefrontal cortex30. Furthermore, recent evidence              predominantly onto insular, lateral temporoparietal cortex, and
hints that system-wide loss of existing asymmetries may be part              caudal anterior cingulate. Cluster 1 and Cluster 3 trajectories
of the AD phenotype31. These results suggest that altered cortical           showed asymmetry declines emerging at a similar age (around
asymmetry may accompany increased intraindividual cognitive                  early 30s) and continuing across the adult lifespan, with accel-
and clinical deficit in AD over time, supporting a role for struc-            erated decline around age 60 (see also Supplementary Fig. 2D).
tural asymmetry in healthy brain function. Currently, however, it            Total loss of both leftward and rightward asymmetry occurred at
is not known whether purported AD-related alterations in cor-                a similar age, around the mid 70s. Beyond this, a continuing trend
tical asymmetry reflect an acceleration of gradual changes                    toward the opposite asymmetry to youth was apparent, particu-
occurring over the healthy adult lifespan.                                   larly in Cluster 1. Cluster 2 trajectories were more mixed and
   Here, in an initial longitudinal adult lifespan discovery sample          generally showed weaker effects, although a trend toward loss of
(Center for Lifespan Changes in Brain and Cognition, LCBC; see               leftward asymmetry was still apparent. These results were robust
Fig. 1a; age range = 20–89; total observations = 2577; long-                 to varying the number of clustering partitions (Supplementary
itudinal observations = 1851; mean follow-up interval = 2.7                  Fig. 3). Homotopic age trajectories are shown in Fig. 3d for eight
years), we show that the cerebral cortex thins asymmetrically in             main clustering-derived regions of interest (ROI’s) selected based
aging. We then sought to replicate the findings in four inde-                 on cluster- and effect-size criteria (see also Supplementary Fig. 4).
pendent longitudinal adult lifespan samples (see Fig. 1b and                 Leftward asymmetry loss in frontal and anterior temporal cortex
Supplementary Table 1). To capture nonlinear differences                     was driven by accelerated LH-thinning. Conversely, rightward
between homotopic thinning profiles across adult life, we                     asymmetry loss was driven by accelerated RH-thinning (e.g., in

2                NATURE COMMUNICATIONS | (2021)12:721 | https://doi.org/10.1038/s41467-021-21057-y | www.nature.com/naturecommunications
NATURE COMMUNICATIONS | https://doi.org/10.1038/s41467-021-21057-y                                                                         ARTICLE

Fig. 1 Samples and analysis method. a Age-distribution of the LCBC discovery sample. b Age-distributions of the four replication samples. Colors in (a, b)
highlight the number of longitudinal scans available per sample (i.e., dark green denotes subjects with only one timepoint, light green denotes subjects with
two timepoints, blue denotes subjects with more than two timepoints; stacked bars). The number of unique subjects (N) is given in total and per number of
available timepoints. The total number of scan observations (obs) is given per cohort. c Spherical surface rendering of a nonsymmetrical (top) compared to
the symmetrical template (bottom) used in the present study. Mean sulcal topography of the left and right hemispheres is shown in yellow and orange,
respectively. Note the near-perfect alignment of left- and right-hemisphere topography on the symmetrical surface. d Visualization of asymmetry analysis
at an example vertex (black circle). GAMMs were used to compute the zero-centered (i.e., demeaned) age trajectories of the left [s(LH-Age)] and right [s
(RH-Age)] hemisphere at every vertex. Blue and yellow lines indicate the smooth age trajectory of mean cortical thickness for the left and right
hemisphere, respectively, after each has been demeaned. The difference between these (green line) depicts the asymmetry trajectory [s(LH-Age)-s(RH-
Age)] that was used for assessment of age-change in asymmetry, equivalent to the GAMM interaction term. Ribbons depict SEM. Significant asymmetry
trajectories were downsampled to a lower resolution template (fsaverage5; N vertices = 10,242) and a dissimilarity matrix based on the distance between
trajectories at every vertex pair (computed by sum of least squares) was obtained and submitted to partition around medoids (PAM) clustering. e Mean
silhouette width was used to determine the optimal partition number. LH left hemisphere, RH right hemisphere.

                                                                                 (i.e., hemispheric differences in rates of thinning were relative;
                                                                                 also indexed by crossing trajectories; Fig. 3d). Overall, findings in
                                                                                 the discovery sample indicate that changes in cortical thickness
                                                                                 asymmetry are a feature of aging, and that accelerated thinning of
                                                                                 the thicker hemisphere leads to extensive loss (or reversal) of
                                                                                 asymmetry in older age.

                                                                                 Replication analyses. We next tested whether the clustering of
Fig. 2 Vertex-wise GAMM effects. a Significance map for age-related
                                                                                 asymmetry trajectories was reliable across four independent
changes in asymmetry in the LCBC discovery sample (2577 observations;
                                                                                 longitudinal adult lifespan cohorts (Cambridge Center for Aging
Age × Hemisphere GAMM interaction; one-sided F-test). b Mean thickness
                                                                                 and Neuroscience (Cam-CAN), Berlin Study of Aging-II (BASE-
asymmetry for the discovery sample, irrespective of age (main effect of
                                                                                 II), BETULA, and Dallas Lifespan Brain Study (DLBS): described
Hemisphere; two-sided test). Only regions showing significant asymmetry
                                                                                 in Supplementary Table 1 and Fig. 1b). Clustering solutions in
are shown. Warm and cold colors indicate leftward and rightward thickness
                                                                                 Cam-CAN, BASE-II, and BETULA exhibited highly similar mean
asymmetry (mm), respectively. Maps in (a, b) are corrected for multiple
                                                                                 intercept and slope effects to those described in the discovery
comparisons using false discovery rate (FDR)35 at p(FDR) < 0.001. Lat
                                                                                 sample, and mapped onto near-identical regions (Fig. 4). In these,
lateral, Med medial, Inf inferior.
                                                                                 asymmetry-loss effects conformed to the anterior–posterior pat-
                                                                                 tern of general cortical asymmetry in the same manner as in the
                                                                                 discovery sample. Quantitatively, the clustering trajectories in
insular and lateral parietal cortex; Fig. 3d). Only the cingulate                Cam-CAN, BASE-II, and BETULA were comparable to the
region did not conform to this pattern, exhibiting an early left-                clustering trajectories in LCBC (Supplementary Fig. 5). Spatially,
ward asymmetry that increased with age. Importantly, accelerated                 the similarity of clustering results to those observed in the dis-
thinning corresponded to the percentage of cortex lost with age                  covery sample was substantiated by Dice coefficients far higher

NATURE COMMUNICATIONS | (2021)12:721 | https://doi.org/10.1038/s41467-021-21057-y | www.nature.com/naturecommunications                                    3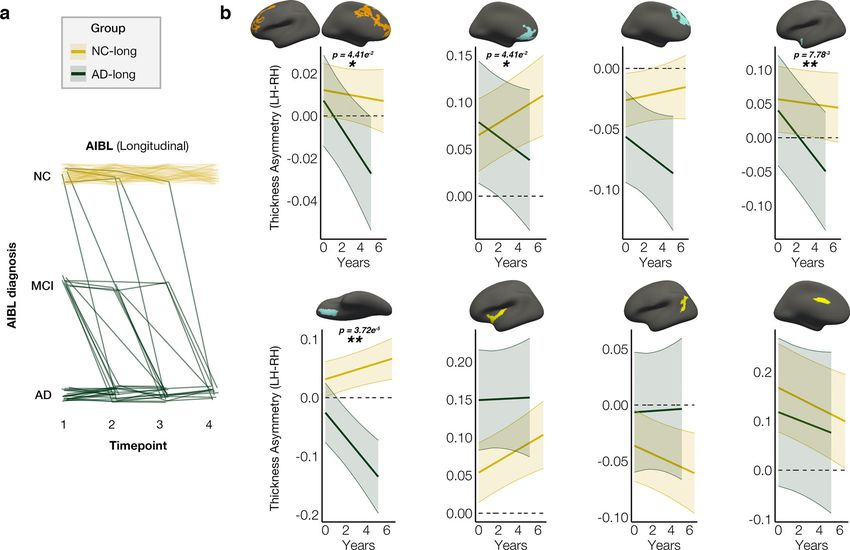
ARTICLE                                                                     NATURE COMMUNICATIONS | https://doi.org/10.1038/s41467-021-21057-y

Fig. 3 Clustered trajectories. a PAM clustering solutions for asymmetry trajectories in the LCBC discovery sample. Each colored line represents a vertex
(N = number of vertices within each solution). Mean trajectories are in gray. Vertices showing leftward asymmetry in early adult life (higher than dotted
line) typically exhibit loss of leftward asymmetry with age (blue plot), whereas vertices showing rightward asymmetry (lower than dotted line) typically
exhibit loss of rightward asymmetry (yellow plot). Importantly, because asymmetry trajectories were computed as the difference between zero-centered
hemispheric trajectories [s(LH-Age)-s(RH-Age)] (cf. Fig. 1d), mean differences between LH and RH thickness (i.e., mean asymmetry/the intercept) are not
taken into account and do not influence the clustering. For visualization of the absolute asymmetry trajectories we added the main effect of Hemisphere,
vertex-wise, and computed the mean asymmetry trajectory of vertices in each clustering solution. b Standard deviations (SD) of the asymmetry trajectories
for the clustering solutions. c Solutions mapped on the surface. d Thinning trajectories plotted separately for LH and RH in regions derived from the
clustering (numbered 1–8). Colors correspond to the solutions in (a), and darker shades indicate LH trajectories. All trajectories were fitted using GAMMs.
Data are residualized for sex, scanner, and random subject intercepts. Trajectories depict mean thickness and ribbons depict 95% confidence intervals.
Smaller plots illustrate percentage change with age for each region. As outliers were removed on a region-wise basis (see “Methods”), the number of
observations underlying plots 1–8 is: 5150, 5154, 5148, 5152, 5150, 5150, 5148, 5154, respectively. LH left hemisphere, RH right hemisphere, Lat lateral, Med
medial, Inf inferior.

than expected by chance (Cam-CAN = 0.54; BASE-II = 0.56;                        predicted longitudinal cognitive change in verbal memory and
BETULA = 0.50; DLBS = 0.41; true expected Dice at random =                      fluid reasoning ability—cognitive domains that show high vul-
0.1, all pperm < 0.001). The clustering in DLBS showed only partial             nerability in aging37. While age explained 29% and 36% of the
replication: contrary to other samples, mPFC and temporal cortex                variance in longitudinal memory and fluid reasoning scores,
clustered with regions characterized by mean rightward asym-                    respectively (sex controlled; Supplementary Fig. 10 and Supple-
metry loss, and intercept effects indicative of early leftward                  mentary Table 4), we observed no significant (pFDR < 0.05)
asymmetry were not evident in the estimated asymmetry trajec-                   effects of thickness asymmetry change on longitudinal change for
tories in DLBS. Vertex-wise GAMM effects also appeared largely                  either cognitive measure in any of the eight ROIs (Supplementary
consistent across samples (see Supplementary Note 2 and Sup-                    Table 5). Furthermore, including all eight asymmetry ROI’s in a
plementary Figs. 6 and 7). Overall, the clustering of thickness                 GAMM did not significantly improve model fit, suggesting that
asymmetry age trajectories in the LCBC discovery sample repli-                  asymmetry change had no additive effect upon longitudinal
cated in three of four longitudinal aging cohorts (see Supple-                  cognitive change (verbal memory p = 0.86; fluid reasoning p =
mentary Figs. 8 and 9 for full results varying the number of                    0.84; see Supplementary Note 3).
clustering partitions in each cohort).

                                                                                Longitudinal AD analysis. Finally, we asked whether in AD,
Cognitive-change analysis. We next a ran GAMM for each ROI                      asymmetry loss is accelerated in regions prone to exhibit asym-
to assess whether longitudinal thickness asymmetry change                       metry change in healthy aging. We used data from the Australian

4                   NATURE COMMUNICATIONS | (2021)12:721 | https://doi.org/10.1038/s41467-021-21057-y | www.nature.com/naturecommunications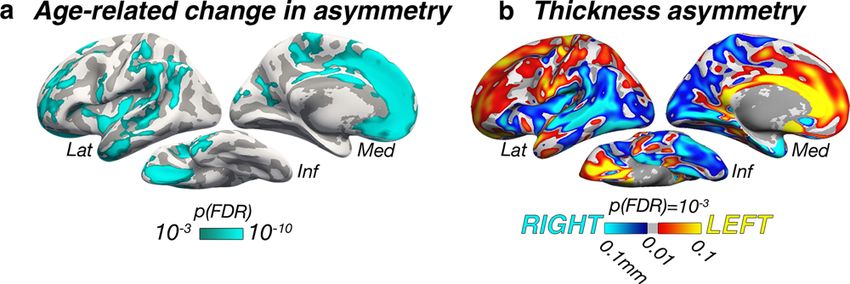
NATURE COMMUNICATIONS | https://doi.org/10.1038/s41467-021-21057-y                                                                           ARTICLE

Fig. 4 Replication. a PAM clustering solutions of asymmetry trajectories in the four replication samples (depicted row-wise). Each colored line represents a
vertex (N = number of vertices within each solution). Mean trajectories are in gray. In three out of four samples, the clustering solutions were highly similar
to the discovery sample (cf. Fig. 3 and Supplementary Fig. 5). b Standard deviations (SD) of the asymmetry trajectories for the clustering solutions.
c Solutions mapped on the surface. All trajectories were fitted using GAMMs. LH left hemisphere, RH right hemisphere.

Imaging Biomarkers and Lifestyle Study of Aging (AIBL; long-                     Discussion
itudinal observations only) to define longitudinal groups of                      We discovered that the cerebral cortex thins asymmetrically
healthy aging and AD individuals (see Fig. 5a and “Methods”),                    across adult life. Age changes in asymmetry almost invariably
and ran LME analyses for each of the eight ROI’s testing for                     reflected progressive asymmetry loss and hence were precipitated
group differences in asymmetry change over time. AD individuals                  by faster thinning of the (previously) thicker homotopic hemi-
were found to exhibit a steeper decline of (leftward) thickness                  sphere. In four out of five longitudinal adult lifespan samples the
asymmetry over time compared to cognitively healthy controls in                  cortex clustered into a highly reproducible pattern that described
most frontal cortical regions, and in anterior temporal cortex                   age trajectories of asymmetry topologically across the cortex. This
(Fig. 5b; see Supplementary Table 6 for full results). Whether or                mapped onto a general anterior–posterior pattern of left–right
not an ROI showed opposite asymmetry in AD at baseline (i.e.,                    thickness asymmetry and revealed loss of both leftward
thicker RH due to LH depletion) corresponded with whether the                    and rightward asymmetry on a similar time scale across adult life,
ROI lifespan trajectories showed opposite asymmetry in older age                 suggesting system-wide loss of asymmetry in aging. Finally,
(cf. Fig. 3d; superior mPFC and orbitofrontal ROI’s). Overall, the               we found that frontal and temporal regions vulnerable to asym-
analyses confirmed that frontal and temporal patterns of asym-                    metry loss in healthy aging exhibit accelerated asymmetry
metry change across healthy adult life are accelerated in AD.                    change in AD.

NATURE COMMUNICATIONS | (2021)12:721 | https://doi.org/10.1038/s41467-021-21057-y | www.nature.com/naturecommunications                                      5
ARTICLE                                                                    NATURE COMMUNICATIONS | https://doi.org/10.1038/s41467-021-21057-y

Fig. 5 Longitudinal AD analysis. Thickness asymmetry change in AD versus healthy aging in the AIBL clinical dementia sample. a x-axis denotes study
timepoints. Single-timepoint diagnoses (y-axis; NC normal controls, MCI mild cognitive impairment, AD Alzheimer’s disease) were used to define two
longitudinal Groups of AD and NC individuals. Each line represents a subject and the color denotes longitudinal group membership (AD-long, in green; NC-
long, in gold). AD-long individuals were diagnosed with AD by their final timepoint, whereas NC-long individuals were classified as healthy at every
timepoint. Note that single-timepoint MCI diagnoses were considered only for the purpose of defining the longitudinal AD group (see “Methods”). b LME
interaction between Group × Time (years) since baseline measurement upon asymmetry in clustering-derived ROI’s (AD-long, N = 41, obs = 110; NC-long,
N = 128, obs = 435; two-sided test). Colored lines depict mean thickness asymmetry (LH–RH) per group and ribbons depict 95% confidence intervals.
Accelerated change in asymmetry was observed in the AD group in frontal and anterior temporal cortical ROI’s. Results were corrected for multiple
comparisons using FDR. Significant FDR-corrected p values are shown on plots (*p(FDR) < 0.05; **
NATURE COMMUNICATIONS | https://doi.org/10.1038/s41467-021-21057-y                                                                     ARTICLE

results and those reported by ENIGMA8 are unclear, one possible                  between healthy and pathological brain aging, and highlight the
explanation could be that longitudinal age changes in asymmetry                  importance of lifespan perspectives for understanding the
effects are weak relative to the large interindividual variation in              pathophysiology of AD.
hemispheric thickness estimates that exists at any age, which may                   The implication that thickness asymmetry is important for
preclude detection of aging effects even in cross-sectional designs              healthy brain function agrees with a recent meta-analysis con-
with thousands of participants (see53). It is also possible this issue           firming that subtly reduced asymmetry is a feature of neurodeve-
may be exacerbated through parcellation-based approaches that                    lopmental disorders16. However, our results also indicate that
average data over large regions of cortex if effects conform poorly              individual differences in regional asymmetry change had little
to the predefined anatomical boundaries. By contrast, our long-                   predictive value upon longitudinal cognitive scores across cogni-
itudinal approach enabled modeling subject-specific variance in                   tively healthy adult life (neither memory nor fluid reasoning ability).
asymmetry over time to more accurately assess aging effects.                     Thus, loss of thickness asymmetry may be more relevant for
Thus, the present study highlights the advantage longitudinal                    advanced cognitive decline—such as that associated with AD—but
aging studies hold when it comes to detecting age-associated                     less sensitive to individual differences in cognitive decline trajec-
brain changes54, as well as the advantage of vertex-wise asym-                   tories across the healthy adult lifespan. Still, future work might
metry approaches. Regardless, the results presented here fit with                 benefit from assessing individual variability in asymmetry decline
the view that brain systems subserving higher-level associative                  using high-dimensional data embedding techniques such as latent
cognition in particular become less specialized and more dis-                    class analysis or t-SNE. Although we note that alternative tests such
organized in aging55.                                                            as cognitive speed measures may be better suited than task accuracy
   The reliable anterior–posterior pattern of general thickness                  for assessing asymmetry–cognition relationships, our results suggest
asymmetry found here (see Supplementary Fig. 7) agrees with                      that asymmetry change may be unlikely to be a sensitive marker for
previous work9,15, has recently been shown in global meta-                       age-related decline at the individual level (similar conclusions have
analyses8, and is compatible with reports of developing thickness                recently been drawn in relation to asymmetry in other contexts63).
asymmetry from birth56. Reproducibility across samples and                       This is also evidenced by the fact that our large longitudinal sample
emerging cross-study consensus also in early development sug-                    sizes were needed to expose small-to-medium effects that never-
gests a genetic influence upon cortical thickness asymmetry56,                    theless translated to consistent gradual changes in asymmetry across
and genetic factors have recently been implicated in the dynamics                adult lifespan samples.
of age-related cortical change across life21. One can speculate                     Some potential caveats should be considered. First, regional
whether age-related asymmetry breakdown is a by-product of                       differences in intracortical myelination of deep cortical layers will
genetic factors encoding the asymmetric organization of cortex57                 affect MRI-based estimates of cortical thickness64, and hence it is
supporting hemispheric specialization of function, and that this                 possible that thickness asymmetry could partly reflect anatomi-
differentiation leads to downstream neural consequences in aging.                cally important differences in cortical myelination between
Though anatomo-functional relationships are likely complex58,                    hemispheres. Second, the estimation of GAMM age trajectories
our results suggest that cortical thickness asymmetry may con-                   will be affected by age-distribution because knot placement is
stitute a viable anatomical marker for key aspects of human                      based upon data density, which differed across discovery and
hemispheric specialization. For example, we found robust evi-                    replication samples. This may explain some heterogeneity in
dence that mPFC asymmetry is particularly vulnerable in aging.                   vertex-wise results between samples (Supplementary Fig. 6) and in
Although implicated in a wide variety of complex cognition, the                  the subsequent clustering of asymmetry trajectories, and also
role of mPFC in executive function and normal memory opera-                      limits the interpretation and replication of exact timings (e.g.,
tions is well established59,60, and deficits in these are considered              acceleration and inflection points) of asymmetry change across
hallmarks of aging37. Although future research is needed to assess               adult life. The GAMM approach implemented here enabled flex-
the specific cognitive relevance of regional thickness asymmetries                ibly fitting nonlinear age effects with relaxed assumptions of the
and structure–function change relationships, the profound                        shape of the adult lifespan trajectories65. While GAMMs are
asymmetry loss observed here raises the possibility that complex                 generally robust to non-normal distributions65, it should be noted
cognitive abilities susceptible to decline in most individuals with              that the trajectories will be interpolated across missing age ranges
advancing age may at least be partly subserved by hemispherically                (i.e., BASE-II; Fig. 1b), and may be somewhat affected by relative
specialized networks.                                                            underrepresentation of specific age groups. This may best be
   Indeed, we found that asymmetry change extended through the                   appreciated by apparent inflection points around mid-adulthood
aging–neurodegeneration continuum. Specifically, we observed                      evident in the asymmetry trajectories in LCBC data (Fig. 3); mid-
accelerated loss of LH frontal and temporal cortices above and                   adulthood is somewhat underrepresented in this sample largely
beyond those observed during healthy aging, illustrating that                    due to naturally occurring selection bias against this age group in
gradual age-related changes in asymmetry are exacerbated in AD.                  longitudinal lifespan research (Fig. 1a). The fact that such inflec-
This agrees with previous longitudinal evidence indicating faster                tion points were not consistently evident in the data from the
LH neurodegeneration in AD30, recent work hinting at systemic                    other cohorts may suggest these were driven by data density, and
AD-related asymmetry loss31, and the regional susceptibility of                  should not be overinterpreted. Relatedly, survivor bias in long-
frontal and temporal cortices to AD pathology23,24. One can                      itudinal aging studies will also affect the estimation of lifespan
speculate whether and to what degree faster LH degradation                       trajectories, and this could be one candidate explanation for the
tracks to an asymmetric presence of other AD biomarkers, such                    lack of full replication in DLBS. That is, if DLBS is more biased to
as neurofibrillary tangles, as patterns of cortical thinning in AD                recruiting high-performing older adults, this could preclude
largely overlap with tau deposition24,61. Future research could                  replication of the lifespan trajectories, and varying degrees of age-
also assess whether and how cortical asymmetry change in AD                      related pathology in later life could explain some of the differences
might co-occur with asymmetric neurodegeneration of sub-                         in the lifespan reduction of asymmetry observed across samples.
cortical brain structures vulnerable in AD62. Here, we show the                  This would also agree with our observation that individuals who
notion that characteristic changes in cortical structure in AD are               either had or were later diagnosed with AD (and hence may have
also observed, though to a minor degree, in cognitively normal                   been classed as cognitively normal at one or more timepoints)
aging can also be extended to include thickness asymmetry23–25.                  exhibited a higher reversal of the group-average asymmetry pat-
Hence, the present findings suggest a continuity of change                        tern at baseline. Third, because GAMMs estimate trajectories as a

NATURE COMMUNICATIONS | (2021)12:721 | https://doi.org/10.1038/s41467-021-21057-y | www.nature.com/naturecommunications                              7
ARTICLE                                                                          NATURE COMMUNICATIONS | https://doi.org/10.1038/s41467-021-21057-y

combination of longitudinal and cross-sectional effects, the                         MRI acquisition. Discovery sample (LCBC) data consisted of T1-weighted (T1w)
inclusion of more timepoints and longer follow-up intervals will                     magnetization prepared rapid gradient echo sequences collected on two scanners at
                                                                                     Oslo University Hospital; a 1.5 Tesla (T) Avanto and a 3 T Skyra (Siemens Medical
better approximate the true longitudinal trajectories. Fourth, to                    Solutions, Germany). The number of Avanto and Skyra T1w scans was 832 and
ensure clustering reliability, we excluded small clusters assumed to                 1745, respectively. MRI acquisition parameters for all samples are summarized in
be more prone to noise. Yet we also observed consistent vertex-                      Supplementary Table 3.
wise effects in smaller regions of cortex that violated this
assumption (e.g., parahippocampal gyrus; Supplementary Fig. 6),                      MRI preprocessing. Cortical reconstruction of the anatomical T1w images was
and thus cannot exclude other, more focal changes in asymmetry                       performed with FreeSurfer’s longitudinal pipeline (v6.0.0, http://surfer.nmr.mgh.
potentially informative for cognitive decline in aging. Fifth,                       harvard.edu/wiki)71 on the Colossus computing cluster at the University of Oslo.
                                                                                     This fully automated pipeline yields a reconstructed surface map of cortical
because the clustering distributes all vertices among a given                        thickness estimates for each participant and timepoint using robust inverse con-
number of solutions, the trajectories of some vertices may not fit                    sistent registration to an unbiased within-subject template72 (see Supplementary
well within a given solution despite statistically fitting best to that               Methods). A high-resolution symmetrical surface template (LH_Sym)33 was used
solution. Consequently, the cluster solutions largely inform about                   to resample the FreeSurfer-estimated cortical thickness maps of the LH and RH of
the average trends rather than the asymmetry trajectories of                         each participant into a common analysis space. This procedure achieves precise
                                                                                     vertex-wise alignment between cortical hemispheres (see Fig. 1c and Supplemen-
individual regions, which showed more heterogeneity in shape.                        tary Fig. 1). LH_Sym was created from a composite of LH and RH surface models
This forcing may also explain some spatial heterogeneity in                          in a database enriched in left-handers: the BIL&GIN (https://www.gin.cnrs.fr/en/
clustering across samples. Nevertheless, the clustering protocol—                    tools/lh-sym/)33,34. In symmetrical space, an 8 mm full-width-half-maximum
which was based solely on the age trajectories of asymmetry and                      Gaussian smooth-kernel was applied across the surface to the LH and RH
                                                                                     thickness data.
was blind to the spatial location in cortex—allowed for a concise
description and comparison of the average asymmetry trajectories
evident in each aging cohort.                                                        Asymmetry-change analyses. The analysis pipeline is summarized in Fig. 1d.
                                                                                     Thickness maps were analyzed vertex-wise using GAMMs implemented in R
   Brain asymmetry seems to have arisen under evolutionary                           (v3.5.0; gamm4 package73). We used a factor-smooth GAMM interaction approach
pressure to optimize processing efficiency and is broadly thought                     that allowed fitting a smooth Age trajectory per Hemisphere and testing the
to confer organizational advantages that benefit brain function.                      smooth Age × Hemisphere interaction. Hemisphere was additionally included as a
Here, we show that the asymmetric organization of higher-order                       fixed-effect, Sex and Scanner as covariates-of-no-interest, and a random subject
                                                                                     intercept was included. To minimize overfitting the number of knots was con-
cortical regions in young adulthood decays with advancing age,                       strained to be low (k = 6). Significance of the smooth Age × Hemisphere interac-
and this decay follows a simple general organizing principle: the                    tion was formally assessed by testing for the existence of a difference between the
thicker of the two homotopic cortices thins faster. This principle                   smooth term of Age across Hemispheres. FDR-correction controlling for positive
was highly reproducible across different cohorts and was sig-                        dependency35 was applied to the resulting Age × Hemisphere and Hemisphere
                                                                                     (main effect) significance maps, and the maps were masked at p(FDR) < 0.001.
nificantly accentuated in AD patients. Overall, the present study
may have unveiled the structural basis of a widely suggested
system-wide decline in hemispheric specialization across the adult                   Clustering of asymmetry age trajectories. The linear predictor matrix of the
                                                                                     GAMM was used to obtain asymmetry trajectories [s(LH-Age)-s(RH-Age)]
lifespan in brain systems subserving higher-order cognition, and                     underlying the interaction, computed as the difference between zero-centered
found a potential continuation and acceleration of this                              hemispheric trajectories. After removing the smallest clusters (
NATURE COMMUNICATIONS | https://doi.org/10.1038/s41467-021-21057-y ARTICLE
smooth terms: asymmetry (LH–RH), mean thickness (across hemispheres), and 15. Plessen, K. J., Hugdahl, K., Bansal, R., Hao, X. & Peterson, B. S. Sex, age, and
Age (Sex, Scanner, Test Version controlled; random subject intercept). cognitive correlates of asymmetries in thickness of the cortical mantle across
the life span. J. Neurosci. 34, 6294–6302 (2014).
Longitudinal AD analysis. For AIBL data (April 28, 2015 release) we calculated 16. Postema, M. C. et al. Altered structural brain asymmetry in autism spectrum
thickness asymmetry (LH–RH) on LH_Sym, downsampled to fsaverage5, and disorder in a study of 54 datasets. Nat. Commun. 10, 1–12 (2019).
extracted from clustering-derived ROIs. For each ROI, we ran LME’s with the 17. Fjell, A. M. et al. High consistency of regional cortical thinning in aging across
factors Group and Time (from baseline), and assessed the Group × Time interac- multiple samples. Cereb. Cortex 19, 2001–2012 (2009).
tion to test for group differences in asymmetry change. Age (at baseline), Sex, and 18. Zhou, D., Lebel, C., Evans, A. & Beaulieu, C. Cortical thickness asymmetry
Scanner were included as covariates, and a random subject intercept was included. from childhood to older adulthood. Neuroimage 83, 66–74 (2013).
As only year-of-birth data are available with AIBL, Age was estimated by randomly 19. Long, X., Zhang, L., Liao, W., Jiang, C. & Qiu, B. Distinct laterality alterations
jittering the interval between the halfway date in the year-of-birth and test date. distinguish mild cognitive impairment and Alzheimer’s disease from healthy
aging: statistical parametric mapping with high resolution MRI. Hum. Brain
Mapp. 34, 3400–3410 (2013).
Reporting summary. Further information on research design is available in the Nature
20. Lemaitre, H. et al. Normal age-related brain morphometric changes:
Research Reporting Summary linked to this article.
Nonuniformity across cortical thickness, surface area and gray matter volume?
Neurobiol. Aging 33, 617.e1–9 (2012).
Data availability 21. Fjell, A. M. et al. Development and aging of cortical thickness correspond to
All summary-level surface maps supporting the results are available on the Open Science genetic organization patterns. Proc. Natl Acad. Sci. USA 112, 15462–15467
Framework (OSF; DOI 10.17605/OSF.IO/XD7CF). These data can be used to reproduce (2015).
all cohort-specific clustering analyses. The raw MRI data may be available upon 22. Tamnes, C. K. et al. Development of the cerebral cortex across adolescence: a
reasonable request, given appropriate ethical, data protection, and data-sharing multisample study of inter-related longitudinal changes in cortical volume,
agreements. Requests for the raw MRI data can be submitted to the relevant principal surface area, and thickness. J. Neurosci. 37, 3402–3412 (2017).
investigator of each data contributing study54 (https://www.lifebrain.uio.no/). Contact 23. Fjell, A. M. et al. One-year brain atrophy evident in healthy. Aging 29,
details are provided in Supplementary Note 4. Individual-level data availability for some 15223–15231 (2009).
of the samples is restricted as participants have not consented to publicly share their data, 24. Jagust, W. Imaging the evolution and pathophysiology of Alzheimer disease.
and different restrictions apply to different samples. LH_Sym is available at https://www. Nat. Rev. Neurosci. 19, 687–700 (2018).
gin.cnrs.fr/en/tools/lh-sym/. AIBL data are available at https://aibl.csiro.au/research/ 25. Fjell, A. M., McEvoy, L., Holland, D., Dale, A. M. & Walhovd, K. B. Brain
support/ pending application approval and compliance with the data usage agreement. changes in older adults at very low risk for Alzheimer’s disease. J. Neurosci. 33,
8237–8242 (2013).
26. Tucker-Drob, E. M. Cognitive aging and dementia: a life-span perspective.
Code availability Annu. Rev. Dev. Psychol. 1, 177–196 (2019).
All preprocessing and analysis code (together with example simulated data for the main 27. Kim, J. H. et al. Cortical asymmetries in normal, mild cognitive impairment,
analysis) is available at https://github.com/jamesmroe/AgeSym. and Alzheimer’s disease. Neurobiol. Aging 33, 1959–1966 (2012).
28. Donix, M. et al. APOE associated hemispheric asymmetry of entorhinal
Received: 25 June 2020; Accepted: 6 January 2021; cortical thickness in aging and Alzheimer’s disease. Psychiatry Res. 214,
212–220 (2013).
29. Minkova, L. et al. Gray matter asymmetries in aging and neurodegeneration: a
review and meta-analysis. Hum. Brain Mapp. 38, 5890–5904 (2017).
30. Thompson, P. M. et al. Dynamics of gray matter loss in Alzheimer’s disease. J.
Neurosci. 23, 994–1005 (2003).
31. Long, X., Jiang, C. & Zhang, L. Morphological biomarker differentiating MCI
References converters from nonconverters: longitudinal evidence based on hemispheric
1. Damoiseaux, J. S. Effects of aging on functional and structural brain asymmetry. Behav. Neurol. 2018 (2018).
connectivity. Neuroimage 160, 32–40 (2017). 32. Wang, Y. Mixed effects smoothing spline analysis of variance. J. R. Stat. Soc. B
2. Fjell, A. M. & Walhovd, K. B. Structural brain changes in aging: Stat. Methodol. 60, 159–174 (1998).
courses, causes and cognitive consequences. Rev. Neurosci. 221, 187–221 33. Maingault, S., Tzourio-Mazoyer, N., Mazoyer, B. & Crivello, F. Regional
(2010). correlations between cortical thickness and surface area asymmetries: a
3. Koen, J. D., Hauck, N. & Rugg, M. D. The relationship between age, neural surface-based morphometry study of 250 adults. Neuropsychologia 93,
differentiation, and memory performance. J. Neurosci. 39, 1498–1418 (2019). 350–364 (2015).
4. Cassady, K., Ruitenberg, M. F. L., Reuter-lorenz, P. A., Tommerdahl, M. & 34. Marie, D., Maingault, S., Crivello, F., Mazoyer, B. & Tzourio-Mazoyer, N.
Seidler, R. D. Neural dedifferentiation across the lifespan in the motor and Surface-based morphometry of cortical thickness and surface area associated
somatosensory systems. Cereb. Cortex. 30, 1–13 (2020). with Heschl’s Gyri duplications in 430 healthy volunteers. Front. Hum.
5. Park, J. et al. Neural broadening or neural attenuation? Investigating Age- Neurosci. 10 (2016).
related dedifferentiation in the face network in a large lifespan sample. J. 35. Benjamini, Y. & Yekutieli, D. The control of the false discovery rate in
Neurosci. 32, 2154–2158 (2012). multiple testing under dependency. Ann. Stat. 29, 1165–1188 (2001).
6. Park, D. C. & McDonough, I. M. The dynamic aging mind. Perspect. Psychol. 36. Maechler, M., Rousseeuw, P., Struyf, A., Hubert, M. & Hornik, K. Cluster:
Sci. 8, 62–67 (2013). cluster analysis basics and extensions. R package version 2.1.0. https://cran.r-
7. Li, S. -C., Lindenberger, U. & Sikström, S. Aging cognition: from project.org/web/packages/cluster/cluster.pdf (2019).
neuromodulation to representation. Trends Cogn. Sci. 5, 479–486 (2001). 37. Park, D. C. & Reuter-Lorenz, P. The adaptive brain: aging and neurocognitive
8. Kong, X. -Z. et al. Mapping cortical brain asymmetry in 17,141 healthy scaffolding. Annu. Rev. Psychol. 60, 173–196 (2009).
individuals worldwide via the ENIGMA Consortium. Proc. Natl Acad. Sci. 38. Vidal-Pineiro, D. et al. Cellular correlates of cortical thinning throughout the
115, E5154–E5163 (2018). lifespan. Scientific Reports. 10 (2020).
9. Luders, E. et al. Hemispheric asymmetries in cortical thickness. Cereb. Cortex 39. Stark, D. E. et al. Regional variation in interhemispheric coordination of
16, 1232–1238 (2006). intrinsic hemodynamic fluctuations. J. Neurosci. 28, 13754–13764 (2008).
10. Hervé, P. Y., Zago, L., Petit, L., Mazoyer, B. & Tzourio-Mazoyer, N. Revisiting 40. Franzmeier, N. et al. Functional brain architecture is associated with the rate
human hemispheric specialization with neuroimaging. Trends Cogn. Sci. 17, of tau accumulation in Alzheimer’s disease. Nat. Commun. 11, 1–17 (2020).
69 (2013). 41. DeVos, S. L. et al. Synaptic tau seeding precedes tau pathology in human
11. Wang, D., Buckner, R. L. & Liu, H. Functional specialization in the human Alzheimer’s disease brain. Front. Neurosci. 12, 1–15 (2018).
brain estimated by intrinsic hemispheric interaction. J. Neurosci. 34, 42. Peters, A., Sethares, C. & Luebeke, J. I. Synapses are lost during aging in the
12341–12352 (2014). primate. Area 152, 970–981 (2008).
12. Karolis, V. R., Corbetta, M. & Thiebaut de Schotten, M. The architecture of 43. Masliah, E., Mallory, M., Hansen, L., DeTeresa, R. & Terry, R. D. Quantitative
functional lateralisation and its relationship to callosal connectivity in the synaptic alterations in the human neocortex during normal aging. Neurology
human brain. Nat. Commun. 10, 1–9 (2019). 43, 192–197 (1993).
13. Ringo, J. L., Doty, R. W., Demeter, S. & Simard, P. Y. Time is of the essence: a 44. Learmonth, G., Benwell, C. S. Y., Thut, G. & Harvey, M. Age-related reduction
conjecture that hemispheric specialization arises from interhemispheric of hemispheric lateralisation for spatial attention: an EEG study. Neuroimage
conduction delay. Cereb. Cortex. 4, 331–343 (1994). 153, 139–151 (2017).
14. Jacobs, R. A. Computational studies of the development of functionally 45. Cabeza, R. et al. Maintenance, reserve and compensation: the cognitive
specialized neural modules. Trends Cogn. Sci. 3, 31–38 (1999). neuroscience of healthy ageing. Nat. Rev. Neurosci. 19, 701–710 (2018).
NATURE COMMUNICATIONS | (2021)12:721 | https://doi.org/10.1038/s41467-021-21057-y | www.nature.com/naturecommunications 9ARTICLE NATURE COMMUNICATIONS | https://doi.org/10.1038/s41467-021-21057-y
46. Roe, J. M. et al. Age-related differences in functional asymmetry during 72. Reuter, M., Rosas, H. D. & Fischl, B. Highly accurate inverse consistent
memory retrieval revisited: no evidence for contralateral overactivation or registration: a robust approach. Neuroimage 53, 1181–1196 (2010).
compensation. Cereb. Cortex 30, 1129–1147 (2020). 73. Wood, S. & Scheipl, F. gamm4: Generalized Additive Mixed Models using
47. Banks, S. J. et al. Default mode network lateralization and memory in healthy ‘mgcv’ and ‘lme4’. R package version 0.2-5. https://cran.r-project.org/web/
aging and Alzheimer’s disease. J. Alzheimer’s Dis. 66, 1223–1234 (2018). packages/gamm4/gamm4.pdf (2017).
48. Roland, J. L. et al. On the role of the corpus callosum in interhemispheric
functional connectivity in humans. Proc. Natl Acad. Sci. 114, 13278–13283
(2017). Acknowledgements
49. Thiel, A. et al. Direct demonstration of transcallosal disinhibition in language The authors are indebted to Fabrice Crivello, Sophie Maingault, Nathalie Tzourio-
networks. J. Cereb. Blood Flow Metab. 26, 1122–1127 (2006). Mazoyer, and Bernard Mazoyer for their generosity in sharing the surface template
50. Zuo, X. -N. et al. Growing together and growing apart: regional and sex created in the BIL&GIN; a unique database enriched in left-handed individuals for the
differences in the lifespan developmental trajectories of functional homotopy. study of human brain lateralization. The Lifebrain project is funded by the EU Horizon
J. Neurosci. 30, 15034–15043 (2010). 2020 Grant: “Healthy minds 0–100 years: Optimising the use of European brain imaging
51. Sullivan, E. V., Adalsteinsson, E. & Pfefferbaum, A. Selective age-related cohorts (Lifebrain).” Grant agreement number: 732592. In addition, the different sub-
degradation of anterior callosal fiber bundles quantified In vivo with fiber studies are supported by different sources: LCBC: The European Research Council under
tracking. Cereb. Cortex 16, 1030–1039 (2006). grant agreements 283634, 725025 (to A.M.F.), and 313440 (to K.B.W.), and the Nor-
52. Danielsen, V. M. et al. Lifespan trajectories of relative corpus callosum thickness: wegian Research Council (to A.M.F. and K.B.W.) under grant agreement 249931
regional differences and cognitive relevance. Cortex 130, 127–141 (2020). (TOPPFORSK), The National Association for Public Health’s dementia research pro-
53. Fjell, A. M. et al. Self-reported sleep relates to hippocampal atrophy across the gram, Norway (to A.M.F). Some of the data used in the preparation of this article were
adult lifespan—results from the Lifebrain consortium. Sleep 1–15 https://doi. obtained from the Australian Imaging Biomarkers and Lifestyle Flagship Study of Ageing
org/10.1093/sleep/zsz280 (2019). (AIBL) funded by the Commonwealth Scientific and Industrial Research Organisation
54. Walhovd, K. B. et al. Healthy minds 0–100 years: optimising the use of (CSIRO), which was made available at the ADNI database (www.loni.usc.edu/ADNI).
European brain imaging cohorts (“Lifebrain”). Eur. Psychiatry 50, 47–56 The AIBL researchers contributed data but did not participate in analysis or writing of
(2018). this report.
55. Chan, M. Y., Park, D. C., Savalia, N. K., Petersen, S. E. & Wig, G. S. Decreased
segregation of brain systems across the healthy adult lifespan. Proc. Natl Acad. Author contributions
Sci. 111, E4997–E5006 (2014). J.M.R., R.W., D.V.-P., and A.M.F. conceived the study; J.M.R. and D.V.-P. performed
56. Li, G., Lin, W., Gilmore, J. H. & Shen, D. Spatial patterns, longitudinal analysis; Ø.S. contributed statistical expertise; A.M.M. managed cross-site data and
development, and hemispheric asymmetries of cortical thickness in infants relationships; R.A.K. and E.K. managed/procured/transferred Cam-CAN data; U.L. and
from birth to 2 years of age. J. Neurosci. 35, 9150–9162 (2015). S.K. managed/procured/transferred BASE-II data; D.C.P., M.M.R., and H.A.G. managed/
57. de Kovel, C. G. F., Lisgo, S. N., Fisher, S. E. & Francks, C. Subtle left-right procured/transferred DLBS data; L.N. and S.P. managed/procured/transferred Betula
asymmetry of gene expression profiles in embryonic and foetal human brains. data; R.W., D.V.-P., Ø.S., A.M.B., S.D., R.A.K., E.K., S.K., U.L., A.M.M., D.C.P., S.P.,
Sci. Rep. 8, 1–13 (2018). M.M.R., K.B.W., and A.M.F. helped revise paper. R.W. and D.V.-P. provided supervision
58. Ocklenburg, S., Friedrich, P., Güntürkün, O. & Genç, E. Intrahemispheric and reviewed/edited paper drafts; J.M.R. created figures and wrote the paper, with input
white matter asymmetries: the missing link between brain structure and from all authors.
functional lateralization? Rev. Neurosci. 27, 465–480 (2016).
59. Peters, G. J., David, C. N., Marcus, M. D. & Smith, D. M. The medial
prefrontal cortex is critical for memory retrieval and resolving interference. Competing interests
Learn. Mem. 20, 201–209 (2013). The authors declare no competing interests.
60. Bird, C. M., Castelli, F., Malik, O., Frith, U. & Husain, M. The impact of
extensive medial frontal lobe damage on ‘Theory of Mind’ and cognition.
Brain 127, 914–928 (2004).
Additional information
Supplementary information The online version contains supplementary material
61. Xia, C. et al. Association of in vivo [18F]AV-1451 tau PET imaging results
available at https://doi.org/10.1038/s41467-021-21057-y.
with cortical atrophy and symptoms in typical and atypical Alzheimer disease.
JAMA Neurol. 74, 427–436 (2017).
Correspondence and requests for materials should be addressed to J.M.R.
62. Wachinger, C., Salat, D. H., Weiner, M. & Reuter, M. Whole-brain analysis
reveals increased neuroanatomical asymmetries in dementia for hippocampus
Peer review information Nature Communications thanks Clyde Francks and Michel
and amygdala. Brain 139, 3253–3266 (2016).
Thiebaut de Schotten for their contribution to the peer review of this work. Peer reviewer
63. Kong, X. et al. Mapping brain asymmetry in health and disease through the
reports are available.
ENIGMA consortium. Hum. Brain Mapp. 1–15 (2020).
64. Natu, V. S. et al. Apparent thinning of human visual cortex during childhood
Reprints and permission information is available at http://www.nature.com/reprints
is associated with myelination. Proc. Natl Acad. Sci. 116, 20750–20759 (2019).
65. Sørensen, Ø., Walhovd, K. B. & Fjell, A. M. A recipe for accurate estimation of
Publisher’s note Springer Nature remains neutral with regard to jurisdictional claims in
lifespan brain trajectories, distinguishing longitudinal and cohort
published maps and institutional affiliations.
effects. NeuroImage. 226, 117596 (2020).
66. Shafto, M. A. et al. The Cambridge Centre for Ageing and Neuroscience
(Cam-CAN) study protocol: a cross-sectional, lifespan, multidisciplinary
examination of healthy cognitive ageing. BMC Neurol. 14, 1–25 (2014). Open Access This article is licensed under a Creative Commons
67. Bertram, L. et al. Cohort profile: the Berlin aging study II (BASE-II). Int. J. Attribution 4.0 International License, which permits use, sharing,
Epidemiol. 43, 703–712 (2014). adaptation, distribution and reproduction in any medium or format, as long as you give
68. Nilsson, L. G. et al. The betula prospective cohort study: memory, health, and appropriate credit to the original author(s) and the source, provide a link to the Creative
aging. Aging Neuropsychol. Cogn. 4, 1–32 (1997). Commons license, and indicate if changes were made. The images or other third party
69. Kennedy, K. M. et al. Effects of beta-amyloid accumulation on neural function material in this article are included in the article’s Creative Commons license, unless
during encoding across the adult lifespan. Neuroimage 62, 1–8 (2012). indicated otherwise in a credit line to the material. If material is not included in the
70. Ellis, K. A. et al. The Australian Imaging, Biomarkers and Lifestyle (AIBL) article’s Creative Commons license and your intended use is not permitted by statutory
study of aging: Methodology and baseline characteristics of 1112 individuals regulation or exceeds the permitted use, you will need to obtain permission directly from
recruited for a longitudinal study of Alzheimer’s disease. Int. Psychogeriatr. 21, the copyright holder. To view a copy of this license, visit http://creativecommons.org/
672–687 (2009). licenses/by/4.0/.
71. Fischl, B. & Dale, A. M. Measuring the thickness of the human cerebral cortex
from magnetic resonance images. Proc. Natl Acad. Sci. USA 97, 11050–11055
(2000). © The Author(s) 2021
10 NATURE COMMUNICATIONS | (2021)12:721 | https://doi.org/10.1038/s41467-021-21057-y | www.nature.com/naturecommunicationsNATURE COMMUNICATIONS | https://doi.org/10.1038/s41467-021-21057-y ARTICLE The Australian Imaging Biomarkers and Lifestyle Flagship Study of Ageing Colin L. Masters8, Ashley I. Bush8, Christopher Fowler8, David Darby8, Kelly Pertile8, Carolina Restrepo8, Blaine Roberts8, Jo Robertson8, Rebecca Rumble8, Tim Ryan8, Steven Collins8, Christine Thai8, Brett Trounson8, Kate Lennon8, Qiao-Xin Li8, Fernanda Yevenes Ugarte8, Irene Volitakis8, Michael Vovos8, Rob Williams8, Jenalle Baker8, Alyce Russell9, Madeline Peretti9, Lidija Milicic9, Lucy Lim10, Mark Rodrigues10, Kevin Taddei10, Tania Taddei10, Eugene Hone10, Florence Lim10, Shane Fernandez10, Stephanie Rainey-Smith10, Steve Pedrini10, Ralph Martins10, James Doecke11, Pierrick Bourgeat11, Jurgen Fripp11, Simon Gibson11, Hugo Leroux11, David Hanson11, Vincent Dore12, Ping Zhang12, Samantha Burnham12, Christopher C. Rowe13, Victor L. Villemagne13, Paul Yates13, Sveltana Bozin Pejoska13, Gareth Jones13, David Ames14, Elizabeth Cyarto14, Nicola Lautenschlager14, Kevin Barnham15, Lesley Cheng15, Andy Hill15, Neil Killeen16, Paul Maruff17, Brendan Silbert18, Belinda Brown19, Harmid Sohrabi19, Greg Savage20 & Michael Vacher21 8 The Florey Institute, The University of Melbourne, Parkville, VIC, Australia. 9Collaborative Genomics Group, Centre of Excellence for Alzheimer’s Disease Research and Care, School of Medical and Health Sciences, Edith Cowan University, Joondalup, WA, Australia. 10School of Medical and Health Sciences, Edith Cowan University, Joondalup, WA, Australia. 11CSIRO, Herston, QLD, Australia. 12CSIRO, Melbourne, VIC, Australia. 13 Department of Molecular Imaging, Austin Health, Heidelberg, VIC, Australia. 14National Ageing Research Institute, Parkville, VIC, Australia. 15 Bio21 Institute of Molecular Science and Biotechnology, The University of Melbourne, Parkville, VIC, Australia. 16The University of Melbourne, Parkville, VIC, Australia. 17Cogstate Ltd., Melbourne, VIC, Australia. 18St. Vincent Hospital, Fitzroy, VIC, Australia. 19Department of Exercise Science, College of Science, Health, Engineering and Education, Murdoch University, Murdoch, WA, Australia. 20Department of Psychology, Macquarie University, Sydney, NSW, Australia. 21CSIRO, Floreat, WA, Australia. NATURE COMMUNICATIONS | (2021)12:721 | https://doi.org/10.1038/s41467-021-21057-y | www.nature.com/naturecommunications 11
You can also read