Overview of the coordinated ground-based observations of Titan during the Huygens mission
←
→
Page content transcription
If your browser does not render page correctly, please read the page content below
Overview of the coordinated ground-based observations
            of Titan during the Huygens mission
     Olivier Witasse, Jean-Pierre Lebreton, Michael Bird, Robindro Dutta-Roy,
        William Folkner, Robert Preston, Sami Asmar, Leonid Gurvits, Sergei
                                 Pogrebenko, Ian Avruch, et al.

     To cite this version:
    Olivier Witasse, Jean-Pierre Lebreton, Michael Bird, Robindro Dutta-Roy, William Folkner, et al..
    Overview of the coordinated ground-based observations of Titan during the Huygens mission. Journal
    of Geophysical Research. Planets, Wiley-Blackwell, 2006, 111, pp.12. �10.1029/2005JE002640�. �hal-
    00222945�

                                 HAL Id: hal-00222945
                https://hal.archives-ouvertes.fr/hal-00222945
                                     Submitted on 2 Jan 2022

    HAL is a multi-disciplinary open access            L’archive ouverte pluridisciplinaire HAL, est
archive for the deposit and dissemination of sci- destinée au dépôt et à la diffusion de documents
entific research documents, whether they are pub- scientifiques de niveau recherche, publiés ou non,
lished or not. The documents may come from émanant des établissements d’enseignement et de
teaching and research institutions in France or recherche français ou étrangers, des laboratoires
abroad, or from public or private research centers. publics ou privés.
                                              Copyright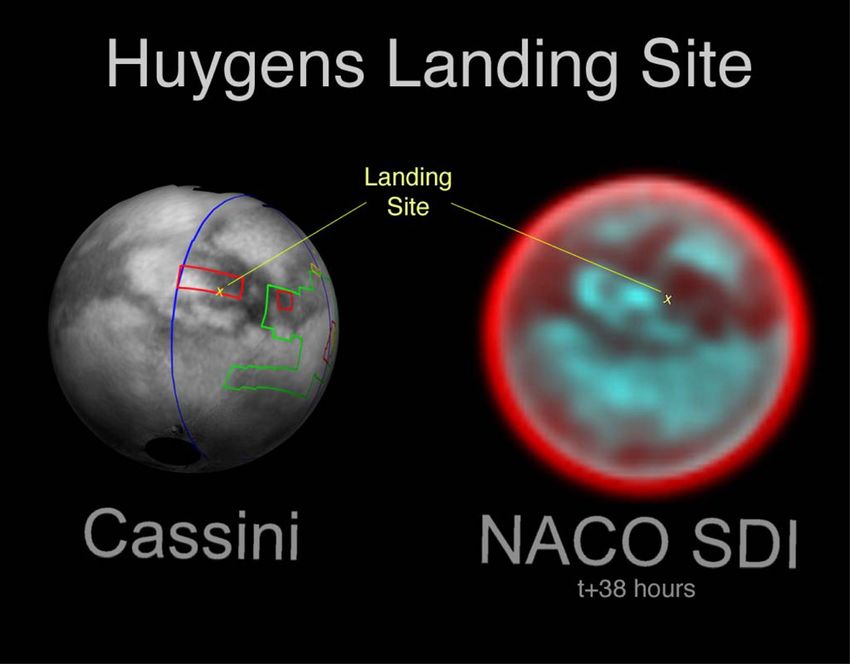
JOURNAL OF GEOPHYSICAL RESEARCH, VOL. 111, E07S01, doi:10.1029/2005JE002640, 2006

Overview of the coordinated ground-based observations of
Titan during the Huygens mission
Olivier Witasse,1 Jean-Pierre Lebreton,1 Michael K. Bird,2 Robindro Dutta-Roy,2
William M. Folkner,3 Robert A. Preston,3 Sami W. Asmar,3 Leonid I. Gurvits,4
Sergei V. Pogrebenko,4 Ian M. Avruch,4 Robert M. Campbell,4 Hayley E. Bignall,4
Michael A. Garrett,4 Huib Jan van Langevelde,4 Stephen M. Parsley,4 Cormac Reynolds,4
Arpad Szomoru,4 John E. Reynolds,5 Chris J. Phillips,5 Robert J. Sault,5
Anastasios K. Tzioumis,5 Frank Ghigo,6 Glen Langston,6 Walter Brisken,7
Jonathan D. Romney,7 Ari Mujunen,8 Jouko Ritakari,8 Steven J. Tingay,9
Richard G. Dodson,10 C. G. M. van’t Klooster,11 Thierry Blancquaert,11
Athena Coustenis,12 Eric Gendron,12 Bruno Sicardy,12 Mathieu Hirtzig,12,13
David Luz,12,14 Alberto Negrao,12,14 Theodor Kostiuk,15 Timothy A. Livengood,16,15
Markus Hartung,17 Imke de Pater,18 Mate Ádámkovics,18 Ralph D. Lorenz,19
Henry Roe,20 Emily Schaller,20 Michael Brown,20 Antonin H. Bouchez,21
Chad A. Trujillo,22 Bonnie J. Buratti,3 Lise Caillault,23 Thierry Magin,23 Anne Bourdon,23
and Christophe Laux23
Received 17 November 2005; revised 29 March 2006; accepted 24 April 2006; published 27 July 2006.

[1] Coordinated ground-based observations of Titan were performed around or during the
Huygens atmospheric probe mission at Titan on 14 January 2005, connecting the
momentary in situ observations by the probe with the synoptic coverage provided by
continuing ground-based programs. These observations consisted of three different
categories: (1) radio telescope tracking of the Huygens signal at 2040 MHz,
(2) observations of the atmosphere and surface of Titan, and (3) attempts to observe
radiation emitted during the Huygens Probe entry into Titan’s atmosphere. The Probe
radio signal was successfully acquired by a network of terrestrial telescopes, recovering a
vertical profile of wind speed in Titan’s atmosphere from 140 km altitude down to the
surface. Ground-based observations brought new information on atmosphere and surface
properties of the largest Saturnian moon. No positive detection of phenomena associated
with the Probe entry was reported. This paper reviews all these measurements and
highlights the achieved results. The ground-based observations, both radio and optical, are
of fundamental importance for the interpretation of results from the Huygens mission.
Citation: Witasse, O., et al. (2006), Overview of the coordinated ground-based observations of Titan during the Huygens mission,
J. Geophys. Res., 111, E07S01, doi:10.1029/2005JE002640.

   1                                                                       12
     Research and Scientific Support Department, ESA, ESTEC, Noord-           LESIA, Observatoire de Paris-Meudon, France.
wijk, Netherlands.                                                         13
                                                                              Laboratoire de Planétologie et de Géodynamique, Nantes, France.
   2                                                                       14
     Radioastronomisches Institut, Universität Bonn, Bonn, Germany.          Observatório Astronómico de Lisboa, Lisbon, Portugal.
   3                                                                       15
     Jet Propulsion Laboratory, California Institute of Technology,           NASA Goddard Space Flight Center, Greenbelt, Maryland, USA.
Pasadena, California, USA.                                                 16
                                                                              National Center for Earth and Space Science Education, Washington,
   4
     Joint Institute for VLBI in Europe, Dwingeloo, Netherlands.        D. C., USA.
   5                                                                       17
     Australia Telescope National Facility, CSIRO, Epping, Australia.         European Southern Observatory, Santiago, Chile.
   6                                                                       18
     National Radio Astronomy Observatory, Green Bank, West Virginia,         Department of Astronomy, University of California, Berkeley,
USA.                                                                    California, USA.
   7                                                                       19
     National Radio Astronomy Observatory, Socorro, New Mexico, USA.          Lunar and Planetary Laboratory, University of Arizona, Tucson,
   8
     Metsähovi Radio Observatory, Helsinki University of Technology,   Arizona, USA.
Kylmälä Finland.                                                         20
                                                                              Division of Geological and Planetary Sciences, California Institute of
   9
     Swinburne University of Technology, Hawthorn, Australia.           Technology, Pasadena, California, USA.
   10                                                                      21
      Observatorio Astronómico Nacional, Alcaláde Henares, Spain.           Caltech Optical Observatories, California Institute of Technology,
   11
      ESA, ESTEC, TEC Directorate, Noordwjik, Netherlands.              Pasadena, California, USA.
                                                                           22
                                                                              Gemini Observatory, Hilo, Hawaii, USA.
                                                                           23
Copyright 2006 by the American Geophysical Union.                             Laboratoire EM2C, Ecole Centrale Paris, CNRS-UPR288, Châtenay-
0148-0227/06/2005JE002640                                               Malabry, France.

                                                                 E07S01                                                                    1 of 12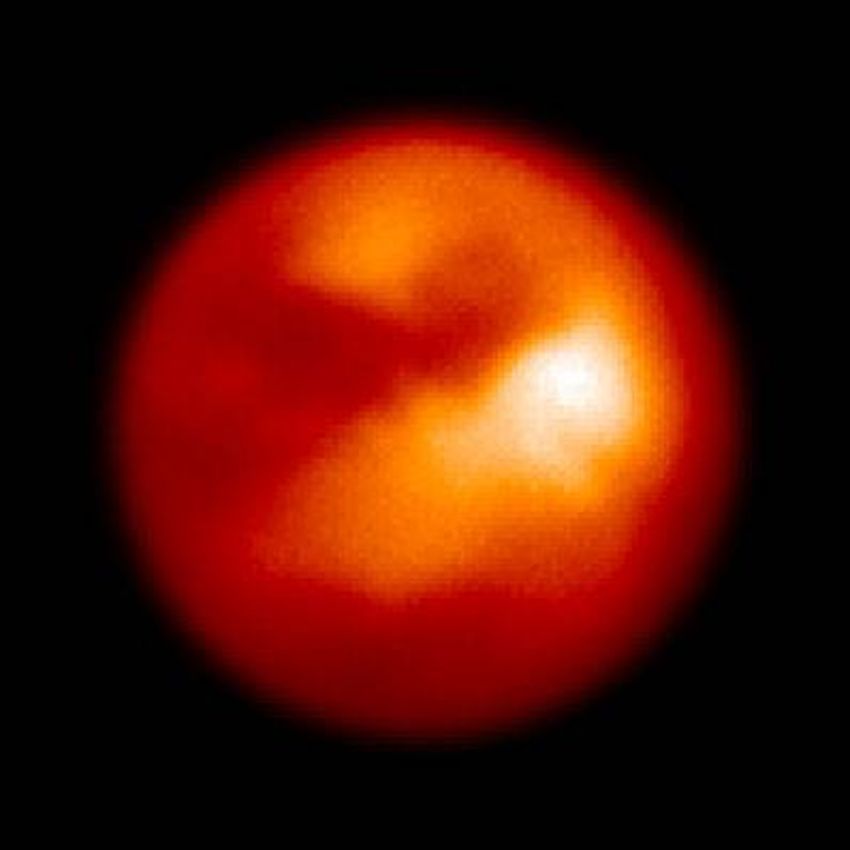
E07S01                      WITASSE ET AL.: TITAN OBSERVATIONS DURING HUYGENS MISSION                                       E07S01

1. Introduction                                                         [6] All these observations in various domains of the
                                                                      electromagnetic spectrum were complementary to the Huy-
  [2] In 2003, the International Astronomical Union Com-
                                                                      gens measurements. The radio astronomy segment proved
mission 16 (Physical Study of Planets and Satellites) ‘‘en-
                                                                      especially valuable following the loss of the Cassini channel
dorsed astronomical observations of the Saturnian system at
                                                                      A receiver in that it largely recovered the primary goal of
the time of the NASA and ESA Cassini/Huygens mission to
                                                                      the Doppler Wind Experiment [Bird et al., 2005; Lebreton
the Saturnian system. The attention of the world-wide
                                                                      et al., 2005; Folkner et al., 2006]. Other astronomical
astronomical community is drawn to the unique scientific
                                                                      observations provided key information on the atmosphere
opportunities presented by the presence of a long-lived
                                                                      and surface properties. Section 2 gives an overview of the
orbiting spacecraft in the Saturnian system and a Titan
                                                                      coordinated set of observations, and section 3 outlines the
Probe. Observations of all types, ground- and space-based,
                                                                      scientific results achieved so far. Engineering achievements
are encouraged during the course of the mission (nominally
                                                                      are summarized in section 4.
2003 – 2008), including observations of Saturn, the rings,
Titan, and the icy satellites.’’ It was therefore decided to
support and coordinate, at the level of the Huygens Project           2. Overview of the Ground-Based Observations
Scientist Team, a series of ground-based observations at the           [7] Many observations of Titan were made during the
time of the Huygens mission. The results from the observ-             Huygens mission. Here, only the coordinated ground-based
ing campaign are presented in this special section.                   observations are briefly described and put into context.
  [3] The Huygens mission was carried out successfully on
14 January 2005. An overview of the mission is given by               2.1. Radio Tracking of the Huygens Signal
Lebreton et al. [2005], while the first scientific results from all     [8] Seventeen radio telescopes listed in Table 1 and
experiments are reported by Bird et al. [2005], Fulchignoni et        displayed in Figure 1 participated in the monitoring of the
al. [2005], Israel et al. [2005], Niemann et al. [2005],              carrier signal driven by the DWE ultra-stable oscillator
Tomasko et al. [2005], and Zarnecki et al. [2005].                    onboard the Huygens Probe and formed the radio astrono-
  [4] At the time of the mission, no fewer than 17 radio              my segment of the mission. This segment consisted of two
telescopes were pointed at Titan and tuned to the frequency           types of observations:
of the Huygens ‘‘channel A’’ carrier signal at 2040 MHz.                [9] 1. All 17 radio telescopes participated in Very Long
[Lebreton et al., 2005]. An Earth-based radio-tracking effort         Base Interferometry (VLBI) observations of the Huygens
on this scale was not planned during the original design of           Probe. Of these, 15 telescopes were tuned to the Huygens
the mission and required major coordination that included             channel A carrier frequency of 2040 MHz, while two others
dry-run observations in August and November 2004. The                 did not observe the Probe at this frequency but were
Huygens radio astronomy ground-based segment was                      involved in the overall ‘‘phasing-up’’ the network of radio
designed to achieve the following three goals: real-time              telescopes by observing the calibrator sources at frequencies
detection of the Huygens carrier signal; Doppler tracking as          not covering the value of 2040 MHz. The goal of the VLBI
an enhancement to the Doppler Wind Experiment (DWE)                   observations, led by the Joint Institute for VLBI in Europe
[Folkner et al., 2006]; acquisition of Very Long Base                 (JIVE), was to reconstruct the projection of the descent
Interferometry (VLBI) data for determining the position of            trajectory on the plane of the sky, with an expected linear
the Probe in the celestial plane.                                     accuracy of the order of 1 km.
  [5] Eight large optical observatories participated in coor-           [10] 2. Six radio telescopes from the entire network of
dinated observations of Titan before, during and after the            seventeen participated in Doppler observations of the Huy-
Huygens mission. The first objective was to carry out                 gens Probe, in parallel with the VLBI observations. The
scientific observations of Titan in various fields: near-             goal of these observations, led by NASA’s Jet Propulsion
infrared studies of the atmosphere and of the surface [de             Laboratory, was to generate a full two-dimensional charac-
Pater et al., 2006; Hartung et al., 2006; M. Hirtzig et al.,          terization of Titan’s horizontal wind field during the Probe’s
Atmospheric and surface features as observed with NAOS/               descent from a combination of the planned Doppler mea-
CONICA at the time of the Huygens’ landing, submitted to              surements on the Probe-Orbiter and Probe-Earth radio links.
Journal of Geophysical Research, 2006 (hereinafter referred           The two largest radio telescopes of the network, the NRAO
to as Hirtzig et al., submitted manuscript, 2006); A. Negrao          R.C. Byrd Green Bank and CSIRO Parkes telescopes were
et al., Two-micron spectroscopy of Huygens’ landing site on           equipped with NASA Deep Space Network Radio Science
Titan with VLT/NACO, submitted to Journal of                          Receivers. These devices were able to digitally record the
Geophysical Research, 2006 (hereinafter referred to as                Huygens’ carrier radio signals and detect them in real-time.
Negrao et al., submitted manuscript, 2006)], determination            Four additional telescopes of the Very Long Baseline Array
of the zonal wind [Luz et al., 2006; Kostiuk et al., 2006;            (VLBA), NRAO Pie Town, Kitt Peak, Owens Valley and
stratospheric haze distribution [Ádámkovics et al., 2006; de        Mauna Kea, were equipped with JPL-built PC-based Digital
Pater et al., 2006], ethane vertical profile determination            Doppler Recorders.
(T. A. Livengood et al., High-resolution infrared spectros-             [11] Both parts of the radio astronomy segment of the
copy of ethane in Titan’s atmosphere in the Huygens epoch,            Huygens mission have been built on the heritage of previ-
Journal of Geophysical Research, 2006; hereinafter referred           ous similar experiments. In particular, the Huygens Doppler
to as Livengood et al., submitted manuscript, 2006) and               tracking experiment with Earth-based radio telescopes
global imaging. The second objective was to detect the                evolved from the JPL-led observations of the Galileo
Probe’s entry into Titan’s atmosphere [Lorenz et al., 2006;           mission in the atmosphere of Jupiter [Folkner et al.,
de Pater et al., 2006].                                               1997a] and earlier observations of Pioneer Venus probes

                                                                2 of 12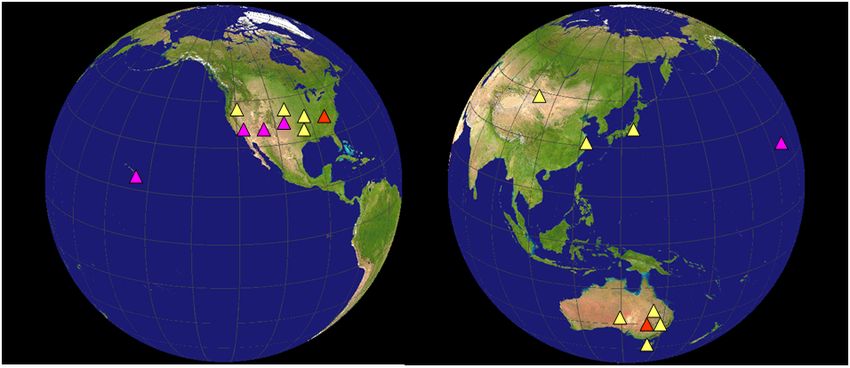
E07S01                          WITASSE ET AL.: TITAN OBSERVATIONS DURING HUYGENS MISSION                                            E07S01

Table 1. Radio Telescopes Involved in the Radio Astronomy Segment of the Huygens Missiona
                                                                                                                   Observing Time (ERT/UTC)
                      Radio Telescope                    Institute, Country                Diameter, m             Start               Stop
1.                  Green Bankb                        NRAO, USA                             100                 09:31:10            12:15:00
2.                  VLBA North Liberty                 NRAO, USA                             25                  09:31:10            13:15:00
3.                  VLBA Fort Davis                    NRAO, USA                             25                  09:31:10            13:45:00
4.                  VLBA Los Alamos                    NRAO, USA                             25                  09:31:10            14:00:00
5.                  VLBA Pie Town                      NRAO, USA                             25                  09:31:10            14:15:04
6.                  VLBA Kitt Peak                     NRAO, USA                             25                  09:31:10            14:15:00
7.                  VLBA Owens Valley                  NRAO, USA                             25                  09:30:09            14:49:14
8.                  VLBA Brewster                      NRAO, USA                             25                  09:31:10            14:48:00
9.                  VLBA Mauna Kea                     NRAO, USA                             25                  09:31:10            16:00:00
10.                 Kashima                            NIICT, Japan                          34                  09:31:10            16:00:00
11.                 Sheshan (Shanghai)                 NAOC &ShAO, China                     25                  10:01:10            16:00:00
12.                 ATCAc                              Australia                             5  22              10:01:10            16:00:00
13.                 Nanshan(Urumqi)c                   NAOC, China                           25                  11:31:10            16:00:00
14.                 Mopra                              ATNF, Australia                       22                  10:10:10            16:00:00
15.                 Parkesb                            ATNF, Australia                       64                  12:26:23            16:00:00
16.                 Hobart                             U Tasmania, Australia                 26                  11:13:10            16:00:00
17.                 Ceduna                             U Tasmania Australia                  30                  10:13:10            16:00:00
  a
      ERT/UTC, Earth Received Time in the UTC scale.
  b
      Provided real-time detection of the Huygens channel A carrier signal at 2040 MHz.
  c
      Used as phase referencing anchors, but did not observe the carrier signal.

[Counselman et al., 1979]. VLBI tracking of planetary                          Huygens mission. 32 exposures spanned over 4 nights were
spacecraft for navigation was developed in the mid-1970s                       performed around 14 January 2005.
and has been frequently used since then [Thornton and                            [15] Three telescopes were used to study the atmosphere
Border, 2003]. VLBI observations of planetary probes have                      and surface of Titan in the near-infrared (all using adaptive
also been used to measure lunar rotational dynamics [King                      optics), by virtue of the weak methane absorption found at
et al., 1976; Slade et al., 1977] and winds on Venus                           certain wavelengths and allowing to probe down to the surface.
[Counselman et al., 1979; Preston et al., 1986; Sagdeyev                         [16] 1. The VLT Yepun telescope observed Titan on 15
et al., 1992]. We note that the VLBI technique offers                          and 16 January by means of the NAOS/CONICA (NACO)
extremely high angular resolution that is inversely propor-                    instrument. Several modes of NACO were used: (1) narrow-
tional to the baseline (distance) between the telescopes                       band filter imaging, gathering information around 1.3 and
involved. At wavelengths of radio domain and baselines                         2 micron; (2) spectroscopy from 2.0– 2.5 micron; (3) Simul-
of up to 10,000 km, the VLBI technique enables a milliarc-                     taneous Differential Imager (SDI) near 1.6 micron; and
second-scale ‘‘sharpness’’ in determination of the position                    (4) Fabry-Perot imaging in the K-band (2.00 – 2.18 microns).
of a point-like source of emission. Recent improvements in                       [17] 2. Observations with the Near-Infrared Camera
the VLBI technique, including wider recording bandwidths                       (NIRC2) camera at the KECK II were scheduled on 14,
and phase-referencing, were employed for the Huygens                           15, 16, and 17 January. The camera was used in high
observations, providing much greater sensitivity than pre-                     angular resolution mode. Several filters were used between
vious VLBI observations of space probes.                                       1.485 and 2.299 mm.
                                                                                 [18] 3. The William Herschel Telescope equipped with
2.2. Observations of Titan                                                     the NAOMI/OASIS system observed on 10, 19, and
  [12] The following telescopes (listed in Table 2) observed                   22 January, in the range 0.8 to 1 microns.
Titan with various scientific objectives:
  [13] 1. The National Astronomical Observatory of Japan
Subaru telescope (Hawaii) was equipped with the NASA
Goddard Space Flight Center Heterodyne Instrument for
Planetary Wind And Composition, HIPWAC [Kostiuk et al.,
2001, 2005]. The goal was to directly measure the magni-
tude and direction of Titan’s stratospheric zonal wind by
measurement of the Doppler-shift of ethane lines near 12 mm
emitted from Titan’s stratosphere. Observations were sched-
uled on 13, 14, and 15 January. Poor weather prevented
measurements on 13 January, permitted only limited mea-
surements on 14 January, but allowed better results on
15 January.                                                                    Figure 1. Approximate locations of Earth-based radio
  [14] 2. The UV-Visual Echelle Spectrograph (UVES) on                         telescopes involved in the radio astronomy segment of the
the Very Large Telescope (VLT) was used to measure the                         Huygens mission. All seventeen telescopes participated in
Doppler-shifted solar spectrum reflected by the Titan’s                        VLBI observations. Two telescopes shown in red (Green
atmosphere in the visible range [Luz et al., 2006]. Zonal                      Bank and Parkes) participated in real-time detection of the
winds in the stratosphere are inferred from such an obser-                     Huygens Channel A carrier signal at 2040 MHz. The latter
vation. Titan was not visible with the VLT at the time of the                  two plus four VLBA telescopes shown in purple partici-
                                                                               pated in Doppler measurements.

                                                                        3 of 12
E07S01 WITASSE ET AL.: TITAN OBSERVATIONS DURING HUYGENS MISSION E07S01
Table 2. Optical Astronomical Observatoriesa
Goal:
Attempt to
Detect
the
Time of Probe Goal:
Facility/Instrument Wavelength Observation Entry Titan Science
Subaru/HIPWAC 12 mm 13, 14, 15 January no zonal wind
measurements,
ethane profile
VLT/UVES 420 – 620 nm 7, 12, 14, 15 January no zonal wind
measurements
VLT/NACO 1.2 – 2.5 mm 18 – 19 December [2004]; 15, 16 January no atmosphere and
range surface
characterization
VLT/SINFONI 1.45 – 2.45 mm 28 February no atmosphere and
range surface
characterization
Keck/NIRC2 several 14, 15, 16, 17 January yes atmosphere and
filters surface
between characterization
1.485 and
2.299 mm
WHT/NAOMI-OASIS 0.8 – 1 mm 10, 19, 22 January no atmosphere and
range surface
characterization
IRTF/TEXES near-IR 14 January yes atmosphere
characterization
HALE IR and canceled (bad weather) yes
visible
GEMINI Near-IR canceled (bad weather) yes
Observatoire du Pic 1.28 mm 9 – 17 January no effects on
du Midi Titan’s surface
of the Saturn’s
opposition
14-inch telescope at visible observations no monitoring of
New Mexico Skies since 2003, cloud activity
Observatory including
the night of
the Huygens
mission
HST/STIS visible canceled yes
Stellar occultation IR and November 2003 no atmosphere
campaign visible characterization
a
Column 4 indicates if the planned observation was related to the detection of the Huygens Probe entry (yes or no). Scientific goals related to Titan are
given in column 5. Subaru is the National Astronomical Observatory of Japan 8.2-m telescope, located at Mauna Kea (Hawaii). HIPWAC is the NASA
Goddard Space Flight Center Heterodyne Instrument for Planetary Wind And Composition. VLT is the European Southern Observatory 8-m Very Large
Telescope, located in Chile. UVES is the UV-Visible Echelle Spectrograph mounted on one of the VLT telescope. NACO is an adaptive optics system
mounted on the Yepun VLT telescope. SINFONI is the new adaptive optics assisted integral-field spectrometer mounted on the Yepun VLT unit. Keck is a
10-m telescope located at the summit of Mauna Kea (Hawaii), operated as a scientific partnership among the California Institute of Technology, the
University of California, and the National Aeronautics and Space Administration. The NIRC2 is an adaptive optics system mounted on the Keck telescope.
WHT is the William Herschel Telescope, 4.2 m telescope, located in La Palma (the Canary Islands). OASIS is an adaptive optics system operating first at
the CFHT (Hawaii) with PUEO and then at the WHT with NAOMI. IRTF is the NASA Infrared Telescope Facility. IRTF is a 3-m telescope located at the
summit of Mauna Kea (Hawaii). TEXES is a high-resolution grating spectrograph mounted on IRTF. HALE is the Palomar 5.1-m telescope, located in
north San Diego, California. Gemini is an 8-m optical/infrared telescope located in Hawaii. The Pic du Midi Observatory is located in the French Pyrenees
Mountains. 1- and 2-m telescopes are being used for professional reasons. HST is the Hubble Space Telescope, and STIS is the Space Telescope Imaging
Spectrograph.
[19] Two additional observations deserve to be men- 2003, 2004 and 2005, including the time of the Huygens
tioned, even if they were not formally part of the coordi- mission.
nated ground-based observations during the Huygens [22] Three articles of this special section deal with obser-
mission: vations performed outside the ‘‘Huygens mission window’’:
[20] 1. The Pic du Midi (France) telescope was observing Ádámkovics et al. [2006] present observations conducted on
the surface of Titan. The interest was the study of the effect 28 February 2005 with the new adaptive optics assisted
of Saturn’s opposition (13 January 2005) on the surface. integral-field spectrometer SINFONI mounted on the VLT.
The observation was carried out in the infrared at Hartung et al. [2006] describe an experiment aiming to map
1.28 micron. solid CO2 ice on the surface, based on data obtained with
[21] 2. A simple whole-disk cloud monitoring program NACO/VLT on 18 and 19 December 2004. B. Sicardy et al.
was developed using a 14-inch telescope located at New (The two Titan stellar occultations of 14 November 2003,
Mexico Skies Observatory. Observations were performed in submitted to Journal of Geophysical Research, 2006; here-
4 of 12E07S01 WITASSE ET AL.: TITAN OBSERVATIONS DURING HUYGENS MISSION E07S01
inversion layer near the 515 ± 5 km altitude level. At that
level, the temperature locally increases by 15 K in only 6 km,
and the peak value of the gradient dT/dz reaches values as
high as +6 K/km. This layer has also been observed by the
HASI experiment aboard Huygens, at around 507 ± 15 km.
Further work is needed to understand the difference in
altitude.
3.2. Zonal Winds
[25] The direct Doppler wind observations on Subaru
[Kostiuk et al., 2006] and VLT [Luz et al., 2006] are
combined with other direct ground-based measurements
and measurements from Cassini DWE to retrieve a first
altitude profile for zonal winds on Titan from 10 to
450 km altitude (Figure 2). A prograde wind is retrieved
throughout and significant increase in wind velocity is seen
in the upper stratosphere. Wind speeds deduced from stellar
occultations (e.g., Sicardy et al., submitted manuscript,
2006) and from thermal maps by CIRS [Flasar et al.,
2005] are in good agreement with the Doppler retrievals.
Current dynamical models qualitatively agree with this
profile and can be further constrained and improved using
the wind altitude profile. Observational and theoretical
model results lead to a better understanding of atmospheric
Figure 2. Velocity retrievals in Titan’s atmosphere [from dynamics of slowly rotating bodies. Evidence of temporal
Kostiuk et al., 2006]: HIPWAC/IRHS [Kostiuk et al., 2006]; and possibly spatial variability as well as the possible probe
UVES [Luz et al., 2006]; DWE [Bird et al., 2005]; mm- of Titan’s mesosphere by HIPWAC provide new directions
wave [Moreno et al., 2005]; and CIRS [Flasar et al., 2005]. for further studies from Cassini as well as from ground-
Different altitudes are probed by the different techniques. based observatories.
Results indicate large wind variation with height and [26] An improved wind profile for the middle and strato-
possibly with time. The Cassini CIRS retrieved velocities sphere and below with higher temporal resolution (2 –
plotted have been adjusted to account for 55 m/s wind at 3 seconds) than that presented in the preliminary analysis
10 mbar measured by the Doppler Wind Experiment. The of Bird et al. [2005] is published in this special section
pre-Cassini [Yelle et al., 1997] (solid line) and Cassini CIRS [Folkner et al., 2006], with a first high vertical resolution
(dashed line) thermal profiles are shown. display and interpretation of the winds near the surface and
planetary boundary layer. The main features are (1) the drop
inafter referred to as Sicardy et al., submitted manuscript, in wind speed to near zero at an altitude between 65 and
2006) report on the two Titan stellar occultations campaign 75 km; (2) the slow and retrograde wind speed between 1
of November 2003. This observation provided important and 5 km altitude, reversing to slightly prograde at the
constraints on the validation of the upper atmosphere model surface; and (3) the 1 m/s eastward surface wind consis-
of Titan prior to the Huygens release. tent with the theoretical prediction of a surface gradient-
wind less than 2 m/s.
2.3. Attempt to Detect the Probe Entry [27] Zonal wind profiles are deduced at about 250 km
[23] Five telescopes (see column 4 of Table 2) were altitude from stellar occultation measurements (Sicardy et
devoted to the detection of the emission formed during the al., submitted manuscript, 2006). A strong asymmetry
Huygens Probe’s entry into Titan’s atmosphere and due to between the northern and southern hemispheres has
dissipation of kinetic energy. Details are given by Lorenz et been found in terms of wind intensity (see Figure 3): about
al. [2006]. The planned observations included (1) the NIRC2 215 m/s at 55N, 150 m/s at the equator, and then zero in the
camera mounted on the KECK II telescope (Hawaii); (2) the summer (southern) hemisphere.
TEXES high-resolution spectrometer on IRTF (Hawaii);
(3) the Near InfraRed Imager on the Gemini telescope 3.3. Atmospheric Density and Composition
(Hawaii); (4) the Palomar Double Spectrograph on the Hale [28] (Sicardy et al., submitted manuscript, 2006, Figure 8)
telescope (California); and (5) the Space Telescope Imaging report on stratospheric density profiles. There is a good
Spectrograph (STIS) on board the HST. agreement between the retrieved profiles and Yelle’s engi-
neering model predictions in the 400– 500 km altitude range
[Yelle et al., 1997]. However, a closer inspection shows that
3. What do These Observations Bring to Our the density profiles are about 35% denser (at a given
Understanding of Titan? altitude) than Yelle’s profile (or about 15 km higher, for a
3.1. Stratospheric Temperatures given density). Considering the uncertainty domain, this
[24] Sicardy et al. (submitted manuscript, 2006) derived discrepancy remains nevertheless marginal.
temperature profiles between 400 and 600 km height (see [29] The vertical distribution of ethane is discussed by
their Figure 9). The most interesting feature is a sharp Livengood et al. (submitted manuscript, 2006), based on
5 of 12E07S01 WITASSE ET AL.: TITAN OBSERVATIONS DURING HUYGENS MISSION E07S01
Figure 3. (top) Two occultation light curves observed on 14 November 2003 from the same site at
Sutherland (South Africa), in two different bands: 0.89 microns at the South Africa Astronomical
Observatory (SAAO) and 2.2 microns at the InfraRed Survey Facility of Nagoya University (IRSF). The
differences in the central flashes are solely due to the differential extinctions of the hazes, which become
more and more transparent at longer IR wavelengths. (bottom) Zonal wind profile derived from the
November 2003 central flash analysis (solid black curve), compared to the Cassini-CIRS profile (red
dash-dots) obtained one year later. The wind profile is also compared with other profiles obtained in the
previous years (Sicardy et al., submitted manuscript, 2006).
high-resolution infrared spectroscopy performed with the which has a steady gradient through the mesosphere,
Subaru telescope and the HIPWAC instrument. The ob- reaches a similar concentration at about 440 km above
served morphology of the C2H6 spectroscopic signature the stratopause.
differs significantly from earlier observations. The spectros-
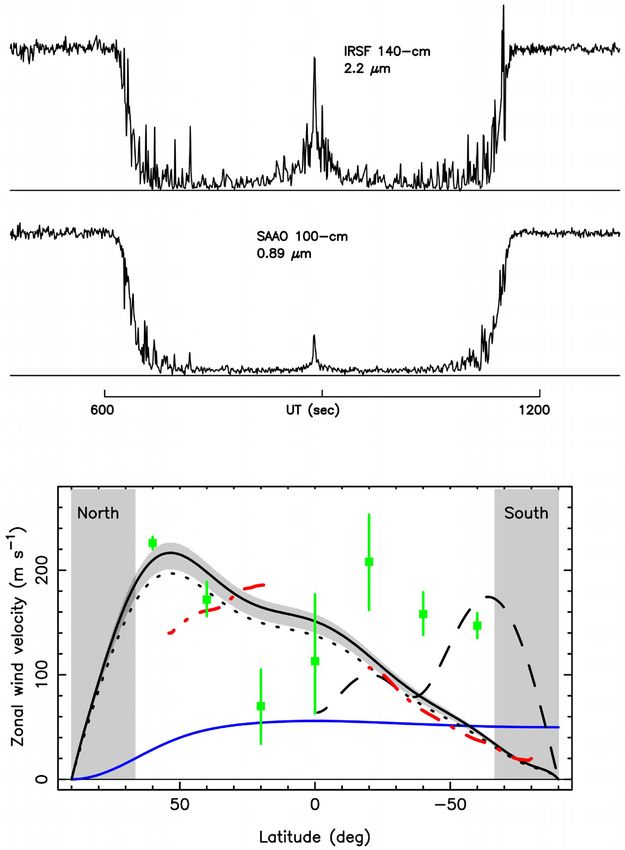
copy favors a vertical distribution of C2H6 that is enhanced 3.4. Cloud Activity
in the mesosphere. An ethane mole fraction of 9.4 ± 2.0 to [30] The Keck II captured Titan some moments after the
10.8 ± 2.4 parts per million by volume (ppmv) is retrieved Huygens Probe reached its target (Figure 4). No clouds
for the stratosphere, depending on which of two acceptable were detected on that day. A feeble cloud appeared on
mole fraction profiles is assumed. These concentrations 15 January and remained visible through 17 January. The
are consistent with earlier retrievals from IR heterodyne bright large southern pole feature observed in Titan’s
spectroscopy. An enhanced mole fraction in the meso- atmosphere since 1999 and until recently with adaptive
sphere of 120 ± 30 ppmv is found with a profile that optics is not evident either in the VLT/NACO data on
assumes differing vertically uniform concentrations in the 15 or 16 January. The brightness observed at the location
stratosphere and mesosphere. The other acceptable profile, where it usually appears (at 2.12 micron anyway) is about
6 of 12E07S01 WITASSE ET AL.: TITAN OBSERVATIONS DURING HUYGENS MISSION E07S01
beginning of seasonal change and/or could be related to
the large cloud event of October 2004.
3.5. Haze Distribution
[32] The tropospheric haze enhancement near the South
Pole is confined to latitudes above 40S, and aerosol
extinction there is retrieved to be enhanced by a factor
of 1.7 relative to the latitude of the Huygens landing site
[Ádámkovics et al., 2006]. The stratospheric extinction is
measured to increase linearly at a rate of 0.65 ± 0.05% per
degree latitude from 40S into the Northern mid latitudes.
Both of these values have been determined in the context of
the Huygens/DISR measurement that demonstrate a con-
stant tropospheric haze extinction. The observations pre-
sented here reveal that the tropospheric haze enhancement
observed in 2001, shortly before the summer solstice at the
South Pole (in October 2002), has thinned and is far less
prominent than in 2005. However, the interpretation by
Ádámkovics et al. [2004] of an enhancement specifically
near the altitude of the tropopause must be revised in light
of the Huygens/DISR measurements, and further observa-
tions are necessary to show if indeed there is a preferential
altitude in the troposphere at which the extinction enhance-
Figure 4. Keck image. Near-infrared surface image of ment occurs. The redistribution of tropospheric haze is a
Titan captured with Keck adaptive optics system moments new example of large-scale aerosol dynamics, like the
after the Huygens Probe reached its target. The bright and seasonal stratospheric haze asymmetry that has been ob-
dark patterns on Titan’s surface may be regions of solid ice served, for example, from the Hubble Space Telescope
and of liquid hydrocarbons. [Lorenz et al., 2004] and from the ground [Gibbard et al.,
2004].
10% brighter with respect to the rest of the limb, and since 3.6. Surface
this is our intrinsic error bar here for the Fabry-Perot [33] The dark/bright surface contrast analysis at different
Interferometer, Hirtzig et al. (submitted manuscript, 2006) wavelengths indicated perhaps the presence of coarser
cannot claim a detection. The regular Narrow-Band filters grained frost in the dark areas compared to the bright
do not see any hint for such a feeble phenomenon, regions, and/or the presence of additional absorbers in these
confirming the lack of cloud activity above the South Pole dark areas, such as NH3 and/or NH4SH frost [de Pater et al.,
of Titan. On the other hand, the NACO images clearly show 2006; Hirtzig et al., submitted manuscript, 2006].
at several wavelengths (in the 2.12– 2.15 micron range) a [34] Surface albedo maps were produced at 2 wave-
feature near the south pole but at higher latitudes (60 – lengths [Ádámkovics et al., 2006, Figure 12], giving com-
70S) on the Western lower side; this feature was reported plementary information on the bright spot detected the by
by Hirtzig et al. [2006] as a companion to the main Cassini/VIMS experiment. Bright spots detected by the
southern cloud or vortex. At the time of the Huygens Very Large Telescope show a spectral response compatible
descent it presents a contrast of 87% with respect to the with methane and water ices (Hirtzig et al., submitted
surrounding areas. manuscript, 2006). Surface albedo of the Huygens landing
[31] This lack of south polar cloud activity on 14 January site was estimated to be 0.12 at 2.03 microns and 0.02 at
2005 is confirmed by the 14 inch telescope photometry 2.12 microns, very close to the values calculated for dark
project and Gemini observations [Schaller et al., 2005]. No areas (Negrao et al., submitted manuscript, 2006).
cloud activity at the Huygens landing site near the equator [35] CO2 ice was not detected at the surface [Hartung et
has ever been observed in adaptive optics images during the al., 2006; Hirtzig et al., submitted manuscript, 2006]. At
past four years of observations. South polar clouds were subearth longitudes 284W and 307W, it was found that a
observed in nearly all adaptive optics images from October partial coverage of CO2 ice does not exceed 7% or 14% for
2001 until November of 2004 when south polar cloud bright and dark surface regions, respectively. At 65 mas
activity dramatically decreased until at least April 2005 angular resolution, the PSF sampled a surface region of
(E. L. Schaller et al., Dissipation of Titan’s south polar 1260 thousand km2. The percentages translate into a maxi-
clouds, submitted to Icarus, 2006). This decrease in south mum area of 90 or 180 thousand km2 filled with solid CO2
polar cloud activity occurred following an extremely large ice. The enigmatic bright 5 micron spot at 80W, 25S
cloud event in October of 2004, where the south polar described by Barnes et al. [2005] is not covered by the
clouds brightened to over fifteen times their typical values longitude range of these observations, but would be easily
[Schaller et al., 2006]. The Huygens landing occurred detectable if it were pure solid CO2 ice [Hartung et al., 2006].
during a quiescent period of cloud activity on Titan which The Huygens landing site was specifically observed by the
lasted for at least five months. The lack of south polar cloud Very Large Telescope (Figure 5). This gives a broader context
activity observed during this time period may be the to the probe measurements (Hirtzig et al., submitted manu-
7 of 12E07S01 WITASSE ET AL.: TITAN OBSERVATIONS DURING HUYGENS MISSION E07S01
[38] 2. Titan astrometry (measurements of the celestial
position and parameters of the motion of the planet).
[39] Folkner et al. [2006] determined the landing position
to be latitude 10.33S, longitude 192.32W (167.68E),
based on the landed Doppler data combined with the
integrated descent trajectory, in excellent agreement with
the initial values published by Lebreton et al. [2005].
4.2. Real-Time Detection of the Huygens Probe’s
Signal
[40] On 14 January 2005, the NRAO R.C. Byrd Green
Bank Telescope directly detected the Huygens carrier signal
at around 10:19:26 Earth Received Time UTC, thus pro-
viding invaluable confirmation of the overall state of the
mission some 6 hours before telemetry data could reach the
Earth via the Cassini relay. The detection indicated that
(1) the Probe entry had been successful, (2) the pilot chute
had been deployed and the back cover had been ejected, (3) the
Figure 5. Comparison between the NACO/SDI image and main parachute had been deployed, and (4) the Probe had
an image taken by Cassini/ISS, showing the high consis- begun to transmit. This was the first indication that the
tency between both measurements. The Cassini image Huygens mission was going to be successful. The CSIRO
shows the Huygens landing site map wrapped around Titan, Parkes Telescope also provided a direct detection of the
rotated to the same position as the January NACO SDI Huygens carrier signal some two hours later and gave the
observations. The Cassini/ISS image is courtesy of NASA, first evidence that the Probe had landed and continued to
JPL, Space Science Institute. The colored lines delineate the transmit after landing. Two hours after the first detection, the
regions that were imaged by Cassini at differing resolutions. Huygens carrier signal was also detected in the Mark 5
The lower-resolution imaging sequences are outlined in [Whitney, 2003] VLBI data recorded at the GBT. This was
blue. Other areas have been specifically targeted for an important diagnostic of the overall performance of the
moderate- and high-resolution mosaicking of surface VLBI part of the radio astronomy segment of the mission.
features. These include the site where the Huygens Probe
4.3. Express e-VLBI Demonstration in Support
has touched down on 14 January 2005 (marked with the
to the Huygens Mission
yellow x (latitude 10.3S; longitude 167.7E), part of
the bright region named Xanadu (easternmost extent of the [41] Recent developments in information and radio as-
area covered), and a boundary between dark and bright tronomy technologies make it possible to transport large
regions. Image and text are part of a press release from ESO amounts of data from telescopes to processing centers
(24 February 2005). The red color corresponds to an thousands of kilometers apart via optical fiber lines. This
atmospheric filter at 1.625 micron, while the blue color kind of data transport enables a modification of the VLBI
corresponds to a filter for the surface at 1.600 and technique called e-VLBI [Szomoru et al., 2004]. Its major
1.575 micron. advantage lies in the elimination of recording media and
shortening the delay between observations and obtaining
results. The ultimate case of e-VLBI is real time VLBI.
script, 2006; Negrao et al., submitted manuscript, 2006). The
Over the last two decades, near-real-time transfer of narrow-
data indicate a high gradient of luminosity in this area.
band VLBI tracking data was exploited by NASA DSN for
tracking planetary probes and other spacecraft with the
4. Engineering/Science Support Achievements transfer data rates of up to several Mbit/s [Thornton and
4.1. Support in the Determination of the Huygens Border, 2003].
Trajectory and Attitude [42] Since 2003, several observatories involved in Huy-
[36] Data from the VLBI and Doppler ground-based radio gens VLBI tracking and JIVE were actively involved in
observations of the probe are the key to the determination of wide-band e-VLBI research and development projects,
the probe trajectory and other dynamical characteristics. including various demonstration tests with the transfer data
Measurements of both the Probe plane of sky motions, from rate of several hundreds Mbit/s. It was decided to apply the
the VLBI data, and the Probe-Earth relative velocities, from e-VLBI technique for a subset of Huygens VLBI tracking
the Doppler observations, are being used. The VLBI data data, using high speed transmission and near real-time
analysis indicates that the probe trajectory in the plane of processing. Of the 17 radio telescopes listed in Table 1,
the sky will be determined to an accuracy of about 1 km two (the CSIRO Parkes Telescope and Mopra, both
[Pogrebenko et al., 2004]. The radio data set will also operated by the Australia Telescope National Facility,
provide in the near future additional pieces of information: ATNF), were chosen for the Huygens e-VLBI demonstra-
[37] 1. Measurements of the carrier signal frequency are tion. Huygens tracking at Parkes and Mopra was conducted
being used to constrain some attitude parameters of the using the LBA’s hard-disk recording system, based on the
Huygens Probe during its descent, namely the Probe pen- Metsähovi VERSUSI input cards [Dodson et al., 2004].
dulum motion and spin. These parameters are needed for a Immediately after completion of the Huygens observations
careful analysis of the scientific payload data set. (late at night, local time in Australia), a charter plane flew
8 of 12E07S01 WITASSE ET AL.: TITAN OBSERVATIONS DURING HUYGENS MISSION E07S01
Table 3. Importance of Ground-Based Observations in Coordination With in Situ Planetary Missions
Topic Examples Selected References
Preparation of planetary Target selection of cometary
missions missions
Scientific support during Study of Titan’s atmosphere Griffith et al. [2005]
the mission Coustenis et al. [2003,
2005]
Sicardy et al. (submitted
manuscript, 2006)
Relatively low cost of
ground observations to
space missions
Large science returns of a Huygens this special section
joint effort Deep impact Meech et al. [2005]
Extended temporal 1. seasonal change in Lorenz et al. [2004]
coverage Titan’s haze 1992 – 2002 Coustenis et al. [2001]
from Hubble Space Hirtzig et al. [2005]
Telescope observations
2. study of stratospheric Luz et al. [2006]
zonal winds Kostiuk et al. [2006]
Extended spatial or zonal wind measurements Luz et al. [2006]
global coverage with altitude coverage Kostiuk et al. [2006]
complementary to the
Huygens DWE results
Different wavelength range near-infrared observations Lellouch et al. [2004]
above the Huygens DISR Coustenis et al. [2005]
IR spectrometer limit Hirtzig et al. [2006, submitted
manuscript, 2006]
Negrao et al. (submitted
manuscript, 2006)
de Pater et al. [2006]
Ádámkovics et al. [2006]
Technique only possible 1. VLBI radio tracking of Lebreton et al. [2005]
from Earth. Huygens probe and VEGA Preston et al. [1986]
Venus Balloons to Sagdeev et al. [1990]
determine plane-of-sky
probe motions (e.g., for
wind determination)
2. Doppler radio tracking of Bird et al. [2005]
Huygens and Galileo probes Folkner et al. [1997a]
to provide Earth-relative Folkner et al. [2006]
probe velocity (e.g., for
wind determination)
3. Doppler and range radio Folkner et al. [1997b]
tracking of Mars Pathfinder
and Viking landers to
measure Mars rotational
irregularities (e.g., for Mars
interior structure and
seasonal CO2 deposition)
4. radar evidence for liquid Campbell et al. [2003]
surfaces on Titan
Support in case of failure Huygens radio astronomy Bird et al. [2005]
segment following loss of Lebreton et al. [2005]
Channel A Folkner et al. [2006]
Necessary to achieve the Deep Impact mission Meech et al. [2005]
science objectives of a
given planetary mission
Information on Lorenz et al. [2006]
aerothermodynamics during Magin et al [2006]
any atmospheric entry Caillault et al. [2006]
Public outreach, amateur Deep Impact and
community Cassini-Huygens
missions
over the triangle Mopra – Parkes – Sydney to collect and data processor in Dwingeloo, Netherlands. The total amount
deliver disks with the recorded data to the ATNF Head- of about 900 Gbits was transmitted with the average data
quarters in Epping. From there, two 15-min-long data seg- rate of about 300 Mbit/s. In the next step, the data were
ments recorded on one of the background celestial calibrator reformatted remotely at the Helsinki University of Technol-
sources (a quasar) with a data rate of 512 Mbit/s, were ogy from the ‘‘native’’ format for the ATNF telescope to the
transmitted via fiber optic cables over the Pacific, across Mark 5 standard, suitable for correlation at JIVE. Another
North America and further on over the Atlantic to the JIVE 0.5 hours were needed for JIVE staff to detect the interfer-
9 of 12E07S01 WITASSE ET AL.: TITAN OBSERVATIONS DURING HUYGENS MISSION E07S01
ometric ‘‘fringes’’ (response) on the baseline Parkes – provided (or will provide) useful information on the trajec-
Mopra. This detection was achieved about 13 hours after tory of the Huygens probe, which is very important for the
completion of the observations of the Huygens Probe at data interpretation of the probe scientific data set. The real
Parkes and Mopra. time detection of the probe carrier signal during descent
[43] Interferometric fringes on the calibrator source indicated that the probe survived the entry and started
obtained in the Huygens e-VLBI demonstration early in transmitting data. No positive detection of the probe entry
the morning of 15 January coupled with the detection of the was reported. However, lessons learned are published in this
Huygens channel A carrier signal at GBT and Parkes using special section. Comprehensive studies on heat fluxes and
both RSR and VLBI data acquisition during and soon after heat loads were carried out and will be very valuable for
the mission on 14 January, provided a solid proof that the future planetary probe entries. Finally, these observations
goal of the radio astronomy segment of the Huygens represented a ‘‘down-to-Earth’’ aspect of the mission of
mission would be achieved. prime interest to the media and general public.
[44] The ‘‘next morning’’ result of the express processing [48] The recent Deep Impact event is another example of
of data from the radio astronomy segment of the Huygens coordinated ground-based observations [Meech et al.,
mission was an efficient verification of the correctness of 2005]. In this case seven Earth-orbiting spacecraft, a
the overall setup of the experiment, allowing the team to large number of telescopes and the ESA comet chaser
conclude, that the science goal of the experiment would be Rosetta were observing comet 9P/Tempel 1 when hit by
achieved in the course of full data processing. It also the impactor.
demonstrated a high potential of similar high data rate [49] The utility of ground-based (or Earth-based) obser-
VLBI to support navigation of future planetary missions. vations is summarized in Table 3. Future opportunities for
coordinated, supporting and complementary observations to
4.4. Attempt to Detect the Probe’s Entry space missions include: Cassini in the Saturnian system
[45] Because of the STIS failure in August 2004, the HST (end of nominal mission: mid 2008), Mars Express at Mars
observation was canceled. In addition, because of the (mission extended until October 2007), Venus Express at
cloudy weather in California and strong winds at the Mauna Venus (orbit insertion on 11 April 2006, end of nominal
Kea summit, only the two observations with the Keck II and mission in October 2007), Chandrayaan-1, Selene and
IRTF facilities were successful. However, no positive de- Chang’e-1 around the Moon (2007– 2009), Messenger at
tection of the Probe entry was reported. No signal above Venus (flyby) and Mercury, Bepi-Colombo at Mercury,
0.8 mJ at the wavelength of 1.68 mm has been detected [de Rosetta (Mars flyby in February 2007, asteroid flybys in
Pater et al., 2006]. This does not permit to put significant 2008 and 2010, at comet 67P/Churyumov-Gerasimenko
constraints on the emission. Lorenz et al. [2006] provides all 2014– 2015), New Horizons at Jupiter in 2007 and at Pluto
the details, and draws lessons learned for future observa- in 2015.
tions of Probe’s entries. [50] The results presented in this special section represent
[46] The modeling of the Huygens entry flux was the goal the achievements one year after Huygens. It is clear that a
of an extensive set of studies, which took place in 2004 significant part of the data is still being analyzed, and we
[Walpot et al., 2005]. Two articles in this special section expect many more scientific results in the coming months
deal with such studies. Magin et al. [2006] describe a model and years.
that predicts the population of excited electronic states of the
CN and N2 molecules, in order to assess non-equilibrium [51] Acknowledgments. The decision to support and coordinate a
radiation effects. Caillault et al. [2006] present radiative series of optical ground-based observations was taken at the time of the
heat flux predictions for the Probe entry. The most intense Huygens Science Working Team in October 2003 in Graz. We thank all
participants, especially Athena Coustenis and Dennis Matson, for their
emission originates from CN in the violet range. This study support. We thank the observatory directors and telescope allocation panels
evaluates the role of the self-absorption by the plasma in for their endorsement of all these observations. We thank the European
reducing the total emission, and the effect of the chemical funded network EUROPLANET for its support. This research was carried
out in part at the Jet Propulsion Laboratory, California Institute of
composition on the radiative heating. Technology, under contract with NASA. We appreciate the support pro-
vided by the National Radio Astronomy Observatory (NRAO) and the
Australia Telescope National Facility (ATNF). NRAO is operated by
5. Conclusion Associated Universities, Inc., under a cooperative agreement with the
[47] The Earth-based observations performed during or NSF. The ATNF, managed by the Commonwealth Scientific and Industrial
Research Organization (CSRIO), The Joint Institute for VLBI in Europe, is
around the Huygens mission proved to be of fundamental funded by the national research councils, national facilities and institutes of
importance: VLBI and Doppler measurements from the Netherlands (NWO), the United Kingdom (PPARC), Italy (INAF), Sweden
radio astronomy segment were essential in providing mea- (Onsala Space Observatory, National Facility), Spain (IGN), Germany
(MPIfR), and China (National Astronomical Observatories, CAS). The
surements of the Titan wind field during the Probe’s Huygens e-VLBI demonstration would have been impossible without the
descent, which would have otherwise been lost because of efforts of the networking community, who on very short notice provisioned
the telecommunications problem. Observations with adap- a dedicated light path between Australia and JIVE. We thank George
McLaughlin, Steve Maddocks, Mark Prior, and Alan Cowie (AARNet),-
tive optics provided coverage of Titan’s hemisphere where Shaun Amy (CSIRO), Craig Russell (CeNTIE), Hervé Guy and Damir
Huygens landed. The zonal wind was measured at different Pobric(Canarie), Bill Mar (Pacific Northwest GigaPoP), Geoff Lakeman
altitudes by various methods, ideally complementing the (University of Washington), Caroline Carver (MANLAN), and Dennis
Doppler Wind Experiment. Other scientific results were Paus(SURFnet). Part of this work was funded through grants AST-0205893
from the National Science Foundation and NNG05GH63G from NASA to
achieved concerning stratospheric temperatures, density the Univ. of California, Berkeley. David Luz acknowledges financial
and composition, cloud activity, haze distribution, surface support from Fundação para a Ciência e a Tecnologia, Portugal (fellowship
albedo and composition. VLBI and Doppler measurements PRAXIS XXI/BPD/3630/2000 and project POCI/CTE-AST/57655/2004).
Alberto Negrão is supported by the FCT Ph.D. scholarship SFRH/BD/
10 of 12E07S01 WITASSE ET AL.: TITAN OBSERVATIONS DURING HUYGENS MISSION E07S01
8006/2002. HIPWAC measurements were supported by the NASA Plan- Kostiuk, T., T. A. Livengood, T. Hewagama, G. Sonnabend, K. E. Fast,
etary Astronomy Program. Olivier Witasse thanks Sushil Atreya for useful K. Murakawa, A. T. Tokunaga, J. Annen, D. Buhl, and F. Schmülling
suggestions. (2005), Titan’s stratospheric zonal wind, temperature, and ethane abun-
dance a year prior to Huygens insertion, Geophys. Res. Lett., 32,
References L22205, doi:10.1029/2005GL023897.
Kostiuk, T., et al. (2006), Stratospheric global winds on Titan at the time of
Ádámkovics, M., I. de Pater, H. G. Roe, S. G. Gibbard, and C. A. Huygens descent, J. Geophys. Res., doi:10.1029/2005JE002630, in press.
Griffith (2004), Spatially-resolved spectroscopy at 1.6 mm of Titan’s Lebreton, J.-P., et al. (2005), An overview of the descent and landing of the
atmosphere and surface, Geophys. Res. Lett., 31, L17S05, doi:10.1029/ Huygens probe on Titan, Nature, 438, 758 – 764.
2004GL019929. Lellouch, E., B. Schmitt, A. Coustenis, and J.-G. Cuby (2004), Titan’s
Ádámkovics, M., I. de Pater, M. Hartung, F. Eisenhauer, R. Genzel, and 5-micron lightcurve, Icarus, 168, 209 – 214.
A. Griffith (2006), Titan’s bright spots: Multiband spectroscopic mea- Lorenz, R. D., P. H. Smith, and M. T. Lemmon (2004), Seasonal change in
surement of surface diversity and hazes, J. Geophys. Res., 111, Titan’s haze 1992 – 2002 from Hubble Space Telescope observations,
E07S06, doi:10.1029/2005JE002610. Geophys. Res. Lett., 31, L10702, doi:10.1029/2004GL019864.
Barnes, J. W., et al. (2005), A 5-Micron-bright spot on Titan: Evidence for Lorenz, R. D., et al. (2006), Huygens entry emission: Observation cam-
surface diversity, Science, 310, 92 – 95. paign, results, and lessons learned, J. Geophys. Res., 111, E07S11,
Bird, M. K., et al. (2005), The vertical profile of winds on Titan, Nature, doi:10.1029/2005JE002603.
438, 800 – 802. Luz, D., et al. (2006), Characterization of zonal winds in the stratosphere of
Caillault, L., et al. (2006), Radiative heating predictions for Huygens entry, Titan with UVES: Ii: Observations coordinated with the Huygens entry,
J. Geophys. Res., doi:10.1029/2005JE002627, in press. J. Geophys. Res., doi:10.1029/2005JE002617, in press.
Campbell, D., et al. (2003), Radar evidence for liquid surfaces on Titan, Magin, T. E., L. Caillault, A. Bourdon, and C. O. Laux (2006), Nonequili-
Science, 302(5644), 431 – 434. brium radiative heat flux modeling for the Huygens entry probe, J. Geo-
Counselman, C., S. Gourevitch, R. King, G. Pettengill, I. Shapiro, R. Miller, phys. Res., 111, E07S12, doi:10.1029/2005JE002616.
J. Smith, R. Prinn, R. Ramos, and P. Leibrecht (1979), Wind velocities on Meech, K. J., et al. (2005), Deep impact: Observations from a worldwide
Venus: Vector determination by radio interferometry, Science, 230, 805 – Earth-based campaign, Science, 310, 265 – 269.
806. Moreno, R., A. Marten, and T. Hidayat (2005), Interferometric measure-
Coustenis, A., E. Gendron, O. Lai, J.-P. Veran, J. Woillez, M. Combes, ments of zonal winds on Titan, Astron. Astrophys., 437, 319 – 328.
L. Vapillon, Th. Fusco, L. Mugnier, and P. Rannou (2001), Images of Niemann, H. B., et al. (2005), The abundances of constituents of Titan’s
Titan at 1.3 and 1.6 microns with adaptive optics at the CFHT, Icarus, atmosphere from the GCMS instrument on the Huygens probe, Nature,
154, 501 – 515. 438, 779 – 784.
Coustenis, A., A. Salama, B. Schulz, S. Ott, E. Lellouch, T. H. Encrenaz, Pogrebenko, S. V., L. I. Gurvits, R. M. Campbell, I. M. Avruch, J.-P.
D. Gautier, and H. Feuchtgruber (2003), Titan’s atmosphere from ISO Lebreton, and C. G. M. van’t Klooster (2004), VLBI tracking of the
mid-infrared spectroscopy, Icarus, 161(2), 383 – 403. Huygens probe in the atmosphere of Titan, in Proceedings of the Inter-
Coustenis, A., M. Hirtzig, E. Gendron, P. Drossart, O. Lai, M. Combes, and national Workshop "Planetary Probe Atmospheric Entry and Descent
A. Negrao (2005), Maps of Titan’s surface from 1 to 2.5 micron, Icarus, Trajectory Analysis and Science", Lisbon, Portugal, 5 – 9 October
177, 89 – 105. 2003, Eur. Space Agency Spec. Publ., ESA-SP 544, 197 – 204.
de Pater, I., M. Ádámkovics, A. H. Bouchez, M. E. Brown, S. G. Gibbard, Preston, R. A., et al. (1986), Determination of Venus winds by ground-
F. Marchis, H. G. Roe, E. L. Schaller, and E. Young (2006), Titan ima- based radio tracking of the VEGA balloons, Science, 231, 1414 – 1416.
gery with Keck adaptive optics during and after probe entry, J. Geophys. Sagdeev, R. Z., et al. (1990), Measurements of the dynamics of air mass
Res., 111, E07S05, doi:10.1029/2005JE002620. motion in the Venus atmosphere with balloon probes—VEGA Project,
Dodson, R., S. Tingay, C. West, C. Phillips, A. Tzioumis, J. Ritakari, Sov. Astron. Lett., 16, 357.
and F. Briggs (2004), The Australian experience with the PC-EVN Sagdeyev, R. Z., et al. (1992), Differential VLBI measurements of the
recorder, in Proceedings of the 7th European VLBI Symposium, edited Venus atmosphere dynamics by balloons—VEGA Project, Astron. Astro-
by R. Bachiller et al., p. 253, Observ. Astron. Nacl., Toledo, Spain. phys., 254, 387.
Flasar, F. M., et al. (2005), Titan’s atmospheric temperatures, winds, and Schaller, E. L., M. E. Brown, H. G. Roe, A. H. Bouchez, and C. A. Trujillo
composition, Science, 308, 975 – 978. (2005), Cloud activity on Titan during the Cassini mission, Proc. Lunar
Folkner, W. M., et al. (1997a), Earth-based radio tracking of the Galileo Planet. Sci. Conf. 36th, abstract 1989.
probe for Jupiter wind estimation, Science, 275, 644 – 646. Schaller, E. L., M. E. Brown, H. G. Roe, and A. H. Bouchez (2006), A large
Folkner, W. M., et al. (1997b), Interior structure and seasonal mass redis- cloud outburst at Titan’s south pole, Icarus, 182, 224 – 229.
tribution of Mars from radio tracking of Mars Pathfinder, Science, 278, Slade, M. A., R. A. Preston, A. W. Harris, L. J. Skjerve, and D. J. Spitzmesser
1749 – 1752. (1977), ALSEP-Quasar Differential VLBI, Moon, 17, 133.
Folkner, W. M., et al. (2006), Winds on Titan from ground-based tracking Szomoru, A., A. Biggs, M. Garrett, H. J. van Langevelde, F. Olnon,
of the Huygens probe, J. Geophys. Res., 111, E07S02, doi:10.1029/ Z. Paragi, S. Parsley, S. Pogrebenko, and C. Reynolds (2004), From
2005JE002649. truck to optical fibre: The coming-of-age of eVLBI, in Proceedings
Fulchignoni, M., et al. (2005), In situ measurements of the physical char- of the 7th European VLBI Symposium, edited by R. Bachiller et al.,
acteristics of Titan’s atmosphere, Nature, 438, 785 – 791. p. 257, Observ. Astron. Nacl., Toledo, Spain.
Gibbard, S. G., I. de Pater, B. A. Macintosh, H. G. Roe, C. E. Max, E. F. Thornton, C. L., and J. S. Border (2003), Radiometric Tracking Techniques
Young, and C. P. McKay (2004), Titan’s 2 mm surface albedo and haze for Deep-Space Navigation, John Wiley, Hoboken, N. J.
optical depth in 1996 – 2004, Geophys. Res. Lett., 31, L17S02, Tomasko, M. G., et al. (2005), Rain, winds and haze during the Huygens
doi:10.1029/2004GL019803. probe’s descent to Titan’s surface, Nature, 438, 765 – 778.
Griffith, C., et al. (2005), Observations of Titan’s mesosphere, Astrophys. Walpot, L., L. Caillault, C. O. Laux, R. Molina, and T. Blancquaert (2005),
J., 629(1), L57 – L60. Huygens entry heat flux prediction, paper presented at 3rd International
Hartung, M., T. M. Herbst, C. Dumas, T. Owen, and A. Coustenis (2006), Planetary Probe Workshop (IPPW-3), Am. Inst. of Aeronaut. and Astro-
Limits to the abundance of surface CO2 ice on Titan, J. Geophys. Res., naut., Attica, Greece, July.
111, E07S09, doi:10.1029/2005JE002642. Whitney, A. R. (2003), Mark 5 disk-based Gbps VLBI data system, in New
Hirtzig, M., A. Coustenis, O. Lai, E. Emsellem, A. Pecontal-Rousset, Technology in VLBI, edited by Y. C. Minh, ASP Conf. Ser. 306, p. 123,
P. Rannou, A. Negrao, and B. Schmitt (2005), Near-infrared study Astron. Soc. of the Pac., San Francisco, Calif.
of Titan’s resolved disk in spectro-imaging with CFHT/OASIS, Pla- Yelle, R. V., D. Strobel, E. Lellouch, and D. Gautier (1997), Engineering
net. Space Sci., 53, 535 – 556. models for Titan’s atmosphere, in Huygens: Science, Payload and Mis-
Hirtzig, M., A. Coustenis, E. Gendron, P. Drossart, A. Negrao, M. Combes, sion, edited by J.-P. Lebreton, Eur. Space Agency Spec. Publ., ESA-SP
O. Lai, P. Rannou, S. Lebonnois, and D. Luz (2006), Monitoring atmo- 1177, 243 – 256.
spheric phenomena on Titan, Astron. Astrophys., in press. Zarnecki, J. C., et al. (2005), A soft solid surface on Titan as revealed by the
Israel, G., et al. (2005), Complex organic matter in Titan’s atmo- Huygens Surface Science Package, Nature, 438, 792.
spheric aerosols from in situ pyrolysis and analysis, Nature, 438,
796 – 799.
King, R. W., C. C. Counselman III, and I. I. Shapiro (1976), Lunar M. Ádámkovics and I. de Pater, Department of Astronomy, University of
dynamics and selenodesy: Results from analysis of VLBI and laser data, California, 601 Campbell Hall, Berkeley, CA 94720, USA.
J. Geophys. Res., 81, 6251 – 6256. S. W. Asmar, B. J. Buratti, W. M. Folkner, and R. A. Preston, Jet
Kostiuk, T., K. Fast, T. A. Livengood, T. Hewagama, J. Goldstein, Propulsion Laboratory, California Institute of Technology, Pasadena, CA
F. Espenak, and D. Buhl (2001), Direct measurement of winds on 91109. USA.
Titan, Geophys. Res. Lett., 28, 2361 – 2364.
11 of 12You can also read