Out-of-Season Influenza during a COVID-19 Void in the State of Rio de Janeiro, Brazil: Temperature Matters

Page created by Janet Waters
 
CONTINUE READING
Out-of-Season Influenza during a COVID-19 Void in the State of Rio de Janeiro, Brazil: Temperature Matters
Brief Report
Out-of-Season Influenza during a COVID-19 Void in the State
of Rio de Janeiro, Brazil: Temperature Matters
Rohini Nott 1, * , Trevon L. Fuller 2,3 , Patrícia Brasil 3                   and Karin Nielsen-Saines 1

                                            1   Department of Pediatrics, David Geffen School of Medicine at University of California Los Angeles,
                                                Los Angeles, CA 90095, USA; knielsen@mednet.ucla.edu
                                            2   Institute of the Environment & Sustainability, University of California Los Angeles,
                                                Los Angeles, CA 90095, USA; fullertl@g.ucla.edu
                                            3   Laboratorio de Doenças Febris Agudas, Instituto Nacional de Infectologia, Fundação Oswaldo Cruz,
                                                Rio de Janeiro 21040-360, RJ, Brazil; patricia.brasil@ini.fiocruz.br
                                            *   Correspondence: rnott@mednet.ucla.edu

                                            Abstract: An out-of-season H3N2 type A influenza epidemic occurred in the State of Rio de Janeiro,
                                            Brazil during October–November 2021, in between the Delta and Omicron SARS-CoV-2 surges, which
                                            occurred in July–October 2021 and January–April 2022, respectively. We assessed the contribution of
                                            climate change and influenza immunization coverage in this unique, little publicized phenomenon.
                                            State weather patterns during the influenza epidemic were significantly different from the five
                                            preceding years, matching typical winter temperatures, associated with the out-of-season influenza.
                                            We also found a mismatch between influenza vaccine strains used in the winter of 2021 (trivalent
                                            vaccine with two type A strains (Victoria/2570/2019 H1N1, Hong Kong/2671/2019 H3N2) and
                                            one type B strain (Washington/02/2019, wild type) and the circulating influenza strain responsible
                                            for the epidemic (H3N2 Darwin type A influenza strain). In addition, in 2021, there was poor
                                            influenza vaccine coverage with only 56% of the population over 6 months old immunized. Amid
Citation: Nott, R.; Fuller, T.L.; Brasil,   the COVID-19 pandemic, we should be prepared for out-of-season outbreaks of other respiratory
P.; Nielsen-Saines, K. Out-of-Season        viruses in periods of COVID-19 remission, which underscore novel disease dynamics in the pandemic
Influenza during a COVID-19 Void in         era. The availability of year-round influenza vaccines could help avoid unnecessary morbidity and
the State of Rio de Janeiro, Brazil:        mortality given that antibodies rapidly wane. Moreover, this would enable unimmunized individuals
Temperature Matters. Vaccines 2022,         to have additional opportunities to vaccinate during out-of-season outbreaks.
10, 821. https://doi.org/10.3390/
vaccines10050821
                                            Keywords: COVID-19 pandemic; Rio de Janeiro influenza epidemic; climate change; replicative
Academic Editors: Tokiko Watanabe           advantage; out-of-season influenza; influenza epidemic
and Shinji Watanabe

Received: 26 March 2022
Accepted: 20 May 2022
                                            1. Introduction
Published: 23 May 2022
                                                 A horrific case load of COVID-19 cases swept across the world and across Brazil in
Publisher’s Note: MDPI stays neutral
                                            the South American winter of 2021 (June–September), leading to a pandemic surge among
with regard to jurisdictional claims in
                                            susceptible, un-boosted elderly individuals previously immunized with the inactivated
published maps and institutional affil-
                                            virus vaccine, Coronovac (Sinovac Biotech/Butantan Institute, São Paulo, Brazil) [1]. This
iations.
                                            phenomenon was the subject of a number of modeling studies attempting to explain pan-
                                            demic dynamics [2,3]. By spring 2021 (October–December), the outlook had improved
                                            considerably, with COVID-19 cases plummeting dramatically by mid-October [4]. By
Copyright: © 2022 by the authors.           then, a considerable proportion of the population had been boosted by recent natural
Licensee MDPI, Basel, Switzerland.          infection with the Delta strain of SARS-CoV-2 and/or received a booster dose with the
This article is an open access article      Pfizer-BioNTech BNT162b2 (Pfizer-BioNTech, Kalamazoo, MI, USA) mRNA vaccine. By late
distributed under the terms and             spring (October–November 2021), the State of Rio de Janeiro (RJ), a region severely affected
conditions of the Creative Commons          by the COVID-19 pandemic, was reporting zero hospital admissions due to COVID-19 [4].
Attribution (CC BY) license (https://       This brief reprieve in respiratory virus infections was followed by an impactful and com-
creativecommons.org/licenses/by/            pletely unexpected influenza H3N2 epidemic which peaked by late November 2021 [5] and
4.0/).

Vaccines 2022, 10, 821. https://doi.org/10.3390/vaccines10050821                                               https://www.mdpi.com/journal/vaccines
Out-of-Season Influenza during a COVID-19 Void in the State of Rio de Janeiro, Brazil: Temperature Matters
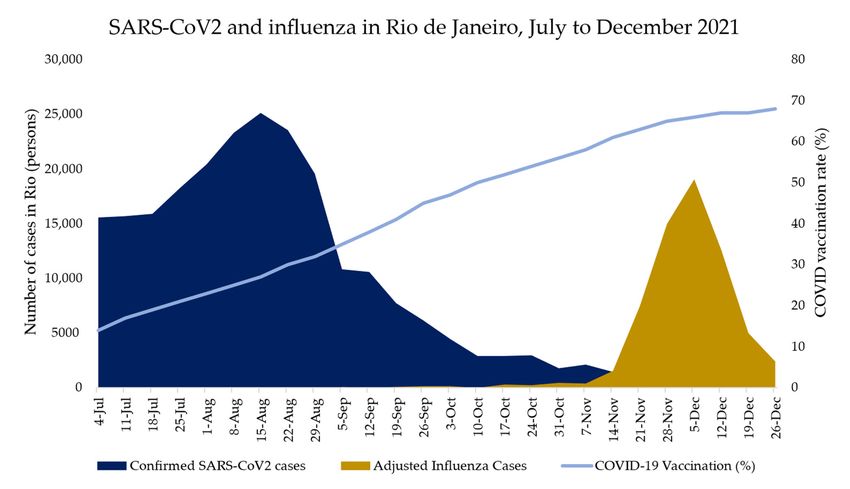
Vaccines 2022, 10, 821                                                                                           2 of 9

                         declined throughout December 2021, disappearing by early January 2022 at which time the
                         SARS-CoV-2 Omicron strain surged in RJ and throughout Brazil [6].
                              This little publicized out-of-season influenza epidemic occurred during a tempo-
                         rary COVID-19 void in between massive Delta and Omicron SARS-CoV-2 surges, which
                         occurred in July–October 2021 and January–April 2022, respectively [7]. We evaluated
                         whether climate change and poor influenza immunization coverage contributed to the
                         genesis of this perfect storm and share findings based on a descriptive analysis of the
                         data considered.

                         2. Materials and Methods
                         2.1. Calculation of Weekly SARS-CoV-2 Case Numbers
                              Data on the number of weekly confirmed state SARS-CoV-2 cases from the epidemi-
                         ologic weeks of 4 July 2021 to 26 December 2021 were obtained from the RJ State Health
                         Department [4]. Confirmed cases were reported to the Health Department based on posi-
                         tive molecular and/or antigen tests identified through the public network of the Brazilian
                         Single Unified Health System (SUS) hospitals, clinics and ambulatory settings, public and
                         private testing sites, private clinics, hospitals and pharmacies distributed throughout the
                         state [4,6].

                         2.2. Calculation of Weekly Influenza Case Numbers
                              We calculated weekly state influenza case numbers based on weekly influenza hospi-
                         talizations reported to the RJ State Health Department from 4 July 2021 to 26 December
                         2021 [6] using CDC methodology [8]. Per the CDC method of estimating the number
                         of influenza cases annually, flu hospitalizations comprise 1.3% of total cases and deaths
                         0.1% of influenza cases [8]. The influenza burden was estimated from CDC data from
                         2018–2019, in which for 29 million symptomatic cases, there were 380,000 hospitalizations
                         and 28,000 deaths due to influenza.

                         2.3. SARS-CoV-2 Immunization Coverage
                              We assessed SARS-CoV-2 vaccination coverage in RJ, which represented the pro-
                         portion of the state population as of 12 years of age who received either two doses
                         of Sinovac-CoronaVac (Sinovac Biotech/Butantan Institute, São Paulo, Brazil), Oxford–
                         AstraZeneca (AstraZeneca, Oxford, UK/Fiocruz, RJ, Brazil) or Pfizer-BioNTech BNT162b2
                         (Pfizer-BioNTech, Kalamazoo, MI, USA) mRNA vaccines or one dose of the Janssen vac-
                         cine (Janssen Biotech, Inc., Horsham, PA, USA), all provided by SUS, which is the only
                         health network through which individuals in Brazil received COVID-19 immunizations.
                         Data on SARS-CoV-2 immunization coverage was obtained from the RJ State Health De-
                         partment [4]. Though the vaccine was only licensed for individuals over 12 years old,
                         weekly SARS-CoV-2 case numbers represent those affected with COVID-19 among the
                         entire state population.

                         2.4. Influenza Immunization Coverage
                              Information about influenza immunization coverage was obtained from the RJ State
                         Health Department [6]. Flu vaccination in Brazil is recommended for all individuals as of
                         6 months of age [9]. Immunization coverage represented the proportion of individuals in RJ
                         state who received one dose of influenza vaccine between May 2021 to August 2021, the an-
                         nual period in which flu vaccines are provided for the state [9]. The vaccine administered in
                         2021 was a trivalent vaccine consisting of two type A influenza strains (Victoria/2570/2019
                         H1N1, Hong Kong/2671/2019 H3N2) and one type B strain (Washington/02/2019, wild
                         type) [10].

                         2.5. Association between Out-of-Season Influenza Outbreak and Climatic Variations
                             To assess the possible association between the out-of-season influenza outbreak and
                         climatic variations, we evaluated temperature measurements from ten representative
Out-of-Season Influenza during a COVID-19 Void in the State of Rio de Janeiro, Brazil: Temperature Matters
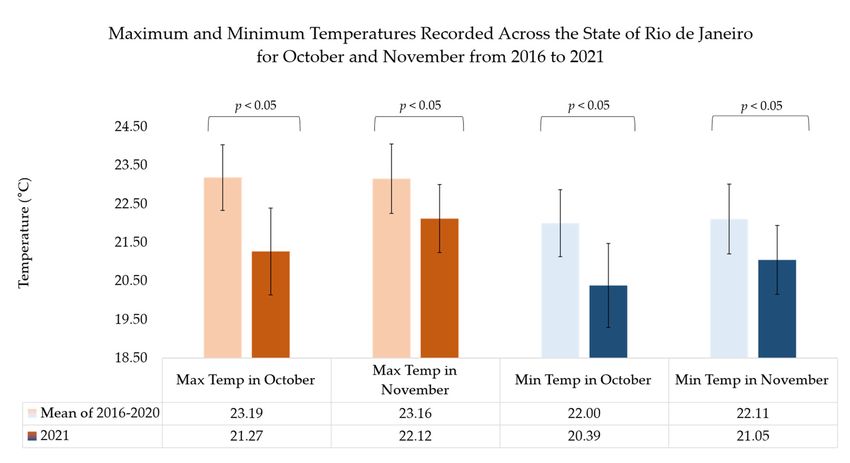
Vaccines 2022, 10, x FOR PEER REVIEW                                                                                                        3 of 9

                                  2.5. Association between Out-of-Season Influenza Outbreak and Climatic Variations
Vaccines 2022, 10, 821                 To assess the possible association between the out-of-season influenza outbreak3 and             of 9
                                  climatic variations, we evaluated temperature measurements from ten representative
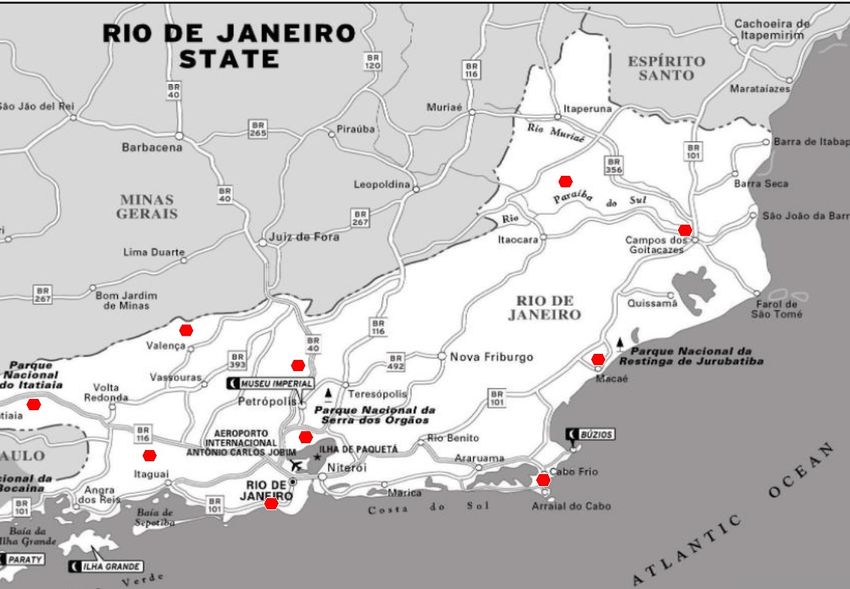
                                  weather stations distributed across the RJ state. These weather stations were: Arraial do
                                  Cabo, Campos
                                 weather   stations dos     Goytacazes,
                                                      distributed   acrossCambuci,     Duque
                                                                            the RJ state.  Thesedeweather
                                                                                                     Caxias,stations
                                                                                                               Macaé,were:
                                                                                                                        Pico Arraial
                                                                                                                               do Couto,do
                                  Resende,   Rio  de  Janeiro,  Seropédica    and  Valença.   These  data   were  available
                                 Cabo, Campos dos Goytacazes, Cambuci, Duque de Caxias, Macaé, Pico do Couto, Resende,       through     the
                                  Brazilian  National     Institute  of Meteorology     [11]   (Figure  1). Maximum
                                 Rio de Janeiro, Seropédica and Valença. These data were available through the Brazilian and   minimum
                                  temperatures
                                 National          in Celsius
                                            Institute           units recorded
                                                       of Meteorology             across1).RJMaximum
                                                                          [11] (Figure        state for October    and November
                                                                                                         and minimum      temperaturesfrom
                                  2016
                                 in     to 2021
                                    Celsius  unitswere     abstracted.
                                                    recorded   across RJFor   comparison
                                                                          state for Octoberof andweather
                                                                                                   November patterns  over tosix
                                                                                                                from 2016        years,
                                                                                                                               2021  werea
                                  Wilcoxon signed
                                 abstracted.           rank test was
                                              For comparison           performed
                                                                  of weather        comparing
                                                                               patterns  over sixvalues
                                                                                                   years,for  maximum
                                                                                                          a Wilcoxon     and minimum
                                                                                                                       signed   rank test
                                  temperatures
                                 was  performedfor     October and
                                                    comparing    valuesNovember     in 2021
                                                                          for maximum      andwith  the mean
                                                                                                 minimum        values for October
                                                                                                             temperatures              and
                                                                                                                             for October
                                  November     for 2016  to 2020  for RJ state. A p-value   less than 0.05  was  considered
                                 and November in 2021 with the mean values for October and November for 2016 to 2020          statistically
                                  significant.
                                 for RJ state. A p-value less than 0.05 was considered statistically significant.

                                  Figure1.1.Representative
                                 Figure     Representativemeteorological
                                                           meteorologicalstations
                                                                          stationsacross
                                                                                   acrossthe
                                                                                          theState
                                                                                              StateofofRio
                                                                                                        Riode
                                                                                                            deJaneiro,
                                                                                                               Janeiro,Brazil.
                                                                                                                        Brazil.

                                 3.3.Results
                                     Results
                                       Between
                                        Between44July July2021
                                                            2021to to2626December
                                                                          December2021, 2021,234,621
                                                                                              234,621cases
                                                                                                        casesofofconfirmed
                                                                                                                  confirmedCOVID-19
                                                                                                                               COVID-19were    were
                                 reported
                                  reportedto  tothe
                                                  theRJRJState
                                                          StateHealth
                                                                 HealthDepartment,
                                                                            Department,with  withthe
                                                                                                   theDelta
                                                                                                        Deltavariant
                                                                                                                variantbeing
                                                                                                                         beingresponsible
                                                                                                                                 responsiblefor  for
                                 the  majority   of cases   [4]. By   7
                                  the majority of cases [4]. By NovemberNovember       2021, COVID-19
                                                                                             COVID-19     cases   had  declined    precipitously,
                                                                                                                                   precipitously,
                                 coinciding
                                  coinciding withwith a rise in
                                                              in influenza
                                                                  influenzacasescases(Figure
                                                                                        (Figure2).
                                                                                                 2).Cases
                                                                                                      Casesofof   COVID-19
                                                                                                               COVID-19         during
                                                                                                                             during    thisthis pe-
                                                                                                                                             period
                                 riod  accounted      for 40,712    hospitalizations      and  13,377   deaths,   with  a
                                  accounted for 40,712 hospitalizations and 13,377 deaths, with a case fatality rate of 5.7case fatality    rate of
                                 5.7  percent
                                  percent       in the
                                            in the      state
                                                    state     during
                                                           during        this
                                                                      this    time
                                                                           time      frame.
                                                                                 frame.
                                       An
                                        Anestimated
                                             estimated 68,077
                                                           68,077 cases
                                                                     cases of
                                                                            of influenza
                                                                                influenza dueduetotothe
                                                                                                      theH3N2
                                                                                                          H3N2Darwin
                                                                                                                   Darwintype typeAAinfluenza
                                                                                                                                        influenza
                                 strain
                                  strain [6] occurred between November to December 2021 [9], with a case fatalityrate
                                         [6] occurred     between      November       to December     2021  [9],  with  a  case fatality     rateof
                                                                                                                                                  of
                                 0.1
                                  0.1 percent. Unlike the influenza epidemics of previous years which occurred in Mayand
                                      percent.   Unlike   the  influenza    epidemics     of previous    years   which  occurred     in May     and
                                 June,
                                  June,the
                                         theinfluenza
                                              influenzaepidemic
                                                           epidemicin    in2021
                                                                            2021occurred
                                                                                  occurredin  inNovember.
                                                                                                 November.Furthermore,
                                                                                                                 Furthermore,the  thecirculating
                                                                                                                                       circulating
                                 strain of  H3N2    influenza    virus    was different   from  the  H3N2
                                  strain of H3N2 influenza virus was different from the H3N2 strain providedstrain  provided    in  the trivalent
                                                                                                                                             in the
                                 vaccine
                                  trivalentduring
                                             vaccine theduring
                                                          fall/winter     period ofperiod
                                                                  the fall/winter      2021. Influenza    vaccine coverage
                                                                                              of 2021. Influenza                for the RJfor
                                                                                                                     vaccine coverage         state
                                                                                                                                                 the
                                 population      during   the   spring/winter       of  2021  was   less than   60%
                                  RJ state population during the spring/winter of 2021 was less than 60% [5]. This    [5].  This  encompasses
                                 anyone    as of 6anyone
                                  encompasses        monthsasofofage.      Influenza
                                                                      6 months    of age.hospitalizations,    cases, circulating
                                                                                            Influenza hospitalizations,       cases,strains    and
                                                                                                                                       circulating
                                 vaccine   coverage     for the  State   of Rio  de  Janeiro  from   2016  to  2021 are  shown
                                  strains and vaccine coverage for the State of Rio de Janeiro from 2016 to 2021 are shown         in Table   1.
                                  in Table 1.
Vaccines 2022, 10, x FOR PEER REVIEW                                                                                                           4 of 9
 Vaccines 2022, 10, 821                                                                                                                           4 of 9

                                   Figure 2. SARS-CoV2 and influenza in Rio de Janeiro, July to December 2021. Confirmed SARS-
                                 Figure 2. SARS-CoV2 and influenza in Rio de Janeiro, July to December 2021. Confirmed SARS-
                                   CoV2
                                 CoV2      cases
                                        cases     and
                                                and     adjusted
                                                     adjusted      influenza
                                                                 influenza     cases
                                                                            cases  inin Rio
                                                                                      Rio  dede  Janeiro
                                                                                               Janeiro areare  represented
                                                                                                            represented   inin  blue
                                                                                                                              blue    and
                                                                                                                                    and    yellow
                                                                                                                                         yellow     bars,
                                                                                                                                                  bars,
                                 respectively. The number of SARS-CoV2 cases and adjusted influenza cases in Rio de Janeiro is is
                                   respectively.    The    number    of SARS-CoV2      cases  and   adjusted    influenza  cases  in  Rio de  Janeiro
                                   described
                                 described   ononthethe
                                                      leftleft y-axis.
                                                           y-axis. TheThe   COVID-19
                                                                        COVID-19          vaccination
                                                                                     vaccination        rate
                                                                                                   rate in RioindeRio de Janeiro
                                                                                                                    Janeiro        is shown
                                                                                                                            is shown          as ablue
                                                                                                                                       as a light   light
                                 line and
                                   blue     is and
                                         line  described     on theon
                                                    is described      right
                                                                        the y-axis. The x-axis
                                                                            right y-axis.         represents
                                                                                           The x-axis           the weeks
                                                                                                         represents         from from
                                                                                                                      the weeks    4 July4 2021  to 26to
                                                                                                                                           July 2021
                                 December
                                   26 December2021,2021,
                                                     in which    casescases
                                                            in which    werewere
                                                                              reported   in Rio
                                                                                   reported   in de
                                                                                                 RioJaneiro.
                                                                                                     de Janeiro.

                                 Table
                                  Table1.1.Hospitalizations
                                            Hospitalizationsand
                                                             andcases
                                                                   casesofofinfluenza,
                                                                              influenza,circulating
                                                                                          circulatinginfluenza
                                                                                                       influenzastrains,
                                                                                                                  strains,vaccines
                                                                                                                           vaccinesused
                                                                                                                                    usedand
                                                                                                                                         and
                                 vaccine coverage in the State of Rio de Janeiro, 2016–2021 [12–21].
                                  vaccine coverage in the State of Rio de Janeiro, 2016–2021 [12–21].
                                 Month(s) with the
       Hospitalization                      Month(s) Circulating
                                                     with        Strain                                      Vaccination
 Year                  Cases * Highest Number                            Trivalent Vaccine Strains (S5)        Vaccination
             s                               the Highest (S1–3,8)
                                                                Circulating       Trivalent Vaccine Strains Coverage (S4)
    Year   Hospitalizations    Cases  *
                                   of Cases (S6–8)                                                              Coverage
                                             Number of        Strain (S1–3,8)                (S5)
                                                                                                                  (S4)
                                             Cases (S6–8)                 A/California/(H1N1) pdm09
                                                      A/(H1N1)pdm09
 2016      2484        191,076        May–June                                A/Hong   Kong/(H3N2)
                                                                                    A/California/(H1N1)         91%
                                                             **
    2016         2484          191,076        May–June
                                                             A/(H1N1)pdm09          B/Brisbane
                                                                                           pdm09
                                                                                                                  91%
                                                                    **             A/Hong Kong/(H3N2)
                                                                           A/Michigan/(H1N1)pdm09
                                                                                         B/Brisbane
 2017      1155         88,846        May–June            A/(H3N2)            A/Hong Kong/(H3N2)                85%
                                                                                 A/Michigan/(H1N1)pdm09
                                                                                    B/Brisbane
    2017         1155           88,846        May–June          A/(H3N2)           A/Hong Kong/(H3N2)             85%
                                                                           A/Michigan/(H1N1)pdm09
                                                                                         B/Brisbane
 2018      1898        146,000        May–June        A/(H1N1)pdm09            A/Singapore/(H3N2)               78%
                                                                                 A/Michigan/(H1N1)pdm09
    2018         1898          146,000        May–June       A/(H1N1)pdm09           B/Phuket
                                                                                    A/Singapore/(H3N2)            78%
                                                                           A/Michigan/(H1N1)pdm09
                                                                                          B/Phuket
 2019      2394        184,154        May–June        A/(H1N1)pdm09           A/Switzerland/(H3N2)
                                                                                 A/Michigan/(H1N1)pdm09         93%
    2019         2394          184,154        May–June       A/(H1N1)pdm09          B/Victoria
                                                                                   A/Switzerland/(H3N2)           93%
                                                                                         B/Victoria
                                                                           A/Brisbane/(H1N1)pdm09
 2020        0           NA             NA                   NA            A/South   Australia/(H3N2)
                                                                                 A/Brisbane/(H1N1)pdm09         91%
                                                                                          A/South
                                                                                  B/Washington
    2020           0             NA              NA                 NA                                            91%
                                                                                      Australia/(H3N2)
                                                                           A/ Victoria/(H1N1)pdm09
                                                                                       B/Washington
 2021       885         68,077       November        A/Darwin (H3N2)          A/Hong Kong/(H3N2)                58%
                                                                                 A/Victoria/(H1N1)pdm09
    2021          885           68,077        November
                                                                A/Darwin            B/Victoria
                                                                                   A/Hong Kong/(H3N2)             58%
                                 * The data for 2016–19 are based on cases       (H3N2)
                                                                                     of acute respiratory distress   syndrome (ARDS) admitted
                                                                                                              B/Victoria
                                 to sentinel hospitals for grave illness attributed to influenza [20,21] with the total number of cases
                                 calculated
                                   * The databased    on CDC
                                               for 2016–19       methodology
                                                            are based  on cases of(hospitalizations
                                                                                    acute respiratory comprise   1.3% of (ARDS)
                                                                                                      distress syndrome   cases). admitted
                                                                                                                                   The yearto2020  is
                                                                                                                                               sentinel
                                 listed as “Not   Applicable    (NA)”   because    the number   of influenza   cases reported   in the study region
                                   hospitals for grave illness attributed to influenza [20,21] with the total number of cases calculated based on CDC
                                 was   exceptionally low due to the COVID-19 pandemic with no hospitalizations reported, so an
                                   methodology (hospitalizations comprise 1.3% of cases). The year 2020 is listed as “Not Applicable (NA)” because
                                 estimate of the number of total cases is not possible. The year 2021 includes all influenza cases and
Vaccines 2022, 10, x FOR PEER REVIEW                                                                                                         5 of 9
 Vaccines 2022, 10, 821                                                                                                                        5 of 9

                                 estimated hospitalizations during the out-of-season influenza epidemic (as per Results). ** “pdm”
                                  the number of influenza cases reported in the study region was exceptionally low due to the COVID-19 pandemic
                                 denotes “pandemic” in reference to the 2009 pandemic influenza strain.
                                  with no hospitalizations reported, so an estimate of the number of total cases is not possible. The year 2021
                                  includes all influenza cases and estimated hospitalizations during the out-of-season influenza epidemic (as per
                                        Interestingly, state weather patterns during October and November of 2021 (spring
                                   Results). ** “pdm” denotes “pandemic” in reference to the 2009 pandemic influenza strain.
                                 in the Southern Hemisphere) when the influenza virus epidemic occurred were distinctly
                                 different from the five preceding years. In October 2021, maximum temperatures were
                                          Interestingly, state weather patterns during October and November of 2021 (spring
                                 nearly 2 degrees Celsius less than the average of the maximum temperatures in the five
                                   in the Southern Hemisphere) when the influenza virus epidemic occurred were distinctly
                                 preceding
                                   different fromyears,the
                                                         while
                                                            five minimum
                                                                  preceding temperatures
                                                                                years. In October were2021,
                                                                                                         nearly   two degrees
                                                                                                               maximum             Celsius lower
                                                                                                                             temperatures        were
                                 than    the  mean    value   for  the  five  preceding     years.  The   same
                                   nearly 2 degrees Celsius less than the average of the maximum temperatures    phenomenon        was observed
                                                                                                                                          in the five
                                 for  the month
                                   preceding          ofwhile
                                                 years,    November,
                                                                 minimum   although     the difference
                                                                              temperatures      were nearlyin two
                                                                                                               temperature      magnitude
                                                                                                                     degrees Celsius     lowerwas than
                                 approximately
                                   the mean value1 for  degree     Celsius
                                                             the five        for maximum
                                                                       preceding     years. The and  minimum
                                                                                                  same             temperatures
                                                                                                          phenomenon                compared
                                                                                                                           was observed             to
                                                                                                                                               for the
                                 the  five   preceding     years.   For  both  months,    the   change   in temperature
                                   month of November, although the difference in temperature magnitude was approximately     noted    in  2021   was
                                 statistically    significant
                                   1 degree Celsius              (Figure and
                                                         for maximum        3). Indeed,
                                                                                 minimum   thetemperatures
                                                                                                 mean temperature
                                                                                                               compared  during
                                                                                                                            to thethe
                                                                                                                                    fiveinfluenza
                                                                                                                                           preceding
                                 epidemic      during   October    and   November       2021  (20.4 °C  and  21  °C,
                                   years. For both months, the change in temperature noted in 2021 was statistically respectively)     was   similar
                                                                                                                                          significant
                                 to(Figure
                                     the mean      temperatures
                                              3). Indeed,    the meanreported     duringduring
                                                                          temperature       the winter    months of
                                                                                                    the influenza       July andduring
                                                                                                                      epidemic      August      (20.1
                                                                                                                                            October
                                 and
                                   and21    °C, respectively
                                         November      2021 (20.4 in◦2021)
                                                                      C andin 21 a◦ C,
                                                                                    typical   year [11,22].
                                                                                       respectively)          The median
                                                                                                       was similar             and interquartile
                                                                                                                      to the mean     temperatures
                                 ranges
                                   reportedof monthly
                                                during theminimum,       mean and
                                                               winter months        of maximum      temperatures
                                                                                       July and August       (20.1 andof 17
                                                                                                                          21weather     stations inin
                                                                                                                              ◦ C, respectively
                                 the
                                   2021) in a typical year [11,22]. The median and interquartile ranges of monthlypreceding
                                       State   of  Rio  de  Janeiro   are   reported    from   2016   to 2021   in  Table   2. In  the    minimum,
                                 years,
                                   mean in andthe    State oftemperatures
                                                 maximum        Rio de Janeiro,  of 17there    were
                                                                                         weather      no periods
                                                                                                   stations           in which
                                                                                                             in the State   of Rioa dedecrease
                                                                                                                                         Janeiro arein
                                 temperature
                                   reported from   outside
                                                      2016 to of2021
                                                                 the winter
                                                                      in Tableseason     produced
                                                                                 2. In the   precedingan years,
                                                                                                          increasein in
                                                                                                                     thethe  cases
                                                                                                                          State      of influenza.
                                                                                                                                 of Rio   de Janeiro,
                                 As   shown
                                   there   wereinno Table   2, however,
                                                       periods    in whichina the    five preceding
                                                                                 decrease                years, outside
                                                                                             in temperature      temperatures
                                                                                                                           of the were
                                                                                                                                    winter  warmer
                                                                                                                                              season
                                 than   in 2021.
                                   produced      an increase in the cases of influenza. As shown in Table 2, however, in the five
                                   preceding years, temperatures were warmer than in 2021.

                                             Maximumand
                                  Figure3.3.Maximum
                                 Figure                   andminimum
                                                                minimumtemperatures
                                                                             temperaturesrecorded
                                                                                             recordedacross
                                                                                                      acrossthetheState
                                                                                                                    StateofofRio
                                                                                                                              RiodedeJaneiro
                                                                                                                                        Janeirofor
                                                                                                                                                for
                                  Octoberand
                                 October   andNovember
                                                 November from
                                                            from 2016 to to 2021.
                                                                            2021. Data
                                                                                   Datafrom
                                                                                        from2016–2020
                                                                                               2016–2020and
                                                                                                          and2021
                                                                                                                2021were
                                                                                                                      wereaveraged
                                                                                                                             averaged between
                                                                                                                                         betweenten
                                  weather
                                 ten       stations
                                      weather        covering
                                                stations       the State
                                                         covering    the of  Rio of
                                                                          State  de Rio
                                                                                    Janeiro. The dataThe
                                                                                        de Janeiro.   for the
                                                                                                           datamean
                                                                                                                 for of
                                                                                                                      the2016–2020
                                                                                                                           mean of represent
                                                                                                                                       2016–2020 all
                                 represent  all measurements
                                  measurements                   taken fromand
                                                   taken from maximum          maximum
                                                                                  minimum and   minimum temperatures
                                                                                             temperatures                   for thestations
                                                                                                            for the ten weather      ten weather
                                                                                                                                             in Rio
                                 stations in Rio
                                  de Janeiro.     de Janeiro.signed
                                               A Wilcoxon      A Wilcoxon     signed
                                                                      rank test       rank test was
                                                                                 was performed      performed
                                                                                                  comparing       comparing
                                                                                                               2021  maximum    2021
                                                                                                                                   andmaximum
                                                                                                                                         minimum
                                 and  minimum for
                                  temperatures    temperatures
                                                      the monthsfor of the  months
                                                                       October   andof  October and
                                                                                      November    withNovember
                                                                                                       that of thewith
                                                                                                                     meanthat    of the mean
                                                                                                                             of 2016–2020.      of
                                                                                                                                              Error
                                 2016–2020. Error bars represent standard error. All p-values were
Vaccines 2022, 10, 821                                                                                                            6 of 9

                                     Table 2. Minimum, mean and maximum temperature (◦ C) in State of Rio de Janeiro, 2016–2021.
                                     Monthly temperature data for this period for weather stations in the state were obtained from the
                                     Brazilian National Institute of Meteorology [11] (see Methods). For each station, we determined
                                     the annual minimum, mean and maximum temperatures, as well as the October and November
                                     minimum and maximum temperatures. For each of these variables, we report the mean and standard
                                     error of the observations from all of the stations.

       Year                          Minimum (◦ C)                      Mean (◦ C)                     Maximum (◦ C)
                         October       November                                          October         November
                                                       Whole Year      Whole Year                                       Whole Year
                          Only           Only                                             Only             Only
                          21.17            22.04           21.62            22.16          22.42             23.11           22.74
       2016
                      (20.2–22.14)    (21.12–22.96)   (20.58–22.65)     (21.13–23.2)   (21.51–23.34)    (22.22–24.01)   (21.71–23.77)
                          22.33            22.01           21.58            22.15          23.77             23.09           22.76
       2017
                     (21.61–23.06)    (21.15–22.87)   (20.68–22.47)    (21.27–23.04)   (23.08–24.46)    (22.23–23.95)   (21.88–23.65)
                          21.74            22.34           21.07            21.71          22.67             23.35           22.15
       2018
                      (20.8–22.67)    (21.36–23.32)     (20–22.13)     (20.69–22.73)   (21.72–23.61)    (22.36–24.33)   (21.08–23.22)
                          22.42            22.12            22.1            22.67          23.57             23.11           23.27
       2019
                     (21.54–23.31)    (21.23–23.01)   (21.18–23.03)     (21.74–23.6)   (22.69–24.45)      (22.23–24)     (22.34–24.2)
                           23.2            22.81           22.14            22.69          24.33             23.91           23.27
       2020
                      23.07–23.33)      (22.62–23)    (21.18–23.03)     (21.74–23.6)   (24.21–24.45)    (23.76–24.05)   (22.57–23.97)
                          20.39            21.05           21.11            21.68          21.27             22.12           22.28
       2021
                      (19.3–21.48)    (20.16–21.94)   (20.19–22.04)     (20.76–22.6)   (20.14–22.39)    (21.24–23.01)   (22.57–23.97)

                                          The general population of the State of RJ had poor vaccine coverage against influenza
                                     in the winter of 2021 (55.7% of the population over 6 months old was vaccinated) [5]. In
                                     addition, there was a mismatch between influenza virus vaccine strains in 2021 and the
                                     influenza virus which circulated in October/November 2021. Furthermore, a decline in
                                     COVID-19 cases following an epidemic Delta variant surge and higher COVID-19 immu-
                                     nization rates [4] led to a SARS-CoV-2 void in October/December 2021. During this void, an
                                     influenza epidemic occurred out-of-season in the State of RJ with an estimated 68,077 cases.
                                     A decline in mitigation measures might have contributed to the exacerbation of influenza
                                     cases in the spring/summer of 2021. Although there were appropriate conditions for the
                                     influenza virus to circulate in the winter of 2021, minimal to no influenza virus circulated
                                     simultaneously to the Delta SARS-CoV-2 epidemic surge during which 234,621 SARS-
                                     CoV-2 cases were reported. Similarly, when Omicron cases appeared in January 2022
                                     leading to a COVID-19 pandemic surge, cases of the influenza virus plummeted across
                                     the state [4]. Nevertheless, the influenza epidemic migrated south and continued in the
                                     south and in other southeast areas of Brazil during January 2022, until the Omicron variant
                                     surged nationally. At that point the number of influenza cases declined precipitously across
                                     the country.

                                     4. Discussion
                                          Early in the COVID-19 pandemic, reports described dramatic reductions in circulating
                                     influenza and RSV strains globally [23–25], with one report even considering the extinction
                                     of specific influenza viral lineages [26]. As the pandemic progressed, other respiratory
                                     viruses were shown to circulate off-season, frequently during a period of SARS-CoV-2
                                     decline, a phenomenon likely driven by changing weather patterns, other prevailing
                                     competing viruses in the ecosystem and possibly limited use of mitigating measures such
                                     as masks and social distancing [27]. One such example is respiratory syncytial virus, which
                                     occurred off-season in the summer of 2021 in the United States, Japan and Australia, also
                                     coinciding with a low COVID-19 case load [28–30]. In South Africa, a similar phenomenon
                                     was observed where influenza circulated off-season [31].
                                          Typically, the seasonality of influenza in Brazil is characterized by a biannual pattern,
                                     with a larger peak in the winter month of June and a smaller peak during the summer
                                     month of January [32]. Our findings showed a seasonally unexpected peak in influenza
Vaccines 2022, 10, 821                                                                                                       7 of 9

                         cases in November 2021, a period in which there was a low COVID-19 case load. Compared
                         to the influenza epidemics in previous years that occurred in May and June, the 2021
                         influenza epidemic in November was unanticipated. We found that there was a distinctly
                         lower mean temperature than expected for the month of October and November based on
                         data from 2016 to 2020, which may have contributed to the off-season influenza epidemic.
                               In our analysis, a void in the circulating prevailing pandemic, a mismatch between
                         the circulating influenza strain and influenza vaccination and climate changes fostering
                         improved weather conditions for flu viral spread may be predictive of off-season influenza
                         virus circulation. Initially in the COVID-19 pandemic, interventions mitigating viral spread
                         such as masks and social distancing likely prevented the circulation of other viruses. How-
                         ever, a combination of reduced mitigating measures during the brief Rio COVID-19 void
                         period, coupled with colder weather, favoring population clustering indoors may have
                         played an important role in the out-of-season Rio flu outbreak. Studies have suggested that
                         most person-to-person transmission events occur indoors, perhaps driven by the indoor
                         climate, proximity and limited amount of breathing air [33–35]. During cold weather,
                         people are more likely to be confined to indoor spaces, which can facilitate virus transmis-
                         sion [36]. Furthermore, during changing weather conditions, people may have decreased
                         host immune defense mechanisms, which make them susceptible to illness [36]. In contrast,
                         by mid-November, the COVID-19 vaccination rate in RJ exceeded 70 percent (as shown in
                         Figure 2), which may have played a role in protecting the State of RJ population from the
                         Delta strain. In addition, a considerable proportion of the population acquired COVID-19
                         during the Delta surge before November 2021. Thus, both vaccination and recent natural
                         immunity likely contributed to a lack of resurgence of COVID-19 cases.
                               In the specific case of influenza, when there are available vaccines for prevention
                         and oral antiviral treatment to abort disease progression, year-round influenza vaccines
                         and antiviral agents would help avoid unnecessary morbidity and mortality, given that
                         antibodies rapidly wane and are not protective for an entire year. Furthermore, while we
                         live through cycles of COVID-19 surges during the pandemic era, we should be prepared for
                         off-season outbreaks of other respiratory viruses which can potentially prevail unexpectedly
                         during periods of COVID-19 remission, as underscored by novel disease dynamics in the
                         pandemic era.

                         5. Conclusions
                               Ultimately, we found that state weather patterns during the influenza epidemic were
                         significantly different from previous years and matching typical winter temperatures and
                         that there was a mismatch between influenza vaccine strains and the strain responsible for
                         the influenza epidemic. Our findings suggest that the seasonality of respiratory viruses
                         may be unexpected and unpredictable during the COVID-19 pandemic. That interruption
                         of typical disease dynamics and predisposition to off-season epidemics may be due to the
                         changing landscape of respiratory virus and pathogen exposure, as well as the impact of cli-
                         mate change on weather patterns. As such, we should expect off-season pathogen outbreaks
                         during the COVID-19 pandemic and be prepared to prevent and treat such outbreaks.

                         Author Contributions: Conceptualization, K.N.-S., T.L.F. and P.B.; methodology, T.L.F., K.N.-S., P.B.
                         and R.N.; software, T.L.F. and R.N.; validation, T.L.F., R.N., P.B. and K.N.-S.; formal analysis, K.N.-S.,
                         T.L.F., P.B. and R.N.; investigation, R.N., T.L.F., P.B. and K.N.-S.; resources, T.L.F., P.B. and K.N.-S.;
                         data curation, R.N., T.L.F., P.B. and K.N.-S.; writing—original draft preparation, K.N.-S. and R.N.;
                         writing—review and editing, R.N. and K.N.-S.; visualization, R.N., T.L.F. and K.N.-S.; supervision,
                         K.N.-S.; project administration, K.N.-S.; funding acquisition, K.N.-S. All authors have read and agreed
                         to the published version of the manuscript.
                         Funding: This research received no external funding.
                         Institutional Review Board Statement: Not applicable.
                         Informed Consent Statement: Not applicable.
Vaccines 2022, 10, 821                                                                                                               8 of 9

                                  Data Availability Statement: Publicly available datasets were analyzed in this study. These data can
                                  be found here: [http://sistemas.saude.rj.gov.br/tabnetbd/dhx.exe?COVID19/tf_evento_divulgacao.
                                  def] (accessed on 2 March 2022), and [http://sistemas.saude.rj.gov.br/tabnetbd/dhx.exe?sivep_
                                  gripe/sivep_gripe.def] (accessed on 14 March 2022), [http://tabnet.datasus.gov.br/cgi/dhdat.exe?
                                  bd_pni/dpnibr.def] (accessed on 14 March 2022). Data can also be provided upon request.
                                  Conflicts of Interest: The authors declare no conflict of interest.

References
1.    Machado, C.J.; Pereira, C.C.D.A.; Viana, B.D.M.; Oliveira, G.L.; Melo, D.C.; Carvalho, J.F.M.G.D.; Moraes, F.L.D.; Moraes, E.N.D.
      Estimates of the impact of COVID-19 on mortality of institutionalized elderly in Brazil. Ciên. Saúde Coletiva 2020, 25, 3437–3444.
      [CrossRef] [PubMed]
2.    COVID-19 in Rio de Janeiro—Data by Event and Confirmation Date. Available online: http://sistemas.saude.rj.gov.br/tabnetbd/
      dhx.exe?covid19/tf_evento_divulgacao.def (accessed on 2 March 2022).
3.    Naik, P.A.; Yavuz, M.; Qureshi, S.; Zu, J.; Townley, S. Modeling and analysis of COVID-19 epidemics with treatment in fractional
      derivatives using real data from Pakistan. Eur. Phys. J. Plus 2020, 135, 795. [CrossRef] [PubMed]
4.    Özköse, F.; Yavuz, M. Investigation of interactions between COVID-19 and diabetes with hereditary traits using real data: A case
      study in Turkey. Comput. Biol. Med. 2022, 141, 105044. [CrossRef] [PubMed]
5.    Rio Has an Increase in Influenza A and Calls the Population to Get Vaccinated. Available online: https://agenciabrasil.ebc.com.
      br/saude/noticia/2021-11/rio-tem-aumento-de-influenza-e-chama-populacao-para-se-vacinar (accessed on 14 March 2022).
6.    SIVEP—Influenza-Notifications of Severe Acute Respiratory Syndromes (SRAG)—Rio de Janeiro. Available online:
      http://sistemas.saude.rj.gov.br/tabnetbd/dhx.exe?sivep_gripe/sivep_gripe.def (accessed on 14 March 2022).
7.    Emergency Operations Center. COVID-19 Epidemiological Bulletin [In Portuguese]. Rio de Janeiro, Brazil. Available online:
      https://coronavirus.rio/wp-content/uploads/2022/04/Boletim-Epidemiologico-COE-COVID-Rio-23-04.22_compressed-1.
      pdf (accessed on 28 April 2022).
8.    U.S. Influenza Surveillance: Purpose and Methods. Available online: https://www.cdc.gov/flu/weekly/overview.htm (accessed
      on 24 March 2022).
9.    Ministry of Health Health Information. Available online: http://tabnet.datasus.gov.br/cgi/dhdat.exe?bd_pni/dpnibr.def
      (accessed on 14 March 2022).
10.   Recommended Composition of Influenza Virus Vaccines for Use in the 2022 Southern Hemisphere Influenza Season. Available
      online: https://www.who.int/publications/m/item/recommended-composition-of-influenza-virus-vaccines-for-use-in-the-
      2022-southern-hemisphere-influenza-season (accessed on 14 March 2022).
11.   Weather Forecast. Available online: https://portal.inmet.gov.br/ (accessed on 20 March 2022).
12.   Influenza-Epidemiological Report—2018. Secretary of Ministry of Health. Monitoring until Epidemiological Week 14 of 2018.
      Available online: http://www.riocomsaude.rj.gov.br/Publico/MostrarArquivo.aspx?C=sUxSCWcPPuw%3d (accessed on 27
      April 2022).
13.   Influenza-Epidemiological Report—2017. Secretary of Ministry of Health. Monitoring until Epidemiological Week 36 of 2017.
      Available online: http://www.riocomsaude.rj.gov.br/Publico/MostrarArquivo.aspx?C=PASmxOIIGbA%3d (accessed on 27
      April 2022).
14.   Influenza-Epidemiological Report—2016. Secretary of Ministry of Health. Monitoring until Epidemiological Week 47 of 2016.
      Available online: http://www.riocomsaude.rj.gov.br/Publico/MostrarArquivo.aspx?C=VrhTa4sUF3U%3d (accessed on 27
      April 2022).
15.   SIPNI-National Immunization Program Information System. Available online: http://sipni-gestao.datasus.gov.br/si-pni-web/
      faces/relatorio/consolidado/coberturaVacinalCampanhaInfluenza.jsf (accessed on 27 April 2022).
16.   World Health Organization. Recommended Composition of Influenza Virus Vaccines for Use in the 2016–2021 Southern
      Hemisphere Influenza Season. Available online: https://www.gisaid.org/resources/human-influenza-vaccine-composition/
      (accessed on 27 April 2022).
17.   Crépey, P.; Boiron, L.; Araujo, R.R.; Lopez, J.G.; Petitjean, A.; de Albuquerque Luna, E.J. Impact of quadrivalent influenza vaccines
      in Brazil: A cost-effectiveness analysis using an influenza transmission model. BMC Public Health 2020, 20, 1374. [CrossRef]
      [PubMed]
18.   Influenza Vaccines in Brazil in 2019. Available online: https://sbim.org.br/images/files/notas-tecnicas/nota-tecnica-influenza-
      v2-190318.pdf (accessed on 28 April 2022).
19.   Epidemiological Situation of Influenza in the Municipality of São José do Rio Preto 2019. Available online: https://saude.riopreto.
      sp.gov.br/transparencia/arqu/boleepid/2019/boletins_epidemiologico_influenza_2019.pdf (accessed on 28 April 2022).
20.   SRAG 2019—Severe Acute Respiratory Syndrome Database. Available online: https://d26692udehoye.cloudfront.net/SRAG/20
      19/INFLUD19.csv (accessed on 28 April 2022).
21.   SRAG 2013–2018—Severe Acute Respiratory Syndrome Database. Available online: https://opendatasus.saude.gov.br/dataset/
      srag-2013-2018 (accessed on 28 April 2022).
Vaccines 2022, 10, 821                                                                                                              9 of 9

22.   Weather and Climate in Rio de Janeiro in August. Available online: https://pt.climate-data.org/america-do-sul/brasil/rio-de-
      janeiro/rio-de-janeiro-853/t/agosto-8/ (accessed on 25 April 2022).
23.   Olsen, S.J.; Azziz-Baumgartner, E.; Budd, A.P.; Brammer, L.; Sullivan, S.; Pineda, R.F.; Cohen, C.; Fry, A.M. Decreased influenza
      activity during the COVID-19 pandemic—United States, Australia, Chile, and South Africa. MMWR Morb. Mortal Wkly. Rep.
      2020, 69, 1305–1309. [CrossRef]
24.   Akhtar, Z.; Chowdhury, F.; Rahman, M.; Ghosh, P.K.; Ahmmed, M.K.; Islam, M.A.; Mott, J.A.; Davis, W. Seasonal influenza
      during the COVID-19 pandemic in Bangladesh. PLoS ONE 2021, 16, e0255646. [CrossRef] [PubMed]
25.   Di Mattia, G.; Nenna, R.; Mancino, E.; Rizzo, V.; Pierangeli, A.; Villani, A.; Midulla, F. During the COVID-19 pandemic where has
      respiratory syncytial virus gone? Pediatr. Pulmonol. 2021, 56, 3106–3109. [CrossRef] [PubMed]
26.   Di Mattia, G.; Nenna, R.; Mancino, E.; Rizzo, V.; Pierangeli, A.; Villani, A.; Midulla, F. Influenza lineage extinction during the
      COVID-19 pandemic? Nat. Rev. 2021, 19, 741–742.
27.   Zheng, Z.; Pitzer, V.E.; Shapiro, E.D.; Bont, L.J.; Weinberger, D.M. Estimation of the Timing and Intensity of Reemergence of
      Respiratory Syncytial Virus Following the COVID-19 Pandemic in the US. JAMA Netw. Open 2021, 4, e2141779. [CrossRef]
      [PubMed]
28.   Agha, R.; Avner, J. Delayed Seasonal RSV Surge Observed during the COVID-19 Pandemic. Pediatrics 2021, 148, e2021052089.
      [CrossRef]
29.   Saravanos, G.L.; Hu, N.; Homaira, N.; Muscatello, D.J.; Jaffe, A.; Bartlett, A.W.; Wood, N.J.; Rawlinson, W.; Kesson, A.; Lingam,
      R.; et al. RSV Epidemiology in Australia before and during COVID-19. Pediatrics 2022, 149, e2021053537. [CrossRef] [PubMed]
30.   Ujiie, M.; Tsuzuki, S.; Nakamoto, T.; Iwamoto, N. Resurgence of Respiratory Syncytial Virus Infections during COVID-19
      Pandemic. Emerg. Infect. Dis. 2021, 27, 2969–2970. [CrossRef] [PubMed]
31.   Umunnakwe, C.N.; Makatini, Z.N.; Maphoto, R.; Tempelman, H.A. Sharp increase in influenza A infections in Limpopo: A call
      for increased influenza vaccinations. S. Afr. Med. J. 2022, 112, 13508. [CrossRef] [PubMed]
32.   Alonso, W.J.; Viboud, C.; Simonsen, L.; Hirano, E.W.; Daufenbach, L.Z.; Miller, M.A. Seasonality of influenza in Brazil: A traveling
      wave from the Amazon to the subtropics. Am. J. Epidemiol. 2007, 165, 1434–1442. [CrossRef] [PubMed]
33.   Moriyama, M.; Hugentobler, W.J.; Iwasaki, A. Seasonality of respiratory viral infections. Annu. Rev. Virol. 2020, 7, 83–101.
      [CrossRef] [PubMed]
34.   Schweizer, C.; Edwards, R.D.; Bayer-Oglesby, L.; Gauderman, W.J.; Ilacqua, V.; Juhani Jantunen, M.; Lai, H.K.; Nieuwenhuijsen,
      M.; Künzli, N. Indoor time–microenvironment–activity patterns in seven regions of Europe. J. Expo. Sci. Environ. Epidemiol. 2007,
      17, 170–181. [CrossRef]
35.   Klepeis, N.E.; Nelson, W.C.; Ott, W.R.; Robinson, J.P.; Tsang, A.M.; Switzer, P.; Behar, J.V.; Hern, S.C.; Engelmann, W.H. The
      National Human Activity Pattern Survey (NHAPS): A resource for assessing exposure to environmental pollutants. J. Expo. Sci.
      Environ. Epidemiol. 2001, 11, 231–252. [CrossRef]
36.   Neumann, G.; Kawaoka, Y. Seasonality of influenza and other respiratory viruses. EMBO Mol. Med. 2022, 14, e15352. [CrossRef]
You can also read