Effect of ambient temperature on outpatient admission for osteoarthritis and rheumatoid arthritis in a subtropical Chinese city
←
→
Page content transcription
If your browser does not render page correctly, please read the page content below
Zhao et al. BMC Public Health     (2022) 22:172
https://doi.org/10.1186/s12889-021-11994-0

 RESEARCH ARTICLE                                                                                                                                   Open Access

Effect of ambient temperature on
outpatient admission for osteoarthritis and
rheumatoid arthritis in a subtropical
Chinese city
Desheng Zhao1, Jian Cheng2, Ping Bao1, Yanwu Zhang3, Fengjuan Liang1, Hao Wang4, Xu Wang5,
Shiyuan Fang1* and Hong Su2*

  Abstract
  Background: Current findings on the impact of weather conditions on osteoarthritis (OA) and rheumatoid arthritis
  (RA) are sparse and not conclusive. This study aimed to investigate the relationship between temperature change
  and OA/RA admission.
  Methods: Daily OA/RA admission, meteorological data and pollutants from 1 January 2014 to 31 December 2017 in
  Hefei, China, were collected. We quantified the relationship between ambient temperature and OA/RA admission
  using a distributed lag nonlinear model (DLNM). Stratified analyses by gender and age were also examined.
  Results: Temperature decrease was significantly associated with RA admission (25th percentile of temperature
  versus 50th percentile of temperature), with the acute and largest effect at current days lag (RR: 1.057, 95%CI:
  1.005–1.111). However, no significant association between temperature and OA admission was observed. When
  conducting subgroup analyses by individual characteristics, we found that females and patients aged 41–65 years
  were more vulnerable to temperature decrease than males, patients aged 0–40 and ≧66 years, respectively.
  Conclusions: This study suggested that temperature decrease was a risk factor for increases in RA admission.
  Females and patients aged 41–65 years were particularly vulnerable to the effect of temperature decrease.
  Keywords: Temperature, Osteoarthritis, Rheumatoid arthritis, Admission

Background                                                                             and the number of patients reached 303.1 million by the
Osteoarthritis (OA) and rheumatoid arthritis (RA) are                                  year 2017. Meanwhile, RA affects about 19.9 million
the two most common joint disorders [1], contributed to                                people, which account for 2.7‰ of the total population.
a higher burden of disease in China and the world.                                     Between 2007 and 2017, the number of all-age years
According to the Global Burden of Disease (GBD) study                                  who lived with disability (YLDs) attributed to OA/RA in-
in 2018, the worldwide prevalence of OA was 41.1‰                                      creased by 33.5 and 31.4%, respectively [2]. In 2017, one
                                                                                       of the three leading causes of YLD in China was muscu-
* Correspondence: fangshiyuan2008@126.com; suhong5151@sina.com                         loskeletal diseases [3]. In particular, OA and RA as the
1
 Department of medical administration, The First Affiliated Hospital of USTC,          two most common musculoskeletal diseases pose major
Division of Life Sciences and Medicine, University of Science and Technology
of China, Hefei 230001, Anhui, China                                                   threats to healthy aging by limiting patients’ physical
2
 Department of Epidemiology and Biostatistics, School of Public Health,                function, quality of life and social participation which in-
Anhui Medical University, Hefei 230032, Anhui, China                                   curred considerable economic and medical burdens to
Full list of author information is available at the end of the article

                                        © The Author(s). 2022 Open Access This article is licensed under a Creative Commons Attribution 4.0 International License,
                                        which permits use, sharing, adaptation, distribution and reproduction in any medium or format, as long as you give
                                        appropriate credit to the original author(s) and the source, provide a link to the Creative Commons licence, and indicate if
                                        changes were made. The images or other third party material in this article are included in the article's Creative Commons
                                        licence, unless indicated otherwise in a credit line to the material. If material is not included in the article's Creative Commons
                                        licence and your intended use is not permitted by statutory regulation or exceeds the permitted use, you will need to obtain
                                        permission directly from the copyright holder. To view a copy of this licence, visit http://creativecommons.org/licenses/by/4.0/.
                                        The Creative Commons Public Domain Dedication waiver (http://creativecommons.org/publicdomain/zero/1.0/) applies to the
                                        data made available in this article, unless otherwise stated in a credit line to the data.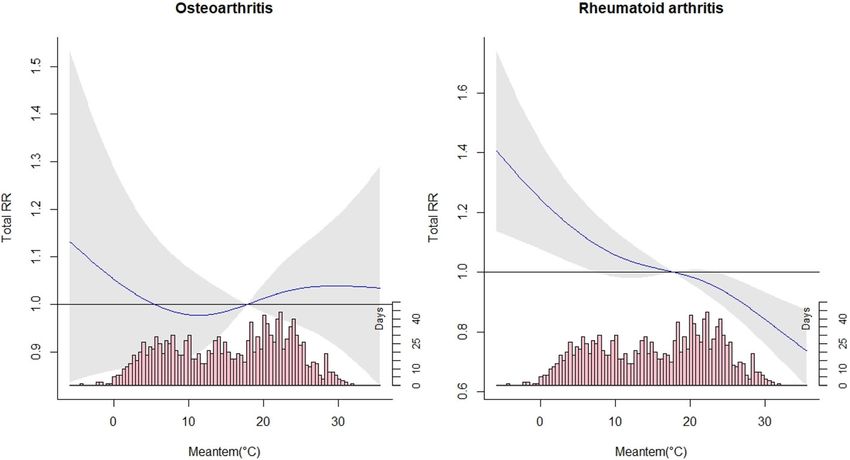
Zhao et al. BMC Public Health   (2022) 22:172                                                                   Page 2 of 8

individuals, families, and governments [4]. Wu et al. [4]     China (Anhui Provincial Hospital). The patient data in-
analyzed average annual percent change (AAPC) for             cluded the date of outpatient admission, age, gender,
OA/RA in China from 1990 to 2017, the AAPC in the             residential address. Diagnosis of OA (ICD-10: M13.9)
age-standardized rate of disability-adjusted life years       and RA (ICD-10: M06.9) was coded according to the
(DALYs) indicated an increasing trend for rheumatoid          International Classification of Disease, 10th Revision
arthritis (0.20, 95% CI: 0.07–0.34), osteoarthritis (0.26,    (ICD-10). Ethical approval was obtained from the Ethics
95% CI: 0.20–0.31), respectively. Given the considerable      Committee of Anhui Provincial Hospital prior to data
disease burden of OA/RA in China, a comprehensive             collection.
understanding of the risk factors for OA/RA is import-
ant for disease prevention and control. Besides genetic,      Weather and air pollutants data
immune and infectious factors, the assumption that            Meteorological data on daily mean temperature, relative
weather influences signs and symptoms of OA and RA is         humidity, rainfall, barometric pressure and wind vel-
widespread.                                                   ocity during the same period were obtained from Hefei
   Previous studies have explored the relationship of joint   Bureau of Meteorology. Air pollution data including
pain in OA/RA with weather conditions [5–15], such as         the average daily level of sulfur dioxide (SO2), nitrogen
temperature and humidity, but with conflicting results        dioxide (NO2), carbon monoxide (CO), ozone (O3),
[15]. For example, some studies reported that                 particulate matter of less than 10 μm and 2.5 μm (PM10
temperature decrease might influence the experience of        and PM2.5) were collected from the Environmental
joint pain in patients with OA/RA [5–7]. However, no          Protection Bureau in Hefei. Consistent with previous
significant association was observed in the findings of       study [17], we chose the 50th percentile of temperature
other studies [10, 13]. This difference may be due to a       (P50, 17.8 °C) as the reference in analyses.
number of factors, including the diverse weather pattern
in different regions, demographic characteristics and         Statistical analysis
methodological limitations. In most previous studies, lit-    We first examined the correlations among weather indi-
tle attention was paid to the lagged effects of               cators and pollutants with Spearman’s correlation test.
temperature change on OA/RA. Therefore, more efforts          Then, we applied a Poisson generalized linear regression
are needed to provide evidence on the risk of experien-       combined with distributed lag non-linear model
cing pain onset with temperature changes, in persons          (DLNM) to examine the non-linear and lagged effects of
with OA/RA. In recent years, time-series analysis has         ambient temperature on outpatient admission for OA/
been increasingly used to assess the impacts of climate       RA, after controlling for long-term trend and seasonality,
change on human health. As one of the most commonly           day of week (DOW), public holidays (Holiday), relative
used statistical approaches in time-series analysis, a dis-   humidity, wind velocity, PM2.5, SO2, NO2 and O3. The
tributed lag nonlinear model (DLNM) has the merit of          core model is expressed as follows:
investigating the exposure-lag-response relationship be-
tween environmental variables and health outcomes,
temperature and various diseases for example [16].                Y t  Poissonðμt Þ Log ðμt Þ ¼ α þ cbðTemperaturet;l Þ
   The aim of this study was to employ DLNM to
                                                                      þ cbðHumidityt;l ; df ¼ 3Þ þ cb Wind t;l ; df ¼ 3
examine the relationship between temperature change
and outpatient admission for OA and RA in Hefei,                      þ cb PM 2:5t;l ; df ¼ 3 þ cb SO2t;l ; df ¼ 3

and explore whether age or gender modified this                       þ cb NO2t;l ; df ¼ 3 þ cb O3t;l ; df ¼ 3
relationship.
                                                                      þ nsðTimet ; df ¼ 8Þ þ ŋDOW t þ γHolidayt
Methods                                                               þ LagðY t ; 1Þ þ LagðY t ; 2Þ
Study area
This study was conducted in Hefei, which is the capital
and largest city of Anhui province in Eastern China with      Where Yt is the number of OA/RA admission on day t;
a population of 8.09 million inhabitants (from 2018 cen-      α represents the intercept;
sus data). Hefei has a humid subtropical climate with a         cb() is a cross-basis function used to models both the
mean temperature of 16.8 °C.                                  exposure effect and lag effect at the same time; l refers
                                                              to the lag days; ns() denotes a natural cubic spline func-
Arthritis data                                                tion using the dlnm package in R. To control long-term
Daily counts of outpatient admission for OA/RA during         time and seasonality, we used a natural cubic spline
2014–2017 were obtained from The First Affiliated             function with 8 degrees of freedom (dfs) per year, along
Hospital of University of Science and Technology of           with an indicator of the day of the week (DOW) and
Zhao et al. BMC Public Health (2022) 22:172 Page 3 of 8
holiday effect. A natural cubic spline with 3 dfs was used Results
to for exposure dimension (mean temperature, humidity, Descriptive statistics
wind velocity, PM2.5, SO2, NO2 and O3) and lag dimen- In total, 24,838 OA cases and 43,935 RA cases were re-
sion (lags 0–4). In order to reduce the influence of ported over the study period. For OA admission, females
model autocorrelation, we added autoregressive terms to and patients aged 41–65 years accounted for 70.6 and
the model to improve the fit of the model. 59.3%, respectively. Of RA admission, there were more
On the basis of the lowest Akaike Information female cases (36,227, 82.5%) and more cases aged 41–65
Criterion (AIC), we selected the maximum lag of 4 days years (38,564, 87.8%). The value of daily mean
to capture any single and cumulative effects of temperature, relative humidity, rainfall and wind velocity
temperature. Because the plot of overall exposure- were 16.8 °C, 75.5%, 3.4 mm and 1.9 m/s, respectively.
response did not find the significant relationship be- The average concentration of PM2.5, SO2, NO2 and O3
tween temperature and OA admission (Fig. 1), we only during the study period were 64.6 μg/m3, 15.7 μg/m3,
quantified the relative risks (RRs) of temperature change 39.5 μg/m3 and 77.9 μg/m3, respectively. Detailed charac-
on RA admission by single day lags at low temperature teristics of the study population, weather indicators and
(25th percentile, P25) compared to the reference air pollutants were presented in Tables 1 and 2.
temperature (50th percentile, P50). Furthermore, we ex-
amined the specific cumulative effects of temperature Pairwise correlation between pollutants and weather
decrease on RA admission by gender (male and female) variables
and age (0–17 years, 18–40 years, 41–65 years and ≥ 66 Spearman’s correlation coefficients between weather var-
years). The statistically significant differences between iables and air pollutants in Hefei were shown in Table 3.
effect estimates in subgroups were examined by the fol- It showed that temperature and relative humidity (rs =
lowing formula: 0.108), rainfall (rs = 0.027), wind velocity (rs = 0.060) were
pffiffiffiffiffiffiffiffiffiffiffiffiffiffiffiffiffiffiffiffiffiffiffiffiffi
c Q2)
(Q1- c ± 1.96 SE 1 2 þ SE 2 2: low. Meanwhile, prior studies reported that humidity in-
c , Q2
c are the estimates for two categories crease can add to the risk of arthritis admission [8].
where Q1
(such as male and female), and SE12, SE22 represent the Thus, humidity and wind velocity were controlled for as
corresponding standard errors [18]. The effects of confounders in the regression model. Similarly, PM2.5,
temperature were estimated and reported as RR and its 95% SO2, NO2 and O3 were included in the regression model.
confidence interval (CI) associated with low temperature at We also observed that mean temperature was highly
different lags. correlated with barometric pressure (rs = − 0.906), and
To test the robustness of our results, sensitivity analyses rainfall was highly correlated with relative humidity (rs =
were performed by varying df for time (7–9 dfs/year), hu- 0.659). Meanwhile, the correlations between PM2.5 and
midity (3–5 dfs) and wind velocity (3–5 dfs), respectively. PM10 (rs = 0.845), CO (rs = 0.788) were high. Therefore,
Data manipulation and analyses were conducted using R in order to avoid the multicollinearity problem, rainfall,
software (version 3.1.1), with the “dlnm” package to fit the barometric pressure, PM10 and CO were not included in
DLNM [16]. the regression model.
Fig. 1 Overall effects of exposure-response associations between temperature change and outpatient admission for OA and RAZhao et al. BMC Public Health (2022) 22:172 Page 4 of 8
Table 1 Characteristics of meteorological variables and air pollutants in Hefei, China, from 2014 to 2017
Indicator Mean ± Percentile
SD
5 25 50 75 95
Mean temperature (°C) 16.8 ± 9.0 2.4 8.8 17.8 24.5 30.1
Relative humidity (%) 75.5 ± 12.9 52.0 67.0 76.0 85.0 95.0
Rainfall (mm) 3.4 ± 10.1 0.0 0.0 0.0 0.9 19.8
Barometric pressure (hpa) 1015 ± 60.0 1000.1 1005.5 1013.3 1021.1 1029.1
Wind velocity (m/s) 1.9 ± 0.7 0.9 1.4 1.8 2.3 3.3
PM10 (ug/m3) 95.0 ± 49.1 31.0 62.0 89.0 118.0 181.9
PM2.5 (ug/m3) 64.6 ± 39.9 20.0 38.5 56.0 81.0 136.0
3
SO2 (ug/m ) 15.7 ± 7.2 8.0 10.0 14.0 19.0 29.0
NO2 (ug/m3) 39.5 ± 18.8 17.1 27.0 35.0 48.0 77.0
CO (mg/m3) 1.0 ± 0.3 0.6 0.8 0.9 1.1 1.6
O3 (ug/m3) 77.9 ± 41.9 25.0 46.0 68.0 103.0 160.0
Relationship between temperature change and admission temperature decrease was significantly associated with
for OA and RA increased risk of RA admission. Significant effects of
Figure 1 showed the exposure-response relationship be- temperature decrease appeared immediately and lasted
tween temperature change and outpatient admission for about 2 days, and its effect was the greatest at the
OA and RA. It suggests that the temperature decrease current day. Compared to the temperature of 17.8 °C, a
was statistically associated with RA admission. In con- 9 °C decrease in temperature was significantly associated
trast, no significant association between temperature with a 5.7% (1.057, 95%CI: 1.005–1.111) increase of RA
change and OA was observed. Hence, our study primar- admission. We also observed that females (P < 0.05) and
ily focuses on the results of the low temperature (P25) patients aged 41–65 years (P < 0.05) were more vulner-
to explore the impact of temperature decrease on the able to the effect of temperature decrease.
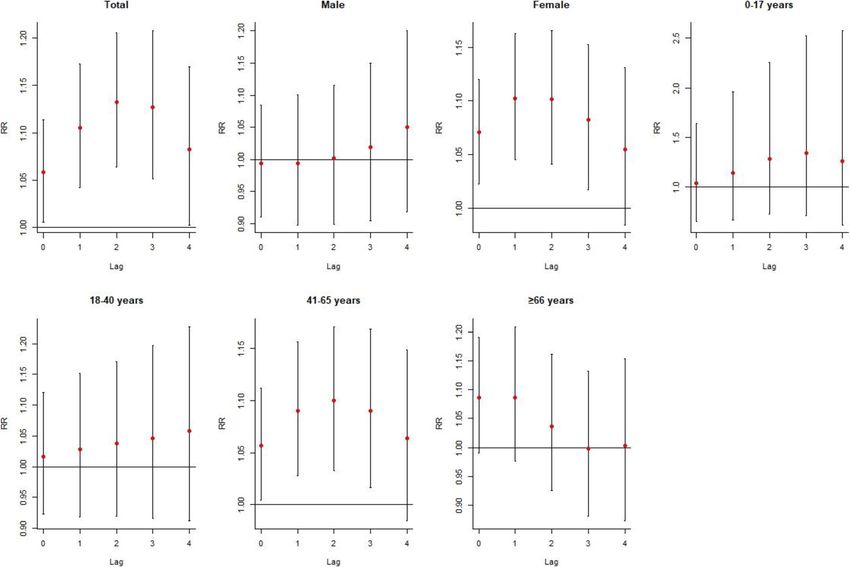
risk of RA admission. The cumulative effects of temperature decrease on RA
Table 4 presents the effects of temperature decrease admission stratified by gender and age were presented in
on RA admission over different lag days, suggesting that Fig. 2. It also indicated that temperature decrease was
Table 2 Characteristics of daily cases for OA and RA in Hefei, China, during 2014–2017
Group Total Mean ± Percentile
admissions SD
5 25 50 75 95
of OA/RA
Osteoarthritis
Total 24,838 17.0 ± 11.8 0.0 7.0 16.0 25.0 38.0
Male 7306 5.0 ± 4.0 0.0 2.0 4.0 7.0 12.0
Female 17,532 12.0 ± 8.6 0.0 5.0 11.0 18.0 27.0
< 17 years 430 0.3 ± 0.6 0.0 0.0 0.0 0.0 1.0
18 ~ years 4526 3.1 ± 2.6 0.0 1.0 3.0 5.0 8.0
41 ~ years 14,732 10.1 ± 7.4 0.0 4.0 9.0 15.0 24.0
66 ~ years 5149 3.5 ± 3.2 0.0 1.0 3.0 5.0 10.0
Rheumatoid arthritis
Total 43,935 30.1 ± 20.1 0.0 7.0 34.0 46.0 58.0
Male 7708 5.28 ± 4.1 0.0 2.0 5.0 8.0 13.0
Female 36,227 24.8 ± 16.8 0.0 6.0 28.0 39.0 49.0
< 17 years 199 0.14 ± 0.4 0.0 0.0 0.0 0.0 1.0
18 ~ years 7297 5.0 ± 3.9 0.0 1.0 5.0 8.0 12.0
41 ~ years 38,564 19.6 ± 13.5 0.0 1.0 5.0 8.0 12.0
66 ~ years 7873 5.39 ± 4.3 0.0 1.0 5.0 9.0 13.0Zhao et al. BMC Public Health (2022) 22:172 Page 5 of 8
Table 3 The Spearman correlation between weather variables and air pollutants during the study period
Indicator Temperature Humidity Rainfall Pressure Wind velocity PM2.5 PM10 SO2 CO NO2 O3
Temperature 1.000 0.108 0.027 −0.906 0.060 −0.390 −0.183 −0.550 −0.308 −0.264 0.553
Humidity 1.000 0.659 −0.237 − 0.065 − 0.188 − 0.419 −0.405 0.028 − 0.284 − 0.292
Rainfall 1.000 − 0.172 0.175 − 0.329 − 0.487 − 0.318 − 0.175 − 0.276 − 0.225
Pressure 1.000 −0.084 0.360 0.211 0.524 0.267 0.306 −0.461
Wind velocity 1.000 −0.292 − 0.304 −0.128 − 0.399 −0.401 0.005
PM2.5 1.000 0.845 0.530 0.788 0.323 −0.207
PM10 1.000 0.585 0.682 0.435 0.012
SO2 1.000 0.511 0.235 −0.322
CO 1.000 0.453 −0.213
NO2 1.000 0.228
O3 1.000
more likely to affect RA admission among females and temperature decrease has acute and delayed adverse
people aged 41–65 years, with the significant multi-day effects on RA admission. However, the non-significant
RR occurring at lag0–0 and continuing to lag0–3 days. association between temperature and OA admission
Additionally, the multi-day metrics of low temperature was observed. With regard to patients with RA, strati-
exposure indicated a larger and prolonged effect on RA fied analyses also provide evidence that females and
admission than single-days exposure. patients aged 41–65 years might be more vulnerable to
temperature decrease than males and patients aged 0–
Sensitivity analyses 40, ≧66 years, respectively.
To investigate whether the results were sensitive to the Our findings for OA might seem puzzling to some
specification of parameters in the model, we changed df readers because it is well known that temperature can
(7–9 per year) for time to control for the long-term affect pain in patients with OA [6, 12, 19]. This could be
trend and seasonality, and found the estimated effects of caused by a cognitive misattribution. If a patient believes
temperature did not change substantially (Supplemen- that cold causes arthritis pain, he or she will pay much
tary Fig. S1). Moreover, we got similar results when attention to temperature decrease with much pain and
changing df (3–5) for humidity and wind velocity go to the hospital. Meanwhile, many studies have been
(Supplementary Figs. S2 and S3). conducted in an attempt to establish the relationship be-
tween temperature change and OA [8, 19], but many of
Discussion these studies with methodological limitations that may
The influence of temperature on OA/RA pain is con- have to affect their validity to some extent. For instance,
troversial and several published studies have not dem- the study by Strusberg in the field was based on the
onstrated a definite relationship between temperature correlation analysis [6], and this method has various
change and OA/RA admission. This is the first time- shortcomings (e.g. not adjusted for confounder and not
series study so far to quantify the associations between provide the value of relative risk). Although several
temperature change and OA/RA admission with a studies have attempted to use the regression model to
large number of patients. Our results indicate that explore the relationship between temperature and OA
Table 4 The effects of temperature decrease on RA admission at various lag days in Hefei, China, with 25th percentile of
temperature relative to 50th percentile
Group Lag0 Lag1 Lag2 Lag3 Lag4
Total 1.057 (1.005–1.111)* 1.044 (1.019–1.069)* 1.024 (0.986–1.064) 0.995 (0.971–1.019) 0.960 (0.913–1.010)
Male 0.994 (0.912–1.083) 1.000 (0.960–1.042) 1.007 (0.944–1.075) 1.017 (0.976–1.060) 1.028 (0.943–1.120)
Female 1.069 (1.022–1.118)* 1.030 (1.008–1.052)* 0.999 (0.966–1.034) 0.983 (0.962–1.004) 0.974 (0.931–1.019)
0–17 years 1.040 (0.662–1.633) 1.098 (0.890–1.354) 1.111 (0.795–1.552) 1.048 (0.842–1.304) 0.947 (0.609–1.473)
18–40 years 1.017 (0.924–1.119) 1.012 (0.967–1.059) 1.009 (0.938–1.085) 1.008 (0.963–1.056) 1.009 (0.917–1.112)
41–65 years 1.056 (1.005–1.110)* 1.031 (1.007–1.056)* 1.009 (0.971–1.048) 0.991 (0.967–1.015) 0.975 (0.928–1.025)
≥66 years 1.083 (0.990–1.186) 1.001 (0.960–1.048) 0.956 (0.892–1.023) 0.964 (0.923–1.006) 1.004 (0.917–1.099)
* indicates statistical significance (P < 0.05)Zhao et al. BMC Public Health (2022) 22:172 Page 6 of 8 Fig. 2 The specific cumulative effects of temperature decrease on RA admission by gender, age and classification of arthritis at different lag days, with P25 of temperature versus P50 [8, 20], the delayed effects of ambient temperature on reported low temperature exposure augments pain in an OA have not been investigated. Our findings are based animal model were mainly mediated by sympathetic on the results of a time-series study and have a number nerve [24]. Nevertheless, the further studies focus on this of strengths compared to past research. complex area are still required. The traditional belief of “Cold and wet is bad, warm Based on the literature review, the evidence on physio- and dry is good for RA patients” seems to be true [21]. logical reasons or psychological reasons for the different This study found that temperature decrease could in- results between OA and RA is lacking. In Hefei, for crease risk of RA admission, which is consistent with patients who are more likely to believe that weather can several previous studies [5–7, 22]. The underlying mech- influence their RA pain, the causes may be unknown, anism as to why temperature decrease could affect RA but the effect is real. Future studies are urgently needed admission is not clear enough. Abasolo et al. proposed a to explore the mechanisms underlying the association hypothesis that cold can trigger some diseases such as between temperature decrease and increased RA crioglobulinemia or Raynaud phenomenon, both closely admission. related to rheumatic diseases [5]. It may be possible that Understanding the characteristics of susceptible popu- muscles also play a role in relation to flares or pain in lations is important for policy makers to develop tar- RA patients and cold weather, due to coldness stiffens geted interventions [25]. A limited number of previous muscles around the joints that can worsen the arthritis studies have reported that individual characteristics such symptoms. Another explanation is the involvement of as age might modify the risk of weather factors on RA autonomic nerves to regulate the threshold of pain. An disease [5]. In this study, subgroup analysis by gender animal study by the Sato group found that both de- found that female patients were more sensitive to creased temperature and air pressure led to the worsen- temperature decrease than male patients, which might ing of joint pain in arthritic rats [23]. This group also be partly to differential body composition [26]. The age-
Zhao et al. BMC Public Health          (2022) 22:172                                                                                                  Page 7 of 8

stratified analysis indicated that the association between                        Supplementary Information
temperature decrease and RA onset was significantly                               The online version contains supplementary material available at https://doi.
                                                                                  org/10.1186/s12889-021-11994-0.
observed in patients aged 41–65 years, and this effect
disappeared in other age groups. The reason might be                               Additional file 1: Fig. S1. The overall effects of temperature change on
the fact that age itself is a risk factor for disability, thus                     OA/RA admission when changing the df (7–9 df/year) for time.. Fig. S2. The
the elderly could have in general more difficulty to go to                         overall effects of temperature change on OA/RA admission when varying the
                                                                                   df (3–5) for relative humidity. Fig. S3. The overall effects of temperature
the hospital in time by themselves. Meanwhile, rheum-                              change on OA/RA admission when varying the df (3–5) for wind velocity.
atic pain is usually considered to be a natural part of the
aging process. In order not to interfere with their study
                                                                                  Acknowledgements
and work, young people may take other ways rather than                            We would like to acknowledge and thank all of the participants in this study.
going to the hospital to control their RA symptoms [5].
  There were two major strengths in this study. To                                Authors’ contributions
                                                                                  DZ and HS conceived and designed the study. HW, YZ and FL collected and
the best of our knowledge, this is the first research to                          arranged the data. DZ conducted data analysis. DZ, PB and SF drafted the
quantify both lagged and non-linear relationships                                 manuscript. JC, XW and HS revised the manuscript. All authors read and
between temperature and RA. Additionally, our study                               approved the final manuscript.
collected 4 years data, controlled for air pollutants
                                                                                  Funding
and explored the possible modification of confounders                             No external funding was required for this work.
(e.g., gender and age) to examine the association be-
tween temperature change and RA admission. Several                                Availability of data and materials
                                                                                  The data analyzed during the study are not publicly available due to the
limitations of our study should also be noted. Firstly,                           data also forms part of an ongoing study but are available from the
the data were collected from one city, restricting our                            corresponding author on reasonable request.
findings to be generalized to other regions of distinct
weather pattern. Secondly, due to the confidentiality                             Declarations
of information, we failed to obtain the patient data                              Ethics approval and consent to participate
from other hospitals. Meanwhile, some patients may                                Data collection, the permission to access and use the data were agreed by
not go to the hospital. These factors limited us to ex-                           the Ethics Committee of Anhui Provincial Hospital.
plore the true association and may cause results bias.
                                                                                  Consent for publication
Thirdly, consistent with previous ecological studies,                             Not applicable.
exposure misclassification should not be ignored be-
cause population exposure was used to represent per-                              Competing interests
                                                                                  The authors declare they have no competing financial interests.
sonal exposure and air-conditioning was usually used
in cold seasons. Fourthly, due to multiple compari-                               Author details
                                                                                  1
sons for subgroup analyses, the type I error inflation                             Department of medical administration, The First Affiliated Hospital of USTC,
                                                                                  Division of Life Sciences and Medicine, University of Science and Technology
cannot be excluded.                                                               of China, Hefei 230001, Anhui, China. 2Department of Epidemiology and
                                                                                  Biostatistics, School of Public Health, Anhui Medical University, Hefei 230032,
                                                                                  Anhui, China. 3Nursing Department, The First Affiliated Hospital of USTC,
Conclusions                                                                       Division of Life Sciences and Medicine, University of Science and Technology
Temperature decrease was significantly associated with an                         of China, Hefei 230001, Anhui, China. 4Information Center, The First Affiliated
                                                                                  Hospital of USTC, Division of Life Sciences and Medicine, University of
increased risk of RA admission. Females and patients aged                         Science and Technology of China, Hefei 230001, Anhui, China. 5Anhui
41–65 years were more sensitive to temperature decrease                           Provincial Children’s Hospital, Hefei, Anhui Province, China.
than males and other age groups, respectively. As climate
                                                                                  Received: 7 July 2020 Accepted: 12 October 2021
change progresses, the temperature change will be more
frequent, and patients may be at greater risk of RA onset
associated with temperature decrease. Our findings                                References
                                                                                  1. Nagase H, Murphy G. Metalloproteinases in Cartilage Matrix Breakdown: The
highlighted that the public health sector, medical staff and                          Roles in Rheumatoid Arthritis and Osteoarthritis. In: Brix K, Stöcker W,
carers of RA patients should pay attention to temperature                             editors. Proteases: Structure and Function. Vienna: Springer; 2013.
decrease when controlling and preventing RA onset.                                2. GBD 2017 Disease and Injury Incidence and Prevalence Collaborators.
                                                                                      Global, regional, and national incidence, prevalence, and years lived with
                                                                                      disability for 354 diseases and injuries for 195 countries and territories,
Abbreviations                                                                         1990–2017: a systematic analysis for the Global Burden of Disease Study
AAPC: Average annual percent change; AIC: Akaike Information Criterion;               2017. Lancet. 2018;392(10159):1789–858.
CO: Carbon monoxide; dfs: Degrees of freedom; DALYs: Disability-adjusted life     3. Zhou M, Wang H, Zeng X, Yin P, Zhu J, Chen W, et al. Mortality, morbidity,
years; DLNM: Distributed lag nonlinear model; DOW: Day of week; GBD: Global           and risk factors in China and its provinces, 1990-2017: a systematic analysis
Burden of Disease; ICD: International Classification of Disease; NO2: Nitrogen        for the global burden of disease study 2017. Lancet. 2019;394(10204):1145–
dioxide; OA: Osteoarthritis; O3: Ozone; PM10: Particulate matter of less than         58. https://doi.org/10.1016/S0140-6736(19)30427-1.
10 μm; PM2.5: Particulate matter of less than 2.5 μm; RA: Rheumatoid arthritis;   4. Wu D, Wong P, Guo C, Tam LS, Gu J. Pattern and trend of five major
RR: Relative risk; SO2: Sulfur dioxide; YLD: Years lived with disability.             musculoskeletal disorders in China from 1990 to 2017: findings from the
Zhao et al. BMC Public Health (2022) 22:172 Page 8 of 8
global burden of disease study 2017. BMC Med. 2021;19(1):34. https://doi.
org/10.1186/s12916-021-01905-w.
5. Abasolo L, Tobías A, Leon L, Carmona L, Fernandez-Rueda JL, Rodriguez AB,
et al. Weather conditions may worsen symptoms in rheumatoid arthritis
patients: the possible effect of temperature. Reumatol Clin. 2013;9(4):226–8.
https://doi.org/10.1016/j.reuma.2012.09.006.
6. Strusberg I, Mendelberg RC, Serra HA, Strusberg AM. Influence of weather
conditions on rheumatic pain. J Rheumatol. 2002;29(2):335–8.
7. Tsai WS, Yang YH, Wang LC, Chiang BL. Abrupt temperature change triggers
arthralgia in patients with juvenile rheumatoid arthritis. J Microbiol Immunol
Infect. 2006;39(6):465–70.
8. Peultier L, Lion A, Chary-Valckenaere I, Loeuille D, Zhang Z, Rat AC, et al.
Influence of meteorological elements on balance control and pain in
patients with symptomatic knee osteoarthritis. Int J Biometeorol. 2017;61(5):
903–10. https://doi.org/10.1007/s00484-016-1269-x.
9. Hill DF. Climate and arthritis. In: Hollander JL, McCarty DC, editors. Arthritis
and allied conditions: a textbook of rheumatology. Philadelphia: Lea &
Febiger; 1972. p. 256–63.
10. Savage EM, McCormick D, McDonald S, Moore O, Stevenson M, Cairns AP.
Does rheumatoid arthritis disease activity correlate with weather conditions?
Rheumatol Int. 2015;35(5):887–90. https://doi.org/10.1007/s00296-014-3161-5.
11. Sibley JT. Weather and arthritis symptoms. J Rheumatol. 1985;12(4):707–10.
12. Vergés J, Montell E, Tomàs E, Cumelles G, Castañeda G, Marti N, et al.
Weather conditions can influence rheumatic diseases. Proc West Pharmacol
Soc. 2004;47:134–6.
13. Ferreira ML, Zhang Y, Metcalf B, Makovey J, Bennell KL, March L, et al. The
influence of weather on the risk of pain exacerbation in patients with knee
osteoarthritis - a case-crossover study. Osteoarthr Cartil. 2016;24(12):2042–7.
https://doi.org/10.1016/j.joca.2016.07.016.
14. Terao C, Hashimoto M, Furu M, Nakabo S, Ohmura K, Nakashima R, et al.
Inverse association between air pressure and rheumatoid arthritis synovitis.
PLoS One. 2014;9(1):e85376. https://doi.org/10.1371/journal.pone.0085376.
15. Smedslund G, Hagen KB. Does rain really cause pain? A systematic review of
the associations between weather factors and severity of pain in people
with rheumatoid arthritis. Eur J Pain. 2011;15(1):5–10. https://doi.org/10.101
6/j.ejpain.2010.05.003.
16. Gasparrini A, Armstrong B, Kenward MG. Distributed lag non-linear models.
Stat Med. 2010;29(21):2224–34. https://doi.org/10.1002/sim.3940.
17. Zhao D, Zhang X, Xie M, Cheng J, Zhang H, Wang S, et al. Is greater
temperature change within a day associated with increased emergency
admissions for schizophrenia? Sci Total Environ. 2016;566–567:1545–155.
18. Altman DG, Bland JM. Interaction revisited: the difference between two
estimates. BMJ. 2003;326(7382):219. https://doi.org/10.1136/bmj.326.7382.219.
19. McAlindon T, Formica M, Schmid CH, Fletcher J. Changes in barometric
pressure and ambient temperature influence osteoarthritis pain. Am J Med.
2007;120(5):429–34. https://doi.org/10.1016/j.amjmed.2006.07.036.
20. Timmermans EJ, Schaap LA, Herbolsheimer F, Dennison EM, Maggi S, Pedersen
NL, et al. The influence of weather conditions on joint pain in older people
with osteoarthritis: results from the European project on OSteoArthritis. J
Rheumatol. 2015;42(10):1885–92. https://doi.org/10.3899/jrheum.141594.
21. Patberg WR, Rasker JJ. Weather effects in rheumatoid arthritis: from
controversy to consensus. A review. J Rheumatol. 2004;31(7):1327–34.
22. Aikman H. The association between arthritis and the weather. Int J
Biometeorol. 1997;40(4):192–9. https://doi.org/10.1007/s004840050041.
23. Sato J, Aoyama M, Yamazaki M, Okumura S, Takahashi K, Funakubo M, et al.
Artificially produced meteorological changes aggravate pain in adjuvant
-induced arthritic rats. Neurosci Lett. 2004;354(1):46–9. https://doi.org/10.101
6/j.neulet.2003.09.057.
24. Sato J, Morimae H, Takanari K, Seino Y, Okada T, Suzuki M, et al. Effects of
lowering ambient temperature on pain-related behaviors in a rat model of
neuropathic pain. Exp Brain Res. 2000;133(4):442–9. https://doi.org/10.1007/
s002210000451.
25. McMichael AJ. Globalization, climate change, and human health. N Engl J
Med. 2013;369(1):96. https://doi.org/10.1056/NEJMc1305749.
26. Frascarolo P, Schutz Y, Jequier E. Decreased thermal conductance during
the luteal phase of the menstrual cycle in women. J Appl Physiol. 1990;
69(6):2029–33. https://doi.org/10.1152/jappl.1990.69.6.2029.
Publisher’s Note
Springer Nature remains neutral with regard to jurisdictional claims in
published maps and institutional affiliations.You can also read