Online course - Methodologies for Quantifying Renewable ...
←
→
Page content transcription
If your browser does not render page correctly, please read the page content below

Online course

Online course
Methodologies for Quantifying Renewable
Energy Employment Impacts

 © Renewables Academy (RENAC) AG
 This copyrighted course is part of the series of online study programmes offered by the Renewables
 Academy AG. The course materials are provided exclusively for personal or curriculum and course-
 related purposes to enrolled students and registered users only. Any further use of this material shall
 require the explicit consent of the copyright and intellectual property rights holders, Renewables
 Academy AG. This material or parts of it may neither be reproduced nor in any way used or disclosed
 or passed on to third parties. Any unauthorised use or violation will be subject to private law and will
 be prosecuted.

 Page 1 of 50
 20/07/2021
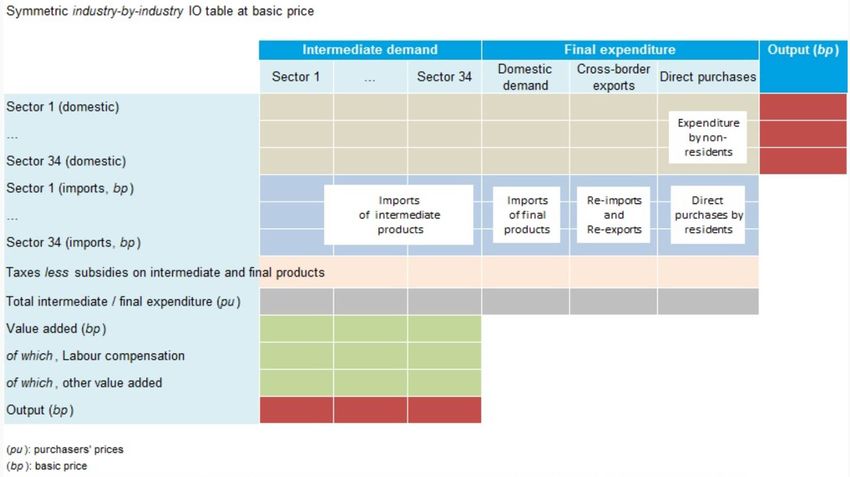
Table of contents
1 Introduction .............................................................................................................................. 3
 1.1 Introduction to the Course and Learning Goals .................................................................. 3
2 Renewable Energy Employment Categories .............................................................................. 5
 2.1 Types of Employment: Theory ........................................................................................... 5
 2.2 Types of Employment: Case Study ..................................................................................... 7
 2.3 Scope of Analysis (Net and Gross Employment Analysis): Theory ....................................... 9
 2.4 Scope of Analysis (Net and Gross Employment): Case Study ............................................ 11
3 Methodologies for Quantifying Employment Impacts: Overview & Employment Factor Analysis
 13
 3.1 Overview: Discussion of Data Availability and Granularity................................................ 13
 3.2 Employment Factor Analysis - General Functions............................................................. 14
 3.3 Employment Factor Analysis: Required Data and Calculation Steps ................................. 16
 3.4 Employment Factor Analysis: Limitations and Advantages (Pros and Cons) ...................... 18
 3.5 Employment Factor Analysis: South Africa Case Study ..................................................... 20
4 Methodologies for Quantifying Employment Impacts: Gross Input-output Models ............... 22
 4.1 Gross Input-output Models - General Functions .............................................................. 22
 4.2 Gross Input-output Models - Required Data and Calculation Steps .................................. 24
 4.3 Gross Input-output Models: Limitations and Advantages (Pros and Cons)........................ 27
 4.4 Gross Input-output Models: Vietnam Case Study ............................................................. 29
5 Methodologies for Quantifying Employment Impacts: Full Economic Modelling .................... 32
 5.1 Full Economic Modelling: General Functions ................................................................... 32
 5.2 CGE Models: Required Data and Calculation Steps .......................................................... 34
 5.3 CGE Models: Limitations and Advantages (Pros and Cons) ............................................... 37
 5.4 Full Economic Modelling: COBENEFITS Case Study in South Africa ................................... 38
6 Methodologies for Quantifying Employment Impacts: Overview of Open-access Online Tools
 41
 6.1 Overview of Open-access Online Tools: The I-JEDI tool .................................................... 41
 6.2 Overview of Open-access Online Tools: The EIM-ES Tool ................................................. 43
 6.3 Overview of Open-access Online Tools: ELMA ................................................................. 45
7 Summary................................................................................................................................. 47
8 References (cited) ................................................................................................................... 47

 Page 2 of 50
 20/07/2021
1 Introduction
 1.1 Introduction to the Course and Learning Goals
Learning objectives: Upon completion of this course, you should be able to
 • describe why employment is a key social and economic co-benefit of renewable energy
 • list tools and methodologies for assessing and quantifying the employment impacts of
 renewable energy
 • compare the advantages and disadvantages of different assessment methodologies
 • identify affordable or free tools that are available for making assessments
 • apply some simple assessment tools and methodologies in practice

This course will train participants in techniques to identify, quantify, and communicate the employment
impacts of renewable energy. You will gain insight into methodologies, tools, background knowledge,
and case studies, all of which will support you in assessing and quantifying employment impacts as co-
benefits of renewable energy. Beyond the theoretical knowledge you will gain, the intention of the
course is to assist you in running and conducting analyses in your own country or region, and to help
you apply the tools and methodologies in practice.
In the chapter two, the course analyses renewable energy employment categories and explains the
differences between various types of employment (i.e. direct, indirect, and induced jobs) and effects
(i.e. net and gross employment effects).
In the first part of chapter three, the course provides deeper insights into three specific methodologies
for quantifying the employment impacts of renewable energy; namely, employment factor analysis,
gross input-output models, and full economic modelling. For each of these methodologies we will
provide an overview of the general functioning, elaborate on specific calculation steps and data
requirements, discuss advantages and limitations, and look into one location-specific case study. In the
second part of chapter three, the course offers brief introductions to some online tools available for
making assessments in practice, including the I-JEDI tool, the EIM-ES tool, and ELMA.

 Page 3 of 50
 20/07/2021
Overview of course modules and topics (author’s own depiction)

 Page 4 of 50
 20/07/2021
2 Renewable Energy Employment Categories
 2.1 Types of Employment: Theory
Learning objectives: Upon completion of this page, you should be able to
 • define direct, indirect, and induced employment effects
 • differentiate between direct, indirect, and induced employment effects
 • explain the relevance of direct, indirect, and induced effects in terms of employment impacts

In addition to the positive climate change mitigation effects of expanding renewable energy, the
economic impacts of implementing renewable energy projects are of great interest to policy makers.
One important indicator of positive economic effects is employment growth which is not limited to the
renewable energy project itself and which therefore has an impact on the wider economy. This course
takes a look at three types of employment effects [1]:
 • Direct employment effects: primary effects that arise directly from a certain renewable energy
 project, e.g. new jobs created directly by a new hydropower plant
 • Indirect employment effects: secondary effects and jobs created in related input sectors, e.g.
 jobs in supply sectors, such as those providing building materials for the hydropower plant
 • Induced employment effects: economy-wide effects, or jobs created in sectors that are not
 directly related to renewable energies. These include jobs created through services or goods
 provided to people affected by direct or indirect effects, e.g. increased demand for certain
 services and consumer goods from people working for the newly-constructed hydropower
 plant leads to new jobs being created in local restaurants or shops [1, 2]

Figure 1 summarises the different kinds of employment effects detailed above. It can be seen that the
employment effects of renewable energy deployment are often much more far-reaching than the
immediate and direct impacts alone.

 Figure 1: Creation of direct, indirect and induced jobs in the solar industry (author’s own depiction)

 Page 5 of 50
 20/07/2021
Direct employment effects can be calculated quite easily, but there is no clear-cut computation method
for indirect or induced effects; therefore, it may be more difficult to isolate such effects [3]. Also, the
time period within which the effects might happen is usually not fixed. Generally, direct effects occur
within a shorter time frame, while induced effects may take longer to spread throughout the economy
[4].

References:
[1]: Breitschopf, B., Nathani, C., and Resch, G., 2011: Review of Approaches for Employment Impact
 Assessment of Renewable Energy Deployment (2011), pages 4–5, http://iea-retd.org/wp-
 content/uploads/2011/11/EMPLOY-task-1.pdf
[2]: Jacob, K; Quitzow, R. and Bär, H., 2015: Green jobs: Impacts of a Green Economy on
 Employment, pages 42–44, https://www.researchgate.net/publication/273767132_
 Green_Jobs_Impacts_of_a_Green_Economy_on_Employment
[3]: Gioutsos, D. and Och, A., 2017: The Employment Effects of Renewable Energy Development
 Assistance, pages 2–4.
[4]: Centre for Strategy and Evaluation Services, 2006: Study on Measuring Employment Effects,
 page 58, https://ec.europa.eu/regional_policy/sources/docgener/evaluation/pdf/empl
 effect06.pdf

Further reading:
This theoretical framework by the German Federal Ministry for Economic Cooperation and
Development, about how to measure the employment impacts of development cooperation, includes
further information about the classification of different employment effects:
 • https://energypedia.info/images/5/54/A_Systematic_Framework_for_Measuring_Employme
 nt_Impacts_of_Development_Cooperation_Interventions.pdf.

GIZ has published a guidebook for practitioners on how to conduct policy impact assessments. It
includes an in-depth overview of different methods for identifying direct, indirect, and induced effects:
 • GIZ (Deutsche Gesellschaft für Internationale Zusammenarbeit): Planning Policy Impact
 Assessments and Choosing the Right Methods – Manual for Development Practitioners, Bonn,
 2016; available at http://www.gws-os.com/downloads/giz2016-en-Planning_Policy_Impact_
 Assessments.pdf

 Page 6 of 50
 20/07/2021
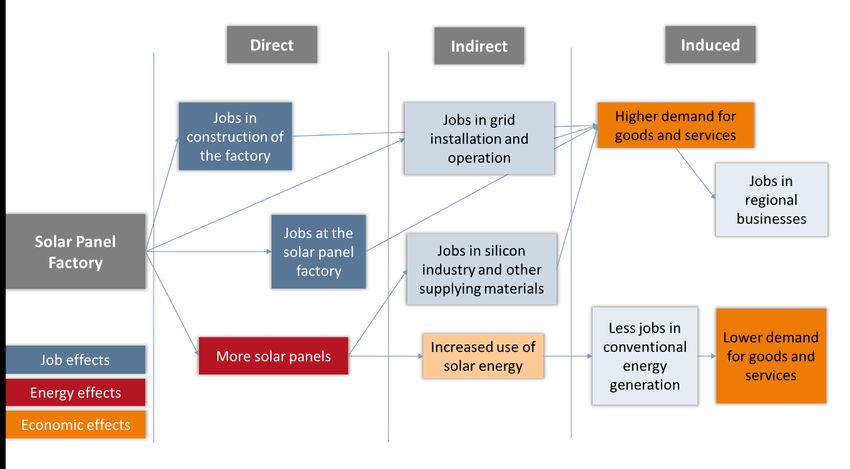
2.2 Types of Employment: Case Study
Learning objectives: Upon completion of this page, you should be able to
 • recognise examples of direct, indirect, and induced effects
 • identify direct, indirect, and induced effects in real case examples

The construction of a solar panel factory generates new jobs, not only at the factory itself, but in linked
business areas as well – as demonstrated below. Figure 2 visualises the different impacts and the
connections between them.
 Direct effects: At first, jobs are created at the construction site for the factory. Following the
 construction phase, new manufacturing jobs will be available at the solar panel factory itself.
 Indirect effects: Due to the increased production of solar panels, additional jobs are created in
 grid installation and operation, as well as in the silicon industry and other sectors which supply
 materials.
 Induced effects: All workers employed in the above areas profit from a higher income, and
 spend their it on consumer goods and services. As a consequence, business owners supplying
 the workers expand their businesses, by employing more people or by opening new branches.
 However, if the use of solar energy rises, due to the increased availability of solar panels, this
 may lead to less demand for energy from conventional energy sources (e.g. fossil fuels). As a
 result, employees in these industries may lose their jobs, and will consequently demand less
 goods and services [1].

 Figure 2: The direct, indirect, and induced effects of constructing a solar panel factory (author’s own
 depiction, based on Bacon & Kojima, 2011) [1]

The boundaries between definitions of direct, indirect, and induced effects are not precisely defined.
For example, if only jobs in construction of the solar panel factory are regarded as a direct effect, new
jobs at the solar panel factory might be considered an indirect effect [2].

 Page 7 of 50
 20/07/2021
References:
[1]: Bacon, R. and Kojima, M., 2011: Issues in estimating the employment generated by energy
 sector activities, https://citeseerx.ist.psu.edu/viewdoc/download?doi=10.1.1.
 474.4306&rep=rep1&type=pdf, 29-30
[2]: Breitschopf, B., Nathani, C., and Resch, G., 2011: Review of Approaches for Employment Impact
 Assessment of Renewable Energy Deployment (2011), pages 17–18, http://iea-retd.org/wp-
 content/uploads/2011/11/EMPLOY-task-1.pdf

Further reading:
The latest numbers on (direct) employment generation in 2019, by country and by type of renewable
energy, were published in this report by IRENA:
 • https://www.irena.org/-/media/Files/IRENA/Agency/Publication/2019/Jun/IRENA_RE_Jobs_
 2019-report.pdf

ILO also published a report on how jobs in the renewables sector can contribute to advancing towards
a green economy. The report contains a lot of information on the expected employment numbers in
different energy sectors and countries:
 • https://www.ilo.org/weso-greening/documents/WESO_Greening_EN_chap2_web.pdf

 Page 8 of 50
 20/07/2021
2.3 Scope of Analysis (Net and Gross Employment Analysis): Theory
Learning objectives: Upon completion of this page, you should be able to
 • define gross and net effects
 • differentiate between gross and net effects
 • explain how gross and net effects are relevant to employment impacts

There are different options and levels of complexity for calculating gross and net effects. To measure
the employment impact of renewable energy deployment, a low to medium complexity approach is
used. Other calculation methodologies do not include induced effects, or make distinctions between
sectoral and economy-wide perspectives:
 = ( , )
Gross effects capture the positive impact on the economy by including only newly generated direct,
indirect, or induced jobs in the renewable energy and related upstream sectors, as well as in the wider
economy. However, gross effect is not a realistic measure of the employment effect on the overall
economy, because it neglects any negative effects.
Therefore, we also have to calculate the net effect:
 = − ( , )
The net effect comprises all the positive and negative effects that arise within the renewable energy
sector, and outside of it. If new wind farms are built, all newly generated jobs at the wind farms, in
supplying sectors, and in related businesses represent positive effects. At the same time, a negative
employment effect occurs, because jobs in the fossil fuel industry may be lost and the respective
supplying sectors and related businesses experience a lower turnover, which leads to additional job
losses.
In order to calculate the net employment effect of a renewable energy project, a renewable energy
project scenario is compared with a business-as-usual scenario. The total of jobs lost in other sectors
due to the renewable energy project is deducted from the total of jobs created by the renewable
energy project [1-3]. Figure 3 summarises the differences between the gross and net effects.

 Figure 3: Overview of gross and net effects (author’s own depiction, based on Borbonus, 2017) [4]

 Page 9 of 50
 20/07/2021
References:
[1]: Duscha, V.; Ragwitz, M.; Breitschopf, B.; Schade, W.; Walz, R. and Pfaff, M., 2014: Employment
 and growth effects of sustainable energies in the European Union, pages 6–8,
 https://ec.europa.eu/energy/sites/ener/files/documents/EmployRES-II%20final%20
 report_0.pdf
[2]: Jacob, K; Quitzow, R. and Bär, H., 2015: Green jobs: Impacts of a Green Economy on
 Employment, page 19, https://www.researchgate.net/publication/273767132_
 Green_Jobs_Impacts_of_a_Green_Economy_on_Employment
[3]: Kluve, J. and Stöterau, J., (n.a.), A Systematic Framework for Measuring Aggregate Employment
 Impacts of Development Cooperation, page 21,
 https://energypedia.info/images/5/54/A_Systematic_Framework_for_Measuring_Employment_
 Impacts_of_Development_Cooperation_Interventions.pdf
[4]: Borbonus, S., 2017: Generating socio-economic values from renewable energies, pages 4–6,
 https://www.iass-potsdam.de/sites/default/files/files/iass_2017_cobenefits_assessment_
 methods.pdf

Further reading:
This paper conducts a meta-analysis of the empirical literature on net employment effects, including
over 30 journal articles:
 • https://www.sciencedirect.com/science/article/pii/S0301421519306342

Another meta-analysis of 23 impact studies can be found here:
 • https://www.wifo.ac.at/bibliothek/archiv/36286/WWWforEurope_PP_12.pdf

This study reviews a large number of gross and net employment impact studies, and provides a deeper
theoretical foundation for computation methods:
 • http://iea-retd.org/wp-content/uploads/2011/11/EMPLOY-task-1.pdf

 Page 10 of 50
 20/07/2021
2.4 Scope of Analysis (Net and Gross Employment): Case Study
Learning objectives: Upon completion of this page, you should be able to
 • recognise examples of gross and net effects in real cases
 • analyse simple gross / net effect calculations in real cases

In order to replace an old coal-fired power plant, a new 4 GW wind project is being implemented. Figure
4 illustrates the potential gross and net effects of the construction, in terms of job years generated.
Two options (A and B) describe possible scenarios for the design of this project, each of which create
different positive and negative effects.
Gross effect: Direct jobs are created in constructing the wind turbines and monitoring their functioning.
Indirect and induced jobs also emerge in the steel industry, in other industries supplying material for
constructing wind turbines, and in local restaurants and shops. While the positive impacts yield a
positive gross effect for both options, the gross effect for Option B is higher than for Option A.
Net effect: The positive gross effect translates into a higher income for all workers benefiting from the
direct and indirect jobs. The workers spend their new income on consumer goods and services, which
in turn leads to increased profit and new jobs being created in the affected sectors (positive effects).
However, the nearby coal power plant closes down, and its workers lose their jobs. Consequently, the
unemployed workers consume less, and all the supplying sectors and businesses related to the coal
power plant experience declining turnover and may have to make staff redundant (negative effects).
Depending on the magnitude of the negative effects, the net impact may still remain positive (Option
A) or it may become negative (Option B) [1, 2].

 Figure 4: Project example of employment effects (author’s own depiction, based on Bacon & Kojima,
 2011) [1]

References:
[1]: Bacon, R. and Kojima, M., 2011: Issues in estimating the employment generated by energy
 sector activities, https://citeseerx.ist.psu.edu/viewdoc/download?doi=10.1.1.
 474.4306&rep=rep1&type=pdf, 29-30

 Page 11 of 50
 20/07/2021
[2]: Duscha, V.; Ragwitz, M.; Breitschopf, B.; Schade, W.; Walz, R. and Pfaff, M., 2014: Employment
and growth effects of sustainable energies in the European Union, pages 6–8,
https://ec.europa.eu/energy/sites/ener/files/documents/EmployRES-II%20final%20
report_0.pdf

Further reading:

A case study about the German energy transition can be found here:
 • https://wol.iza.org/uploads/articles/519/pdfs/employment-effects-of-green-energy-
 policies.pdf

Another case study about Australia divesting from coal is available here:
 • https://www.climatecouncil.org.au/uploads/7b40d7bbefbdd94979ce4de2fad52414.pdf

The ILO and IRENA published this policy brief about progress towards SDG 7, due to interlinkages
between energy and jobs:
 • https://sustainabledevelopment.un.org/content/documents/17495PB13.pdf

 Page 12 of 50
 20/07/2021
3 Methodologies for Quantifying Employment Impacts: Overview & Employment Factor Analysis
 3.1 Overview: Discussion of Data Availability and Granularity
Learning objectives: Upon completion of this page, you should be able to
 • identify use cases for different assessment methodologies
 • state the main data requirements for quantifying employment impacts

There are various specific methodologies for calculating the employment impacts of renewable energy.
Three of the approaches to quantifying job effects are summarised below:
 • Employment Factor Analysis is a relatively simple approach for assessing the direct job effects
 of different scenarios, regarding growth or changes in sectors/technologies. Information on
 installed capacity/electricity generation and the employment factor are the key data required
 for this analysis. This information is often provided in publicly available sources.
 • Gross Input-Output (I-O) Models focus on linkages and supply chains between economic
 sectors. They can be used to estimate both direct and indirect economic effects. Beyond data
 from I-O tables (e.g. monetary data on the flow of goods and services), the calculation process
 requires information on newly added and total capacity, average salaries in a given sector,
 technology-specific employment factors, etc. I-O tables are often publicly available, but they
 rely on heavy data input from national statistics offices and are not always fully up to date.
 • Full Economic Modelling methodologies, such as Computable General Equilibrium (CGE)
 models, are the most comprehensive and complex of the three approaches. CGE models
 enable assessments of net job effects and are able to reflect economy-wide impacts, taking
 into account a large range of shifting parameters in the economy. The complex calculation
 process requires many assumptions and inputs, such as a statistical basis (e.g. a social
 accounting matrix [SAM], or I-O tables), and data on exogenous elasticities and
 macroeconomic constraints (e.g. tax rates, inflation, etc.), which are analysed via software.

 Figure 5: Use cases for methodologies for the calculation of gross and net employment effects
 (author’s own depiction)

 Page 13 of 50
 20/07/2021
3.2 Employment Factor Analysis - General Functions
Learning objectives: Upon completion of this page, you should be able to
 • state the fields in which employment factor analysis is used, and the purpose of its use
 • explain the basic functions of employment factor analysis

Employment factor analysis is a quick approach to estimating the creation of direct jobs. It does not
consider indirect or induced effects. Two inputs are needed to calculate employment created by a
renewable energy project: the employment factor, which measures the labour used to install a certain
capacity (jobs/job-years per MW); and the installed capacity itself. The resulting equation is:
 [ − ]
 = [ ] ∗ [ − ]
Employment factors differ, depending on the work intensity and life cycle phase of a renewable energy
plant (see Figure 6, below). In general, work intensity is considerably lower for operation and
maintenance (O&M) than for manufacturing, construction and installation (MCI). However, O&M
generates employment over the lifetime of the respective technologies, while MCI may only require
several months to a few years of employment. Hence, O&M employment factors are applied to the
total installed capacity, whereas MCI employment factors only refer to newly added capacities [1].
Some sources thus recommend expressing MCI and O&M employment in job-years and jobs,
respectively [2].
The above equation may be used to estimate direct employment resulting from renewable energy
deployment. However, different RE technologies generate different amounts of electricity. To account
for changes in the energy mix, capacity should be substituted by generation (i.e. MWh per MWh,
instead of MW and job-years per MW) [3].

Figure 6: Median direct employment factors for the main phases of wind and PV deployment (author’s
 own depiction, adapted from Van der Zwaan, Cameron & Kober, 2013) [2]

References:
[1]: Meyer, I. and Sommer, M. W., 2014: Employment effects of renewable energy supply: A meta
 analysis, for Europe Policy Paper No. 12, pages 13–14.
[2]: Van der Zwaan, B.; Cameron, L. and Kober, T., 2013: Potential for Renewable Energy Jobs in the
 Middle East, (unpublished draft).
[3]: Jacob, K; Quitzow, R. and Bär, H., 2015: Green jobs: Impacts of a Green Economy on
 Employment, https://www.researchgate.net/publication/273767132_

 Page 14 of 50
 20/07/2021
Green_Jobs_Impacts_of_a_Green_Economy_on_Employment

Further reading:
The paper by Breitschopf, Nathani and Resch, “Review of approaches for employment impact
assessment of renewable energy deployment”, provides an overview of different impact assessment
studies analysing employment impacts or renewable energy, and clarifies which methodological
approach is best:
 • http://iea-retd.org/wp-content/uploads/2011/11/EMPLOY-task-1.pdf

The article “Renewable technologies in Karnataka, India: jobs potential and co-benefits” demonstrates
how to adapt general employment factors for different energy sectors to a national context. The study
also contains employment factors for the biofuel sector:
 • https://doi.org/10.1080/17565529.2017.1410085

The recent instructive study, “Greening India’s workforce”, by NRDC and CEEW, establishes the
employment factors and job impacts of solar and wind power in India:
 • https://www.nrdc.org/sites/default/files/greening-india-workforce.pdf

 Page 15 of 50
 20/07/2021
3.3 Employment Factor Analysis: Required Data and Calculation Steps
Learning objectives: Upon completion of this page, you should be able to
 • recognise what data is needed for employment factor analysis
 • identify data for employment factor analysis (e.g. country-specific employment factors)
 • explain the basic steps of the calculation process

Employment factor analysis relies on two main input factors: installed capacity/electricity generation
and the employment factor. Installed capacity/electricity is often readily available. Employment factor
data can be derived from actual data from RE facilities, the RE industry, surveys, feasibility studies, or
literature [1]. However, employment factor data should be viewed with caution.
Firstly, employment is expressed in different terms, which are sometimes used interchangeably. When
drawing from different sources, attention should thus be paid to different expressions, as follows:
 • ‘Jobs’ indicate an absolute number of jobs, ignoring the actual duration
 • ‘Job-years’ take duration into account: 1 job-year equals one job created for one year
 • ‘Job-year’, ‘person-year’ and ‘full-time equivalent’ (FTE) job can all be used interchangeably [2]

Secondly, data may be presented as temporary versus permanent jobs, as explained above. Although
employment factor analysis refers to direct employment only, indirect effects may be included in some
factors, such as those across the photovoltaic (PV) supply chain. The boundaries between direct and
indirect jobs vary, and must be indicated in the final calculation. Furthermore, productivity differs
between economies. Lastly, dynamic effects, such as changes in labour productivity, cost decreases in
technology learning rates [1]. As a result, employment found in the literature varies greatly.

 Figure 7: Direct job impacts by technology, in the USA (author’s own depiction, adapted from Wei,
 Patadia & Kammen, 2010) [2]

Figure 7 shows the averages and ranges of employment factors for different technologies in the USA. A
small wind farm with an annual generation of 60 GWh would lead to 10 job-years (60 GWh * 0.17 job-
years/GWh). The same stimulus would only translate into 7 jobs in the coal industry (60 GWh * 0.11
job-years/GWh).

 Page 16 of 50
 20/07/2021
References:
[1]: Breitschopf, B., Nathani, C., and Resch, G., 2011: Review of Approaches for Employment Impact
 Assessment of Renewable Energy Deployment (2011), pages 4–5, http://iea-retd.org/wp-
 content/uploads/2011/11/EMPLOY-task-1.pdf
[2]: Wei, M.; Patadia, S. and Kammen, D., 2010: Putting renewables and energy efficiency to work,
 How many jobs can the clean energy industry generate in the US?, Energy Policy, pages 919–
 931.

Further reading:
The authors Breitschopf, Nathani and Resch published a paper that provides a good overview of
different methods for estimating employment. It looks at the applied methodologies in greater depth.
The title of the paper is “Methodological guidelines for estimating the employment impacts of using
renewable energies for electricity generation”:
 • https://www.researchgate.net/publication/260434928_Methodological_guidelines_for_estim
 ating_the_employment_impacts_of_using_renewable_energies_for_electricity_generation

The report by IRENA, “The Socio-economic Benefits of Solar and Wind Energy”, from 2014, discusses
the domestic value creation resulting from investment in renewable energy technologies. Further, it
gives an overview of the required data and calculation steps for the employment factor approach:
 • https://www.irena.org/publications/2014/May/The-Socio-economic-Benefits-of-Solar-and-
 Wind-Energy

 Page 17 of 50
 20/07/2021
3.4 Employment Factor Analysis: Limitations and Advantages (Pros and Cons)
Learning objectives: Upon completion of this page, you should be able to
 • recognise the benefits of employment factor analysis
 • list the disadvantages of employment factor analysis

The main advantage of employment factor analysis lies in its simplicity: it is easy to carry out and
interpret, enabling quick estimates and updates. The model can easily be adjusted to include different
levels of productivity or technological change. Further, the model is very specific: it shows where jobs
are being created, for each technology and for each life cycle phase.

 Figure 8: Strengths and limitations of the employment factor analysis (author’s own depiction)

The main weakness of the model is that it produces significant variety in determined employment
factors, and hence in estimated job creation. This is especially true in emerging and developing
countries, which often draw on data from industrialised countries without adapting it to their local
context. Technological advances and rapidly evolving labour productivity make up-to-date technology-
specific and country-specific data necessary, which are hard to obtain.
Moreover, calculating the domestic share of MCI and O&M can be difficult. Official trade statistics
usually record the monetary value of products, not their energy capacity (in MW). Additionally, many
products are grouped with others that are not related to renewable energy: for example, when PV cells
and modules are grouped with other semiconductor devices [1].
Another key weakness is that the model only covers gross (positive) effects on jobs in the renewable
energy industry. It omits the indirect and induced effects on overall employment in the economy.
A summary of strengths and limitations is provided in Figure 8.

 Page 18 of 50
 20/07/2021
References:
[1]: Breitschopf, B., Nathani, C., and Resch, G., 2011: Review of Approaches for Employment Impact
Assessment of Renewable Energy Deployment, http://iea-retd.org/wp-
content/uploads/2011/11/EMPLOY-task-1.pdf

Further reading:
The report by IRENA, “Renewable Energy and Jobs”, from 2013, provides a good overview of the
employment factor methodology, as well as its strengths and weaknesses:
 • https://www.irena.org/-/media/Files/IRENA/Agency/Publication/2013/rejobs.pdf

IRENA also provides an annual update on global renewable energy employment, by country, region
and technology:
 • https://www.irena.org/publications/2020/Sep/Renewable-Energy-and-Jobs-Annual-Review-
 2020

The report by GIZ, “Green Jobs: Impacts of a Green Economy on Employment”, from 2015, showcases
how the employment factor approach has been used in empirical studies, as well as the strengths and
weaknesses encountered:
 • https://energypedia.info/images/f/fc/Green_Jobs_-_Impacts_of_a_Green_Economy_on_
 Employment.pdf

 Page 19 of 50
 20/07/2021
3.5 Employment Factor Analysis: South Africa Case Study
Learning objectives: Upon completion of this page, you should be able to
 • apply the theory of employment factor analysis to real examples
 • recognise the relevance of employment factor analysis in real cases

As a result of the local content requirements for RE projects in South Africa, facilities exist across the
solar PV industry value chain in South Africa [1]. For example, ARTSolar, the operator of a 100 MW solar
module assembly facility in Durban, relies on the aluminium provider Hulamin in Pietermaritzburg. By
2014, more than 20,000 jobs had been created in the South African solar industry [2].
According to the Internal Resource Plan (IRP), updated in 2018, the following PV capacities are planned
for South Africa [3]:
 • 1,474 MW already installed in 2018
 • 814 MW between 2019 and 2021 (already contracted)
 • 5,670 MW to be installed between 2022 and 2030 (additional capacity)

The following employment factors are used for the calculation of job creation potential [5]:
 • Manufacturing of solar modules: 16.8 job-years/MW
 • Installation and construction of solar PV plants: 7 job-years/MW
 • Operation and maintenance (O&M): 0.7 jobs/MW

The table shows a rough estimate of jobs resulting from existing and planned capacities, according to
the IRP. Manufacturing and construction jobs are calculated by multiplying existing and newly added
capacities for each stage of the IRP:
 • 1,474 MW * 16.8 job-years/MW = 24,763 job-years created by 2018
 • 814 MW * 16.8 job-years/MW = 13,675 job-years created between 2019 and 2021

O&M jobs, on the other hand, exist over the lifetime of a RE power plant (usually 25 years). Therefore,
the resulting permanent jobs result from adding capacities:
 • 1,474 MW * 0.7 jobs/MW = 1,032 jobs created by 2018
 • 1,032 jobs plus 814 MW * 16.8 jobs/MW = 570 jobs amounting to 1,602 jobs created by 2021

 Figure 9: Estimation of jobs created by solar PV in South Africa, if the IRP capacity goals are reached
 (author’s own depiction, based on DoE, 2018 and Maia & Giordano, 2011) [3, 4]

 Page 20 of 50
 20/07/2021
References:
[1]: Ettmayr, C. and Lloyd, H., 2017: Local content requirements and the impact on the South African
 renewable energy sector: A survey-based analysis, South African Journal of Economic and
 Management Sciences, 20(1), a1538, https://doi.org/10.4102/sajems.v20i1.1538
[2]: International Renewable Energy Agency (IRENA), 2016: Renewable Energy and Jobs. Annual
 Review 2016, https://irena.org/publications/2016/May/Renewable-Energy-and-Jobs--Annual-
 Review-2016
[3]: Department of Energy, Republic of South Africa, 2018: Integrated Resource Plan 2018,
 http://www.energy.gov.za/IRP/irp-update-draft-report-2018.html
[4]: Maia, J. and Giordano, T., 2011: Green Jobs. An Estimate of the Direct Employment Potential of
 a Greening South African Economy

Further reading:
For a more detailed evaluation of the employment creation potential of different renewable energy
sources in South Africa, have a look at:
 • Maia, J. and Giordano, T., 2011: Green Jobs. An Estimate of the Direct Employment Potential
 of a Greening South African Economy.

This study assesses the impacts of a coal phase-out plan, including impacts on jobs:
 • Burton, J.; Caetano, T. and McCall, B., 2018: Coal transitions in South Africa - Understanding
 the implications of a 2°C-compatible coal phase-out plan for South Africa, Energy Research
 Center, University of Cape Town, https://www.iddri.org/sites/default/
 files/PDF/Publications/Catalogue%20Iddri/Rapport/20180609_ReportCoal_SouthAfrica.pdf

 Page 21 of 50
 20/07/2021
4 Methodologies for Quantifying Employment Impacts: Gross Input-output Models
 4.1 Gross Input-output Models - General Functions
Learning objectives: Upon completion of this page, you should be able to
 • describe the purpose of input-output (I-O) models
 • explain the basic function of I-O models

Gross input-output (I-O) models are used to estimate the direct and indirect economic effects which
result from a change in demand within a sector. The model builds on I-O tables, which visualise supply
chains between economic sectors. I-O tables represent the flow of goods and services through an
economy in monetary units for a given time period, usually a year [1].
The columns of an I-O table display the required inputs a sector purchases in order to produce its
output (see Figure 10, below). In this way, it is possible to study the output produced by a given sector,
in terms of how many inputs there are from a number of sectors. The rows of an I-O table represent
where the output of a sector ends up, i.e. the number of sales to other sectors, as final domestic
demand or exports.

 Figure 10: Example of an I-O table (OECD, 2020) [2]

Gross I-O models can be used to study employment effects resulting from a change in demand. The
gross I-O model allows inputs to be disaggregated by sector and by life cycle. Employment effects can
be calculated by multiplying the inputs, using a labour requirement multiplier.
The labour requirement multiplier can be determined from the I-O table, as a sector-specific
employment factor. Alternatively, a technology-specific employment factor can be used. This second
approach increases the accuracy of the estimate, as sectors in I-O tables are usually defined very
broadly.

 Page 22 of 50
 20/07/2021
Indirect employment in upstream industries is determined by calculating total demand in intermediate
inputs, per technology, and multiplying it with a matrix of total labour requirement multipliers.

References:
[1]: Jarvis, A.; Varma, A. and Ram, J., 2011: Assessing green jobs potential in developing countries: A
 practitioner’s guide, International Labour Office, https://www.ilo.org/wc
 msp5/groups/public/---dgreports/---dcomm/---publ/documents/publication/wcms_153458.pdf
[2]: OECD, (n.a): Input-Output Tables (IOTs)), http://www.oecd.org/trade/input-outputtables.htm

Further reading:
The paper by Breitschopf, Nathani and Resch, “Review of approaches for employment impact
assessment of renewable energy deployment”, provides an overview of different impact assessment
studies that analyse the employment impacts of renewable energy, and clarifies which methodological
approach is best:
 • http://iea-retd.org/wp-content/uploads/2011/11/EMPLOY-task-1.pdf

The “Guidelines for employment impact assessment or renewable energy development” provide a
comprehensive step-by-step method for assessing indirect and induced employment impacts, using I-
O-tables and employment factors:
 • https://ecomod.net/system/files/Paper_Ecomod_2012_Nathani.pdf

EurObserv’ER: Renewable energy employment effects – methodology report for EU-28:
 • https://www.eurobserv-er.org/pdf/renewable-energy-employment-effects-methodology-
 report-2018/

 Page 23 of 50
 20/07/2021
4.2 Gross Input-output Models - Required Data and Calculation Steps
Learning objectives: Upon completion of this page, you should be able to
 • identify the necessary data for I-O models
 • order the basic steps of the calculation process

The gross input-output model follows five main steps [1], which are summarised in Figure 11, below.

 Figure 11: The main steps of an I-O model (author’s own depiction, based on Breitschopf, Nathani &
 Resch, 2011) [1]

The first step is to determine which technologies and life cycle phases need to be analysed. Secondly,
data need to be collected on newly added and total capacity, as well as cost per life cycle phase.
Multiplying capacity and cost data yields total expenditure. Thirdly, expenditure is assigned to specific
inputs (e.g. planning, wind turbine nacelle, turbine rotor blades, etc.) using I-O tables. Export and
import shares per input are then determined and imports are subtracted, in order to obtain domestic
output. These three steps yield complete I-O tables.
Fourthly, direct employment in operation and maintenance (O&M) is calculated as total O&M
expenditure divided by the average wage in the sector. Direct employment in manufacturing,
construction and installation (MCI) can be calculated by multiplying the output by a sector-specific
direct employment factor. The employment factor can be derived from the I-O table. However, the
result may be biased, as labour productivity within a sector in the I-O table might be heterogeneous.
Alternatively, direct employment in MCI can be calculated by multiplying domestic output by
technology-specific employment factors derived from industry surveys.
Fifthly, indirect employment is determined by calculating the total amount of intermediate inputs per
RE technology and sector. Multiplying all inputs by a labour coefficient vector determines the number
of indirect FTE jobs.

 Page 24 of 50
 20/07/2021
The necessary data includes I-O tables, the average salary per FTE job in O&M, technology-specific
employment factors for MCI, and labour coefficient vectors covering all inputs. The frequency and level
of detail of I-O tables varies by country, as the calculation of I-O tables requires large amounts of data
and labour. Many countries’ national statistics offices publish their I-O tables several years after they
have been produced.

References:
[1]: Breitschopf, B., Nathani, C., and Resch, G., 2011: Review of Approaches for Employment Impact
Assessment of Renewable Energy Deployment, http://iea-retd.org/wp-
content/uploads/2011/11/EMPLOY-task-1.pdf

Further reading:
I-O tables for Mexico:
 • OECD.Stat, Input Output tables, accessible at:
 https://stats.oecd.org/Index.aspx?DataSetCode=IOTS.

I-O tables for Kenya:
 • The Kenya Institute for Public Policy Research and Analysis, An Input-Output Table for Kenya
 and its Application to Development Planning, 2017, accessible at:
 https://kippra.or.ke/index.php/publications/summary/5-discussion-papers/28-an-input-
 output-table-for-kenya-and-its-application-to-development-planning-dp192.

I-O tables for South Africa:
 • Stats SA, Economic Analysis. Input-output tables for South Africa, 2013 and 2014, accessible
 at: http://www.statssa.gov.za/publications/Report-04-04-02/Report-04-04-022014.pdf.

I-O tables for Turkey:
 • Turkish Statistical Institute, Input-Output Tables, accessible at:
 http://www.turkstat.gov.tr/Start.do.
 • OECD.Stat, Input Output tables, accessible at:
 https://stats.oecd.org/Index.aspx?DataSetCode=IOTS.

I-O tables of OECD members in the OECD statistics database:
 • OECD.Stat, Input Output tables, accessible at:
 https://stats.oecd.org/Index.aspx?DataSetCode=IOTS.

EuroStat I-O tables for EU member states:
 • Eurostat, ESA Supply, use and Input-output tables, 2010, accessible at:
 https://ec.europa.eu/eurostat/web/esa-supply-use-input-tables/data/database.

EurObserv’ER: Renewable energy employment effects – methodology report for EU-28:

 Page 25 of 50
 20/07/2021
• https://www.eurobserv-er.org/pdf/renewable-energy-employment-effects-methodology-
 report-2018/

Physical I-O tables:
 • WIOD, Environmental Accounts (for India and Turkey; including energy use, CO2 emissions
 and air pollutants), 2013, accessible at: http://www.wiod.org/database/eas13.
 • Exiobase (including raw materials and types of water uses), accessible at:
 https://www.exiobase.eu/index.php/about-exiobase.

 Page 26 of 50
 20/07/2021
4.3 Gross Input-output Models: Limitations and Advantages (Pros and Cons)
Learning objectives: Upon completion of this page, you should be able to
 • recognise the benefits of I-O models
 • list the disadvantages of I-O models

The main advantage of the gross I-O model is its coverage of direct and indirect effects. In addition, it
allows for gross employment in the RE industry to be estimated within a comprehensive and consistent
framework. The same methodological approach can also be used to calculate other economic impacts
(e.g. gross value added, as a contribution to GDP). Further, the model allows technology-specific data
on capacities, costs, and cost structures to be combined with economic modelling [1].

 Figure 12: The strengths and limitations of I-O models (author’s own depiction)

In contrast, the analysis hinges on the availability of recent I-O tables. In developing countries
specifically, I-O tables are typically several years old and only partially include the informal sector [2,
3].
Another weakness is that RE technologies do not represent an individual sector in an I-O table. Instead,
they are grouped under other sectors which might not always be adequate proxies for RE industry
companies and their supply chains, with regard to cost structure, import relations, and employment
per unit of output. This aggregation bias can be reduced by including technology-specific information
in the estimation of direct employment [1].
Further, the model assumes linear input-output relationships, even though the transforming energy
sector is characterised by innovation and quickly evolving labour productivity [3]. Also, the model does
not take induced or net effects into account [2].
A summary of strengths and limitations is provided in Figure 12, above.
References:

 Page 27 of 50
 20/07/2021
[1]: Breitschopf, B., Nathani, C., and Resch, G., 2011: Review of Approaches for Employment Impact
Assessment of Renewable Energy Deployment, http://iea-retd.org/wp-
content/uploads/2011/11/EMPLOY-task-1.pdf
[2]: Jacob, K; Quitzow, R. and Bär, H., 2015: Green jobs: Impacts of a Green Economy on Employment,
https://www.researchgate.net/publication/273767132_
Green_Jobs_Impacts_of_a_Green_Economy_on_Employment
[3]: International Renewable Energy Agency (IRENA), 2013: Renewable Energy and Jobs,
https://www.irena.org/publications/2013/Dec/Renewable-Energy-and-Jobs-(2013)

Further reading:
The report by IRENA, “Renewable Energy and Jobs”, from 2013, provides a good overview of the
input-output model, as well as its strengths and weaknesses:
 • https://www.irena.org/-/media/Files/IRENA/Agency/Publication/2013/rejobs.pdf

The report by IRENA, “The Socio-economic Benefits of Solar and Wind Energy”, from 2014, discusses
domestic value creation resulting from investments in renewable energy technologies. Further, it
compares different methodologies and provides case studies on use of the I-O model:
 • https://www.irena.org/publications/2014/May/The-Socio-economic-Benefits-of-Solar-and-
 Wind-Energy

The report by GIZ, “Green Jobs: Impacts of a Green Economy on Employment”, from 2015, showcases
how the I-O model has been used in empirical studies. Further, it discusses how the I-O model can be
adapted to include green economic sectors:
 • https://energypedia.info/images/f/fc/Green_Jobs_-_Impacts_of_a_Green_Economy_on_
 Employment.pdf

 Page 28 of 50
 20/07/2021
4.4 Gross Input-output Models: Vietnam Case Study
Learning objectives: Upon completion of this page, you should be able to
 • apply the theory of IO models to real examples
 • recognise how IO models are relevant in the analysis of real cases

This case study [1] shows how I-O models are used in Vietnam, both to capture the renewable energy
value chain and to calculate changes in employment and skills requirements across competing power
sector planning scenarios. I-O models were used (as part of a larger approach) to derive employment
factors for a number of generation technologies, and the employment replacement factor for coal, thus
contributing to gross employment analyses.
Using the standard equations for I-O models (see [1], p. 10), specific factors such as equipment capital
cost, wages, and share of domestic production, were adapted for Vietnam. The model then estimated
the economic impacts related to the RE project lifetime. The resulting gross employment impacts -
direct, indirect and induced - were calculated within each scenario, for the period 2015-2030. Four
scenarios were used for the analysis, as follows:
 • Base Scenario/PDP 7 (rev): represents the planned official composition of Vietnam’s energy
 mix, as devised by the Power Development Plan VII (revised)
 • DEA Stated Policies: the stated policy scenario, as developed by the Danish Energy Agency
 • ADB Low-Carbon: a scenario developed by the Asian Development Bank, known as “Pathways
 to low-carbon development for Vietnam”
 • Base & Renew: the Base & Renewable Energy scenario, as developed by GreenID

As each scenario makes different assumptions, the I-O model only treated the RE production shares
and capacity additions as priorities.

 Page 29 of 50
 20/07/2021
Figure 13: Employment effects between 2015 and 2030, by scenario (author’s own depiction, based
 on Okunlola, et al. 2019, p. 13) [1]

The results are depicted in Figure 13 (above), which shows that the PDP 7 (rev) scenario would create
the highest number of jobs up to 2030 (assuming 1.93 million job-years). The figure also demonstrates
that generation capacity positively influences employment effects [1].

References:
[1]: Okunlola, A.; Nagel, L.; Helgenberger, S.; Thi Khanh, N.; May Dung, T. M. and Kovac, S., 2019:
 COBENEFITS Study - Future skills and job creation through renewable energy in Vietnam.

Further reading:
This recent paper uses an I-O modelling approach to measure RE industry gross employment in
Germany:
 • O’Sullivan, M. & Edler, D.: Gross Employment Effects in the Renewable Energy Industry in
 Germany—An Input–Output Analysis from 2000 to 2018, 2020,
 https://www.researchgate.net/publication/343349388_Gross_Employment_Effects_in_the_
 Renewable_Energy_Industry_in_Germany-An_Input-Output_Analysis_from_2000_to_2018

In this paper, I-O tables are adapted so that public and private spending in clean energy can be
compared to the effects of spending on fossil fuels, with a focus on employment impacts in the short-
to-medium term:

 Page 30 of 50
 20/07/2021
• Garrett-Peltier, H., 2017: Green versus brown: Comparing the employment impacts of energy
 efficiency, renewable energy, and fossil fuels using an input-output model, Economic
 Modelling, pages 439-447.

 Page 31 of 50
 20/07/2021
5 Methodologies for Quantifying Employment Impacts: Full Economic Modelling
 5.1 Full Economic Modelling: General Functions
Learning objectives: Upon completion of this page, you should be able to
 • summarise why full economic modelling is used
 • explain the basic function of full economic modelling
 • cite different kinds of full economic modelling

Full economic modelling looks at economy-wide effects, and its purpose is to illustrate change
processes within an economy. In the context of employment, full economic modelling aims to calculate
the net employment effects of a measure or scenario [1].
There are three different types of models:
 - Econometric models
 - Equilibrium models (Computable General Equilibrium)
 - System dynamics models
All three models build on a number of assumptions regarding impact mechanisms and interactions
within an economic system. Compared to employment factor analysis and I-O models, full economic
models are more complex and have greater use requirements. As a consequence, non-experts may find
that the resulting data are more difficult to interpret.
This course focuses on the Computable General Equilibrium (CGE) model. CGE stands for [2]:

 Figure 14: The main features of CGE models (author’s own depiction)

The CGE model aims to illustrate economic relationships and to simulate exogenous shocks (such as
policy changes) on the whole domestic economy. It considers job shifts and job increases (due to
increased output, export and import, etc). However, a CGE model does not take unemployment into
account, as it assumes that a flexible, market-clearing wage balances the supply and demand of labour
[3].
A CGE model takes into account different economic parameters, as illustrated in Figure 15, below.

 Page 32 of 50
 20/07/2021
Figure 15: The economic parameters used by a CGE model (author’s own depiction)

References:
[1]: Jacob, K; Quitzow, R. and Bär, H., 2015: Green jobs: Impacts of a Green Economy on Employment,
https://www.researchgate.net/publication/273767132_
Green_Jobs_Impacts_of_a_Green_Economy_on_Employment
[2]: Raihan, S., 2017: An Introduction to Computable General Equilibrium Modelling,
https://www.unescap.org/sites/default/files/9.Intro%20to%20CGE%20Model.pdf
[3]: Boeters, S. and Savard, L., 2011: The Labour Market in CGE Models, CPB Netherlands Bureau for
Economic Policy Analysis, CPB Discussion Paper 201,
https://www.cpb.nl/sites/default/files/publicaties/download/discussion-paper-201-labour-market-
cge-models.pdf

Further reading:
For an in-depth explanation of how CGE models work, Christoph Böhringer et al. give a detailed
overview of CGE models and show in which contexts they are useful, for non-technical readers:
 • Böhringer, C; Rutherford, T. F. and Wiegard, W., 2003: Computable General Equilibrium
 Analysis: Opening a Black Box, ZEW Discussion Paper No. 03-56 (2003),
 http://ftp.zew.de/pub/zew-docs/dp/dp0356.pdf

Sue Wing provides a detailed explanation of how CGE modelling works, by describing the approach for
decision makers and other non-experts in this particular field:
 • Wing, I. S., 2004: Computable General Equilibrium Models and Their Use in Economy-Wide
 Policy Analysis, http://web.mit.edu/globalchange/www/MITJPSPGC_TechNote6.pdf

For a more academic-oriented, technical overview on CGE modelling, Mary Burfisher’s book is helpful
in better understanding how CGE models work:
 • Burfisher, M., 2012: Introduction to Computable General Equilibrium Models, Cambridge
 University Press.

 Page 33 of 50
 20/07/2021
5.2 CGE Models: Required Data and Calculation Steps
Learning objectives: Upon completion of this page, you should be able to
 • identify the data required for CGE modelling
 • describe the basic steps of the calculation process

The CGE analysis consists of four steps, as illustrated in Figure 16.

 Figure 16: The steps of a CGE analysis (author’s own depiction, based on Böhringer et al., 2003) [1]

Step 1: First, we need to define the scenario we want to analyse. This can be an exogenous shock (e.g.
world prices, natural disasters), a structural change (e.g. productivity, resource endowment), or a policy
change (e.g. an increase in installed RE capacity) [2].
Step 2: The next step is to define the base year and collect the respective data. CGE models are usually
based on either a social accounting matrix (SAM) or I-O tables. Macroeconomic constraints (e.g. tax,
inflation, currency exchanges, interest) and exogenous elasticities can be obtained through literature
and database research.
The conceptual starting point of a CGE model is the circular flow of commodities between different
agents, which is illustrated in Figure 17, in a simplified way [3]. The main interaction takes place
between households, which own production factors and consume, and firms, who rent production

 Page 34 of 50
 20/07/2021
factors and produce. Further, CGE models include interactions with the government and the rest of the
world.

 Figure 17: Simple illustration of a circular flow of commodities (author’s own depiction, based on
 Wing, 2004) [3]

Step 3: The computer simulation consists of two sub-steps: calibration of the model (the ‘base year
snapshot’), and recalibration of the model by changing a single policy (the ‘counterfactual’).
Step 4: CGE models can analyse what the base year would look like if an exogenous shock hit the
economy [2]; it is therefore not a forecasting method. Results can be changes in:
 § commodity prices and quantities, or labour
 § incomes, expenditures, and savings for agents
 § macroeconomic indicators (e.g. GDP, current account balance, public deficit, investment)

References:
[1]: Böhringer, C; Rutherford, T. F. and Wiegard, W., 2003: Computable General Equilibrium Analysis:
 Opening a Black Box, ZEW Discussion Paper No. 03-56, http://ftp.zew.de/pub/zew-
 docs/dp/dp0356.pdf
[2]: Raihan, S., 2017: An Introduction to Computable General Equilibrium Modelling,
 https://www.unescap.org/sites/default/files/9.Intro%20to%20CGE%20Model.pdf

 Page 35 of 50
 20/07/2021
You can also read