OKLAHOMA Economic Indicators - January 2022
←
→
Page content transcription
If your browser does not render page correctly, please read the page content below

OKLAHOMA
Economic Indicators
     January 2022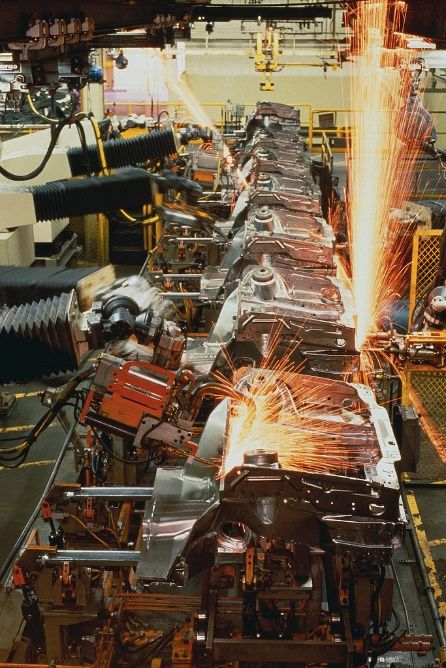
OKLAHOMA
                    ECONOMIC INDICATORS

                           Oklahoma Employment Security Commission
                               Shelley Zumwalt, Executive Director

                             Economic Research and Analysis Division
                              Lynn Gray, Director & Chief Economist

                                           Prepared by
                                   Monty Evans, Senior Economist

                                Will Rogers Memorial Office Building
                                  Labor Market Information Unit
                                           P.O. Box 52003
                                  Oklahoma City, OK 73152-2003
                                       Phone: (405) 557-5369
                                        Fax: (405) 525-0139
                                   E-mail: lmi1@oesc.state.ok.us

                                        January 2022

This publication is issued and is part of the activities of the Oklahoma Employment Security Commission
   as authorized by the Oklahoma Employment Security Act. An electronic copy has been deposited
              with the Publishing Clearinghouse of the Oklahoma Department of Libraries.

                                 Equal Opportunity Employer/Program
         Auxiliary aids and services are available upon request for individuals with disabilities
TABLE OF CONTENTS

SPECIAL REPORT: Trends in Oklahoma’s Unemployment Rate: 1976-2021....................... 2
U.S. Real Gross Domestic Product and Quarterly Change .................................................. 5
Oklahoma’s Real Gross Domestic Product and Quarterly Change ..................................... 7
Industry Share of Oklahoma’s Economy. ............................................................................ 8
Metropolitan Area Contribution to State Real GDP ........................................................... 9
Leading Index for Oklahoma ............................................................................................. 10
U.S. and Oklahoma Unemployment Rates ....................................................................... 11
U.S. and Oklahoma Nonfarm Payroll Employment .......................................................... 12
Oklahoma Employment Change by Industry (2019-2020) ............................................... 13
U.S. and Oklahoma Manufacturing Employment. ............................................................ 14
Purchasing Managers’ Index (Manufacturing) ................................................................. 15
Oklahoma Active Rotary Rigs and Cushing, OK WTI Spot Price ........................................ 17
Oklahoma Active Rotary Rigs and Henry Hub Natural Gas Spot Price. ............................ 19
U.S. Total Residential Building Permits. ............................................................................ 21
Oklahoma Total Residential Building Permits................................................................... 22
U.S. and Oklahoma Real Personal Income........................................................................ 23
Industry Contribution to Oklahoma Personal Income ...................................................... 24
U.S. Adjusted Retail Sales ................................................................................................. 25
Oklahoma Total Adjusted Retail Sales. ............................................................................. 26

January 2022                                                                                                        Page 1

SPECIAL REPORT:
Trends in Oklahoma’s Unemployment Rate: 1976-2021
Background
Each month, the Bureau of Labor Statistics (BLS) of the U.S. Department of Labor announces the
total number of employed and unemployed people in the United States for the previous month,
along with many characteristics about them. These figures, particularly the unemployment
rate—which tells you the percentage of the labor force that is unemployed—receive wide
coverage in the media. BLS also produces the Local Area Unemployment Statistics (LAUS)
program that reports monthly and annual employment, unemployment, and labor force data for
Census regions and divisions, States, counties, metropolitan areas, and many cities, by place of
residence. 1
Some people think that to get these figures on unemployment, the government uses the
number of people collecting unemployment insurance (UI) benefits under state or federal
government programs. But some people are still jobless when their benefits run out, and many
more are not eligible at all or delay or never apply for benefits. Others may think that the
government counts every unemployed person each month, which would cost way too much and
take far too long to produce the data.
Current Population Survey (CPS)
Because unemployment insurance records relate only to people who have applied for such
benefits, and it would be impractical to count every unemployed person each month, the
government conducts a monthly survey called the Current Population Survey (CPS) to measure
the extent of unemployment in the country. There are about 60,000 eligible households in the
sample for this survey. This translates into approximately 110,000 individuals each month, a
large sample compared to public opinion surveys, which usually cover fewer than 2,000 people.
In order to select the sample, all of the counties and independent cities in the country first are
grouped into approximately 2,000 geographic areas (sampling units). The Census Bureau then
designs and selects a sample of about 800 of these geographic areas to represent each state and
the District of Columbia. The sample is a state-based design and reflects urban and rural areas,
different types of industrial and farming areas, and the major geographic divisions of each state.
Each month, trained and experienced Census Bureau interviewers contact the 60,000 eligible
sample households and ask about the labor force activities (jobholding and job seeking) or non-
labor force status of the members of these households during the survey reference week
(usually the week that includes the 12th of the month). These are live interviews conducted
either in person or over the phone.
Basic Concepts of Employment and Unemployment
The basic concepts in identifying the employed and unemployed are quite simple:
  • People with jobs are employed.
  • People who are jobless, looking for a job, and available for work are unemployed.
  • The labor force is made up of the employed and the unemployed.
  • People who are neither employed nor unemployed are not in the labor force.

1 “How the Government Measures Unemployment”, June 2014, Technical Documentation, U.S. Bureau of Labor

Statistics, Current Population Survey (CPS).

January 2022                                                                                   Page 2
Local Area Unemployment Statistics (LAUS)
The Local Area Unemployment Statistics (LAUS) program is a federal-state cooperative effort
that produces monthly and annual employment, unemployment, and labor force data for
Census regions and divisions, States, counties, metropolitan areas, and many cities (of 25,000
population or more). The LAUS monthly series start in January 1976 for census regions and
divisions, all states, the District of Columbia, Puerto Rico, the Los Angeles-Long Beach-Glendale
Metropolitan Division, and New York city. Series for most substate areas begin in January 1990.
Labor force is the sum of the employed and the unemployed. In other words, the labor force
level is the number of people who are either working or actively seeking work. The
unemployment rate, perhaps the most widely known labor market indicator, reflects the
number of unemployed people as a percentage of the labor force.
Current Unemployment Rates for Oklahoma and Historical Highs/Lows
As of November 2021, Oklahoma reported the 3rd lowest unemployment rate among all other
states and the District of Columbia. This was the second month in a row that Oklahoma had that
rank and in terms of historical significance, this was the lowest unemployment rate for
Oklahoma in the time series going back to January 1976, (see Chart 1 below).

Previously, Oklahoma’s lowest reported unemployment rate was 2.9 percent, occurring in
August 1978 and again in October, November, and December 2000, just prior to the ‘Dot-Com’
recession (March 2001 to November 2001). 2

2The dot-com bubble burst in 2000, when an over-inflated Nasdaq lost more than 75 percent of its value and wiped
out a generation of tech investors.

January 2022                                                                                            Page 3
In terms of rankings, Oklahoma had the lowest unemployment rate among all other states and
the District of Columbia for eleven consecutive months from January through November of
1981.
Following the ‘Energy Crisis’ recession, 3 Oklahoma’s unemployment rate moved up to a then
high of 8.8 percent in March 1983. After the failure of Continental Illinois National Bank and
Trust Company in 1984, and the subsequent failure of Penn Square Bank, Oklahoma’s
unemployment rate peaked again at 8.8 percent in July and August 1986. 4 Following the ‘Great
Recession’, Oklahoma’s unemployment rate climbed to 7.0 percent in November and December
2009 and January 2010. 5
The largest monthly job loss on record in April 2020 pushed the U.S. unemployment rate to 14.7
percent, the highest rate since the Great Depression. Oklahoma also reached a historic high
unemployment rate of 13.0 percent in April 2020 as many businesses temporarily shuttered in
response to the coronavirus pandemic.
More Information
For more information about the Local Area Unemployment Statistics (LAUS) program, visit the
Bureau of Labor Statistics (BLS) website at: Local Area Unemployment Statistics Home Page
(bls.gov)
There are several ways to extract Local Area Unemployment Statistics (LAUS) data from the BLS
website. Instructions for extracting LAUS data can be found at: Instructions for Extracting LAUS
Data (bls.gov)
More detailed LAUS data for Oklahoma and counties, metropolitan areas, and many cities with
interactive charts and tables can be found at the Labor Market section of the OESC website:
Local Area Reports (oklahoma.gov)

3 Lasting from July 1981 to November 1982, this economic downturn was triggered by tight monetary policy in an

effort to fight mounting inflation.
4The failure of Continental Illinois National Bank and Trust Company in 1984, the largest in U.S. history at the time,
and its subsequent rescue gave rise to the term "too big to fail." Continental Illinois had purchased $1 billion in
speculative energy-related loans from Oklahoma-based Penn Square Bank, loans that originated from the 1970s oil
and gas exploration boom. Penn Square Bank failed in July 1982, highlighting Continental Illinois’s exposure to losses.
5   Lasting from December 2007 to June 2009, this economic downturn was the longest since World War II.

January 2022                                                                                                   Page 4
Definition & Importance
Gross Domestic Product (GDP)—the output of goods and services produced by labor and
property located in the United States—is the broadest measure of economic activity. It is also
the measure that is most indicative of whether the economy is in recession. In the post-World
War II period, there has been no recession in which GDP did not decrease in at least two
quarters, (the exceptions being during the recessions of 1960-61 and 2001).
The Bureau of Economic Analysis (BEA), U.S. Department of Commerce releases GDP data on a
quarterly basis, usually during the fourth week of the month. Data are for the prior quarter, so
data released in April are for the 1st quarter. Each quarter's data are revised in each of the
following two months after the initial release. Each revision is based on more complete
economic data.
Background
There are four major components to GDP:
1. Personal consumption expenditures: Individuals purchase durable goods (such as furniture
and cars), nondurable goods (such as clothing and food) and services (such as banking,
education, and transportation).
2. Investment: Private housing purchases are classified as residential investment. Businesses
invest in nonresidential structures, durable equipment, and computer software. Inventories at
all stages of production are counted as investment. Only inventory changes, not levels, are
added to GDP.
3. Net exports: Equal the sum of exports less imports. Exports are the purchases by foreigners of
goods and services produced in the United States. Imports represent domestic purchases of
foreign-produced goods and services and are deducted from the calculation of GDP.
4. Government: Government purchases of goods and services are the compensation of
government employees and purchases from businesses and abroad. Data show the portion

January 2022                                                                              Page 5
attributed to consumption and investment. Government outlays for transfer payments or
interest payments are not included in GDP.
The four major categories of GDP—personal consumption expenditures, investment, net exports
and government—all reveal important information about the economy and should be
monitored separately. This allows one to determine the strengths and weaknesses of the
economy.
Current Developments
The U.S. economy slowed to a modest pace in the 3rd quarter, as a resurgent covid variant kept
consumers away from shopping along with supply chain bottlenecks causing stores and factories
difficulty getting products and parts they need. Real gross domestic product (GDP) increased at
an annual rate of 2.3 percent in the 3rd quarter of 2021, according to the "third" estimate
released by the Bureau of Economic Analysis (BEA). In the 2nd quarter, real GDP increased 6.7
percent.
Consumer spending, which accounts for more than two-thirds of U.S. economic activity, grew a
1.7 percent rate in the 3rd quarter, slightly better than the 1.6 percent pace estimated
previously. Outlays on durable goods, such as automobiles, plunged 24.4 percent, rather than a
26.2 percent drop reported earlier. Spending on nondurable goods, such as clothing, increased
2.6 percent. Outlays on services, from health care to airline tickets, gained 7.6 percent. Personal
consumption expenditures (PCE) added 1.18 percentage points to 3rd quarter GDP growth, up
from 1.09 percentage points previously estimated.
Business investment grew at a slower 1.5 percent pace in the 3rd quarter, led by outlays on
intellectual property products. Spending on intellectual property products, such as computer
software, grew at a 9.3 percent rate, down from the 12.2 percent pace reported earlier.
Spending on structures, which are tied to the oil and gas sector and commercial real estate, sank
5.0 percent, while outlays on equipment fell 2.4 percent. Nonresidential fixed investment added
0.21 percentage point to 3rd quarter GDP, down from 0.24 percentage point previously thought.
Businesses stockpiled inventories at a 95.4 billion annual rate in the 3rd quarter, rather than the
90.8 billion rate previously reported. The increase in inventory rebuilding added 2.13 percentage
points from GDP growth in the July-September quarter, revised up from 2.07 percentage points
estimated earlier.
Housing construction slipped again in the 3rd quarter, as homebuilders have been faced with
shortages of construction materials. Residential fixed investment declined at a 8.3 percent rate
in the 3rd quarter, rather than the 7.7 percent drop reported earlier. Residential fixed
investment subtracted 0.41 percentage point from 3rd quarter GDP, revised down from 0.38
percentage point earlier reported.
Trade was a drag on GDP growth for the fifth consecutive quarter, reflecting a widening trade
gap. Imports increased 5.8 percent, while exports declined 3.0 percent. The widening trade
deficit subtracted 1.16 percentage point from 3rd quarter GDP.
Government spending declined again in the 3rd quarter, after the processing and administration
of Paycheck Protection Program loan applications by banks on behalf of the federal government
ended in the 2nd quarter. Federal government spending dipped 4.9 percent in the 3rd quarter,
as nondefense spending plunged 9.3 percent and national defense spending declined 1.6
percent. Consumption outlays by state and local governments rose 4.7 percent in the 3rd
quarter. Government consumption expenditures and investment added 0.16 percentage point
to 3rd quarter GDP, up from the earlier reported 0.14 percentage point.

January 2022                                                                                Page 6
Definition & Importance
The U.S. Bureau of Economic Analysis (BEA) recently began producing statistics of quarterly
gross domestic product (GDP) by state dating back to 2005. These new statistics provide a more
complete picture of economic growth across states that can be used with other regional data to
gain a better understanding of regional economies as they evolve from quarter to quarter. The
new data provide a fuller description of the accelerations, decelerations, and turning points in
economic growth at the state level, including key information about changes in the distribution
of industrial infrastructure across states.
Current Developments
Real gross domestic product (GDP) by state—a measure of nationwide growth calculated as the
sum of GDP of all states and the District of Columbia—increased in 37 states and the District of
Columbia in the 3rd quarter of 2021, as real GDP for the nation increased at an annual rate of
2.3 percent, according to the Bureau of Economic Analysis (BEA). The percent change in real
GDP in the 3rd quarter ranged from 6.0 percent in Hawaii to –3.3 percent in New Hampshire and
North Dakota.
Oklahoma’s real GDP decelerated to a 1.0 percent rate in the 3rd quarter of 2021, following a
3.5 percent pace in the 2nd quarter, ranking Oklahoma 30th among all other states and the
District of Columbia. Statewide GDP was at a level of $196.9 billion (in constant 2012 dollars) in
the 3rd quarter, up $0.5 billion from the 2nd quarter level of $196.4 billion.

January 2022                                                                               Page 7
Professional, scientific, and technical services increased 12.3 percent nationally and contributed
to the increases in 49 states and the District of Columbia in the 3rd quarter of 2021. This
industry was the leading contributor to the increase in 18 states. In Oklahoma, professional,
scientific, and technical services contributed 0.51 percentage point to 3rd quarter GDP.
Finance and insurance increased 7.8 percent nationally and contributed to the increases in all 50
states and the District of Columbia. This industry was the leading contributor to the increase in
13 states. Information added 0.30 percentage point to Oklahoma’s GDP in the 2nd quarter.
Professional, scientific, and technical services increased 15.3 percent nationally and contributed
to the increases in all 50 states and the District of Columbia. In Oklahoma, professional,
scientific, and technical services added 0.68 percentage point to the state’s GDP in 3rd quarter.
Government and government enterprises increased 5.1 percent nationally and contributed to
the increases in 47 states and the District of Columbia, primarily due to increases in state and
local government. In Oklahoma, government was the leading contributor to 3rd quarter GDP,
adding 0.77 percentage point.
Accommodation and food services was the leading contributor to the increase in Hawaii, the
state with the largest increase. In Oklahoma, this industry added 0.22 percentage point to GDP
in the 3rd quarter.
Agriculture, forestry, fishing and hunting was the leading contributor to the decrease in North
Dakota, while government and government enterprises, primarily military, was the leading
contributor to the decrease in New Hampshire. These were the two states with the largest
decreases. Wholesale trade was the leading detractor from 3rd quarter GDP growth in
Oklahoma, subtracting 0.89 percentage point.

January 2022                                                                               Page 8
Definition & Importance
Metropolitan Statistical Areas (MSA) are county-based definitions developed by the Office of
Management and Budget for federal statistical purposes. A metropolitan area is defined as a
geographic area consisting of a large population nucleus together with adjacent communities
having a high degree of economic and social integration with the nucleus.
GDP by metropolitan area is the sub-state counterpart of the Nation's gross domestic product
(GDP), the BEA's featured and most comprehensive measure of U.S. economic activity. GDP by
metropolitan area is derived as the sum of the GDP originating in all the industries in the
metropolitan area. Nationally, metropolitan statistical areas represent approximately 90 percent
of total GDP. In Oklahoma, the four MSAs of Oklahoma City, Tulsa, Lawton, and Enid accounted
for 71.8 percent of total state GDP in 2019.
Current Developments
Real gross domestic product (GDP) increased in 344 out of 385 metropolitan areas in 2019,
according to the U.S. Bureau of Economic Analysis (BEA). The percent change in real GDP by
metropolitan area ranged from 18.7 percent in Midland, TX to -18.9 percent in Rocky Mount,
NC. Real GDP for U.S. metropolitan areas increased 2.1 percent in 2019, led by growth in natural
resources and mining; information; professional and business services, educational services,
health care, and social assistance.
In 2019, all of Oklahoma’s four metropolitan areas experienced positive growth. Agriculture,
forestry, fishing, and hunting was the fastest growing industry in Enid MSA (245.2 percent),
ranking it 325th among 384 metro areas in 2019. Professional, scientific, and technical services
was the leading industry in Lawton MSA growing 5.3 percent in 2019, ranked 261st among U.S.
metro areas. Oklahoma City MSA grew 1.2 percent to $79.3 billion and ranked 263rd, lifted by
professional, scientific, and technical services. Tulsa MSA’s GDP grew 3.1 percent to a level of
$54.2 and ranked 95th in 2019, boosted by mining, quarrying, and oil and gas extraction.

January 2022                                                                             Page 9
Definition & Importance
The Federal Reserve Bank of Philadelphia produces leading indexes for each of the 50 states.
The indexes are calculated monthly and are usually released a week after the release of the
coincident indexes. The Bank issues a release each month describing the current and future
economic situation of the 50 states with special coverage of the Third District: Pennsylvania,
New Jersey, and Delaware.
The leading index for each state predicts the six-month growth rate of the state's coincident
index. In addition to the coincident index, the models include other variables that lead the
economy: state-level residential housing permits (1 to 4 units), state initial unemployment
insurance claims, delivery times from the Institute for Supply Management (ISM) manufacturing
survey, and the interest rate spread between the 10-year Treasury bond and the 3-month
Treasury bill.
Current Developments
The Federal Reserve Bank of Philadelphia has released the leading indexes for the 50 states for
February 2020. Forty-nine state coincident indexes, including Oklahoma’s, were projected to
grow over the next six months, while one was expected to decrease. For comparison purposes,
the Philadelphia Fed has also developed a similar leading index for its U.S. coincident index,
which is projected to grow 1.7 percent over the next six months.
Oklahoma’s leading index rose for a third straight month in February to a level of 1.79 percent.
The Philadelphia Fed noted that the February 2020 release of the state leading indexes was
based on data from the time period largely unaffected by the COVID-19 outbreak. Given the
extreme impact on initial unemployment claims in recent weeks, their standard approach for
estimating the six-month change in coincident indexes may not be reliable in coming months.
Therefore, they expect to suspend the release of upcoming state leading indexes until further
notice.

January 2022                                                                              Page 10
Definition & Importance
The Bureau of Labor Statistics Local Area Unemployment Statistics (LAUS) program produces
monthly estimates of total employment and unemployment from a national survey of 60,000
households. The unemployment rate measures the percentage of people who are without work
and is calculated by dividing the estimated number of unemployed people by the civilian labor
force. The result expresses unemployment as a percentage of the labor force.
The unemployment rate is a lagging indicator of economic activity. During a recession, many
people leave the labor force entirely. As a result, the jobless rate may not increase as much as
expected. This means that the jobless rate may continue to increase in the early stages of
recovery because more people are returning to the labor force as they believe they will be able
to find work. The civilian unemployment rate tends towards greater stability than payroll
employment on a monthly basis and reveals the degree to which labor resources are utilized in
the economy.
Current Developments
The U.S. unemployment rate fell sharply in December, a sign that more people are returning to
the labor force. The unemployment rate declined by 0.3 percentage point to 3.9 percent in
December, according to the Bureau of Labor Statistics (BLS). Over the year, the unemployment
rate was down by 2.8 percentage points but still above levels prior to the coronavirus pandemic
(3.5 percent in February 2020).
Oklahoma’s seasonally adjusted unemployment rate fell 0.2 percentage point to 2.5 percent in
November—the third lowest unemployment rate among all states and the District of Columbia
and the lowest monthly jobless rate in the series history (from January 1976 to present). Over
the year, Oklahoma’s seasonally adjusted unemployment rate was 2.3 percentage points lower
than November 2020.
In November, Latimer County posted Oklahoma's highest county unemployment rate of 3.9
percent, while Cimarron County had the lowest county unemployment rate of 0.8 percent.

January 2022                                                                            Page 11
Definition & Importance
Nonfarm payroll employment data is produced by the Current Employment Statistics (CES)
program of the Bureau of Labor Statistics (BLS). The CES Survey is a monthly survey of
approximately 145,000 businesses and government agencies representing approximately
697,000 worksites throughout the United States. The CES program has provided estimates of
employment, hours, and earnings data by industry for the nation as a whole, all States, and most
major metropolitan areas since 1939. In order to account for the size disparity between of U.S.
and Oklahoma employment levels, we have indexed the data with January 2001 as the start
value.
Payroll employment is one of the most current and reliable indicators of economic conditions
and recessionary trends. Increases in nonfarm payrolls translate into earnings that workers will
spend on goods and services in the economy. The greater the increases in employment, the
faster the total economic growth.
Current Developments
U.S. employers hired at a modest pace in December amid worker shortages as spiraling COVID-
19 infections disrupt economic activity. Total nonfarm payroll employment rose by 199,000 in
December, according to the Bureau of Labor Statistics (BLS). Employment continued to trend up
in leisure and hospitality (53,000 jobs), in professional and business services (43,300 jobs), in
manufacturing (26,000 jobs), in construction (22,000 jobs), and in transportation and
warehousing (19,000 jobs).
Oklahoma’s seasonally adjusted nonfarm employment declined by 1,700 jobs (-0.1 percent) in
November, to a level of 1,650,300 while October’s estimate was downwardly revised to
1,652,000.
In November, three of Oklahoma’s supersectors added jobs as leisure and hospitality (3,000
jobs) posted the largest monthly gain followed by financial activities (400 jobs). Professional and
business services (-1,700 jobs) followed by mining & logging and construction (-1,200 jobs each
) posted the largest over-the-month job losses in November.
January 2022                                                                               Page 12
Definition & Importance
Employment growth by industry identifies the types of jobs being created in the state.
Conversely, industries with a declining employment trend indicate those which are becoming
less important in the state’s economy. There may also be industries which behave more
cyclically, growing during expansion and decreasing in times of economic slowdown or
contraction. These changes are crucial in that they help to recognize the types of jobs being lost
by individuals. Anticipating what will happen in recovery helps identify whether those jobs will
return or what types of new jobs will be created. Consequently, key information for planning re-
employment, retraining, and other workforce and economic development programs is
contained within these data. For this analysis, we are using CES non-seasonally adjusted annual
averages to compare year-over-year employment changes.
Current Developments
Oklahoma’s annual average nonfarm employment plunged in 2020, as efforts to control the
spread of the coronavirus pandemic shuttered businesses. Total nonfarm employment shed a
non-seasonally adjusted 83,700 jobs (-4.9 percent) in 2020. For comparison, in 2019, 15,900 jobs
were gained for a 0.9 percent increase.
In 2020, all 11 of Oklahoma’s supersectors recorded job losses. Leisure and hospitality saw the
largest losses dropping 17,700 jobs (-10.2 percent) as accommodation and food services
accounted for the bulk of the job losses (-15,200 jobs). Mining and logging shed a non-seasonally
adjusted 17,200 jobs (-36.0 percent) as support activities for mining dropped 13,600 jobs over
the year. Professional and business services employment fell by 12,400 jobs (6.3 percent) as
administrative and support and waste management and remediation services lost 9,100 jobs.
Manufacturing shed 9,800 jobs (-6.9 percent) with durable goods manufacturing (-9,200 jobs)
accounting for almost all the job losses. Education and health services employment fell 4,900
jobs (-2.0 percent) with most of the losses in healthcare and social assistance (-4,100 jobs).
Other declining sectors were other services (-4,500 jobs); construction (-3,900 jobs); financial
activities (-2,700 jobs); trade, transportation, and utilities (-1,700 jobs): and information (-1,400
jobs). Government employment declined by 7,400 jobs (-2.1 percent).
January 2022                                                                                 Page 13
Definition & Importance
Manufacturing employment data is also produced by the Bureau of Labor Statistics’ Current
Employment Statistics (CES) program. Manufacturing and production are still important parts of
both the U.S. and Oklahoma economies. According to the 2019 County Business Patterns, the
manufacturing sector was the 5th-largest employer, employing 12.1 million workers in the
United States—and the top 10 average annual employee payroll at $61,127. In Oklahoma,
manufacturing accounts for one of the largest shares of private output and employment in the
state. In addition, many manufacturing jobs are among the highest paying jobs in the state. In
order to account for the size disparity between the U.S. and Oklahoma employment levels, we
have indexed the data with January 2001 as the starting value.
Current Developments
U.S. manufacturing employment added a solid number of jobs for the eightth month in a row in
December, boosted by job gains in durable goods industries. Manufacturing added 26,000 jobs
in December, according to the Bureau of Labor Statistics (BLS). Job gains in machinery (8,000)
reflected the return of workers from a strike. Manufacturing employment is down by 219,000
since February 2020.
Oklahoma manufacturing employment shed a seasonally adjusted 100 jobs over the month in
November to a level of 129,500. In November, job losses in durable goods manufacturing (-400
jobs) were partially offset by a 300 job gain in non-durable goods manufacturing.
Over the year, statewide manufacturing employment added a seasonally adjusted 1,700 jobs
(1.3 percent) from November 2020, as 1,900 jobs (-2.3 percent) lost in durable goods
manufacturing were more than offset by a gain of 3,600 jobs (8.3 percent) in non-durable goods
manufacturing.

January 2022                                                                          Page 14
Definition & Importance
Economists consider the Institute for Supply Management’s Purchasing Managers’ Index (PMI™)
a key economic indicator. The Institute for Supply Management (ISM®) surveys more than 300
manufacturing firms on employment, production, new orders, supplier deliveries, and
inventories. The ISM® manufacturing index is constructed so that any level at 50 or above
signifies growth in the manufacturing sector, which accounts for about 12 percent of the U.S.
economy. A level above 43 or so, but below 50, indicates that the U.S. economy is still growing
even though the manufacturing sector is contracting. Any level below 43 indicates that the
economy is in recession.
For the region, since 1994, the Creighton Economic Forecasting Group at Creighton University
has conducted a monthly survey of supply managers in nine states (including Arkansas, Iowa,
Kansas, Minnesota, Missouri, Nebraska, North Dakota, Oklahoma, and South Dakota), to
produce leading economic indicators for the Mid-America economy using the same
methodology as the national survey by the ISM®.
Current Developments
U.S. manufacturing activity slowed to an 11-month low in December as companies continued to
struggle with ongoing supply shortages and delays. The December Manufacturing PMI®
registered 58.7 percent, a decrease of 2.4 percentage points from the November reading of 61.1
percent, according to the latest ISM Manufacturing Report On Business®.
The slowdown in December reflected a decline in both new orders (-1.1 percentage point) and
in production (-2.3 percentage point). Factories continued to hire more workers in December,
with a measure of employment increasing to a reading of 54.2, up from 53.3 in November. The
survey's measure of prices paid by manufacturers dropped to 68.2 from a reading of 82.4 in
November. Supply-chain related problems continued to show improvement in December, as the
survey's measure of supplier deliveries decreased to a reading of 64.9, from 72.2 in November.
A reading above 50 indicates slower deliveries.

January 2022                                                                           Page 15
Since declining to a record low in April of last year, the Creighton University Mid-America
Business Conditions Index, a leading economic indicator for the nine-state region stretching
from Minnesota to Arkansas, moved above growth neutral for 19 of the last 20 months. The
December Business Conditions Index, which uses the identical methodology as the national ISM,
ranges between 0 and 100, expanded to a strong 64.6 from November’s healthy 60.2.
“Creighton’s monthly survey results indicate the region is adding manufacturing activity at a
positive pace, and that regional growth will remain solid. In terms of supply chain disruptions
and bottlenecks for the first half of 2022, approximately one-third of supply managers expect
delays to worsen with only one in six anticipating improvements,” said Ernie Goss, Ph.D.,
director of Creighton University’s Economic Forecasting Group and the Jack A. MacAllister Chair
in Regional Economics in the Heider College of Business.
Oklahoma’s Business Conditions Index expanded above growth neutral in December to a
regional high of 70.3 from 62.4 in November. Components of the overall December index were
new orders at 68.3, production or sales at 56.3, delivery lead time at 89.5, inventories at 70.4,
and employment at 66.3. Since the beginning of the pandemic, Oklahoma non-durable goods
manufacturing experienced much stronger growth than durable goods producers in the state.
Average hourly wages have advanced by 9.8 percent during this same period of time, all data
non-seasonally adjusted.

January 2022                                                                             Page 16
Definition & Importance
Crude oil is an important commodity in the global market. Prices fluctuate depending on supply
and demand conditions in the world. Since oil is such an important part of the economy, it can
also help determine the direction of inflation. In the U.S. consumer prices have moderated
whenever oil prices have fallen but have accelerated when oil prices have risen. The U.S. Energy
Information Administration (EIA) provides weekly information on petroleum inventories in the
U.S., whether produced here or abroad.
The Baker Hughes rig count is an important indicator for the energy industry and Oklahoma.
When drilling rigs are active, they consume products and services produced by the oil service
industry. The active rig count acts as a leading indicator of demand for products used in drilling,
completing, producing, and processing hydrocarbons.
West Texas Intermediate (WTI-Cushing) is a light crude oil produced in Texas and southern
Oklahoma which serves as a reference or "marker" for pricing a number of other crude streams
and which is traded in the domestic spot market at Cushing, Oklahoma.
Background
The discovery of oil transformed Oklahoma's economy. By the time Oklahoma became a state in
1907, it was the largest oil producer in the nation. Excluding federal offshore areas, Oklahoma
was the 4th-largest crude oil producer among the states in 2019, accounting for nearly 5 percent
of the nation's crude oil production (at 211,808,000 barrels). Crude oil wells and gathering
pipeline systems are concentrated in central Oklahoma. One of the 100 largest oil fields in the
United States, the Sho-Vel-Tum field, is in Oklahoma and has continuously produced crude oil
since its discovery in 1905.
The city of Cushing, in central Oklahoma, is a major crude oil trading hub connecting Gulf Coast
producers to Midwest refining markets. In addition to Oklahoma crude oil, the Cushing hub
receives supply from several major pipelines that originate in Texas. Traditionally, the Cushing
Hub has pushed Gulf Coast and Mid-Continent crude oil supply north to Midwest refining
markets. However, production from those regions is in decline, and an underused crude oil
January 2022                                                                               Page 17
pipeline system has been reversed to deliver rapidly expanding heavy crude oil supply produced
in Alberta, Canada to Cushing, where it can access Gulf Coast refining markets. For this reason,
Cushing is the designated delivery point for the New York Mercantile Exchange (NYMEX) crude
oil futures contracts. Crude oil supplies from Cushing that are not delivered to the Midwest are
fed to Oklahoma’s five refineries. As of January 2018, those refineries had a combined
distillation capacity of more than 522,000 barrels per day—roughly 3.0 percent of the total U.S.
refining capacity.
Current Developments
According to the U.S. Energy Information Administration’s (EIA) January Short-Term Energy
Outlook (STEO), EIA forecasts that, international benchmark Brent crude oil spot prices
averaged $71 per barrel (bbl) in 2021 and is forecast to average $75/bbl in 2022 and $68/bbl in
2023. Crude oil prices have risen over the past year as result of steady draws on global oil
inventories, which averaged 1.4 million barrels per day (bbl/d) during the first three quarters of
2021.
EIA also noted that U.S. crude oil production averaged 11.2 million bbl/d in 2021 and production
is expected to average 11.8 million bbl/d in 2022, rising to 12.4 million bbl/d in 2023, which
would be the highest annual average U.S. crude oil production on record. The current record is
12.3 million bbl/d, set in 2019.
Crude production in Oklahoma picked up over the month in October—the most recently
reported monthly data point. Statewide field production of crude oil was at a preliminary level
of 12,472,000 bbl in October, 572,000 bbl (4.8 percent) more than the upwardly revised
September level of 11,900,000 bbl, according to data reported by the EIA. Compared to a year
ago, Oklahoma crude production was down 546,000 bbl (-4.2 percent) from the October 2020
production level of 13,018,000 bbl.
West Texas Intermediate (WTI) crude oil for delivery at Cushing, Oklahoma, increased by
$10.55/bbl from the December 1, 2021 price of $65.44/bbl, settling at $75.99/bbl on January 3.
According to oil field services company Baker Hughes, oil-directed rig counts in the United
States, which reflect crude oil drilling activity, was flat at 480 for the week ending December 31,
while the nation’s total rig count was also flat at a level of 586. Compared to a year ago, the
nation’s total rig count was 235 more than 351 rigs reported on December 31, 2020.
For the week ending December 31, the state’s active rig count was up 1 over the week to a total
of 49, and up 5 from a month earlier, according to Baker Hughes. Oil-directed rigs accounted for
all of total rig activity in the month of December. Oklahoma’s active rig count was up 32 from 17
active rigs reported operating a year earlier.

January 2022                                                                               Page 18
Definition & Importance
The U.S. Energy Information Administration (EIA) provides weekly information on natural gas
stocks in underground storage for the U.S., and three regions of the country. The level of
inventories helps determine prices for natural gas products. Natural gas product prices are
determined by supply and demand—like any other good or service. During periods of strong
economic growth, one would expect demand to be robust. If inventories are low, this will lead
to increases in natural gas prices. If inventories are high and rising in a period of strong demand,
prices may not need to increase at all, or as much. However, during a period of sluggish
economic activity, demand for natural gas may not be as strong. If inventories are rising, this
may push down oil prices.
The Henry Hub in Erath, Louisiana is a key benchmark location for natural gas pricing throughout
the United States. The Henry Hub is the largest centralized point for natural gas spot and futures
trading in the United States. The New York Mercantile Exchange (NYMEX) uses the Henry Hub as
the point of delivery for its natural gas futures contract. Henry Hub “spot gas” represents
natural gas sales contracted for next day delivery and title transfer at the Henry Hub. The
settlement prices at the Henry Hub are used as benchmarks for the entire North American
natural gas market. Approximately 49 percent of U.S. wellhead production either occurs near
the Henry Hub or passes close to the Henry Hub as it moves to downstream consumption
markets.
Background
Oklahoma's proved natural gas reserves are the 3rd-largest in the nation, after Texas and
Pennsylvania. The state has 8 percent of the nation's total proved reserves and contains all or
part of 14 of the 100 largest U.S. natural gas fields, as measured by proved reserves. Annual
natural gas production was at an all-time high of almost 3.2 trillion cubic feet in 2019.
Most natural gas in Oklahoma is consumed by the electricity generation and industrial sectors.
About half of Oklahoma households use natural gas as their primary energy source for home
heating. Nevertheless, only about one-seventh of Oklahoma’s natural gas output is consumed

January 2022                                                                                Page 19
within the state. The remaining supply is sent via pipeline to northern and eastern markets
through Kansas, Texas, and Arkansas.
Current Developments
According to the U.S. Energy Information Administration’s (EIA), December Short-Term Energy
Outlook (STEO), the EIA forecasts that U.S. dry natural gas production will increase from 95.1
billion cubic feet per day (Bcf/d) in October 2021 to 97.5 Bcf/d by December 2022, a new record
high. The previous monthly record of 97.2 Bcf/d was set in November 2019.
The EIA also noted that the number of natural gas-directed rigs—rigs drilled primarily in natural
gas-bearing formations—decreased throughout 2019 and the first half of 2020, based on data
from the Baker Hughes Company. By late August 2020, the natural gas-directed rig count had
fallen to 68 rigs, the fewest in Baker Hughes’s data series, dating back to 1987. The number of
natural gas-directed rigs has since increased to 102 in mid-November 2021. Rig counts are
considered a leading indicator of newly drilled wells but increases in drilling efficiency (the
number of new wells each rig can drill) and new-well production have complicated the
relationship between rig counts and eventual production.
Oklahoma natural gas production climbed over the month in October. Statewide natural gas
gross withdrawals were at a preliminary level of 224,279 million cubic feet (MMcf) in October,
up 7,827 MMcf (3.6 percent) from the downwardly revised August level of 216,452 MMcf. Over
the year, statewide natural gas production was up 4,876 MMcf (2.2 percent) from the October
2020 level of 219,403 MMcf.
The natural gas spot price at Henry Hub averaged $3.91 per million British thermal units
(MMBtu) in 2021. Monthly average prices reached $5.51/MMBtu in October, but they declined
in November and December as mild weather prevailed across much of the country, resulting in
less natural gas used for space heating.
According to Baker Hughes, for the week ending December 31, the national natural gas rig count
held steady at 106 over the week and was up 23 rigs over the year.
Oklahoma drillers reported no natural gas-directed rig activity for the week ending December
31, according to Baker Hughes.

January 2022                                                                             Page 20
Definition & Importance
The U.S. Census Bureau and the Department of Housing and Urban Development jointly provide
monthly national and regional data on the number of new housing units authorized by building
permits; authorized, but not started; started; under construction; and completed. The data are
for new, privately-owned housing units (single and multifamily), excluding "HUD-code"
manufactured homes. Because permits precede construction, they are considered a leading
indicator for the residential construction industry and the overall economy. Most of the
construction begins the same month the permit is issued. The remainder usually begins
construction during the following three months; therefore, we also use a three-month moving
average.
While home construction represents a small portion of the housing market, it has an outsize
impact on the economy. Each home built creates an average of three jobs for a year and about
$90,000 in taxes, according to the National Association of Home Builders. Overall, homebuilding
fell to its lowest levels in 50 years in 2009, when builders began work on just 554,000 homes.
Current Developments
U.S. applications to build, a sign of future residential construction activity, rose again in
November, as demand for new houses remained strong. Privately-owned housing units
authorized by building permits in November were at a seasonally adjusted annual rate of
1,712,000, 3.6 percent above the revised October rate of 1,653,000, and 0.9 percent above the
November 2020 rate of 1,696,000, according to the U.S. Census Bureau and the U.S.
Department of Housing and Urban Development.
Permits for single-family homes increased 2.7 percent to a rate of 1.103 million units in
November. Building permits for multi-family housing projects rose 6.1 percent to a rate of
560,000 units.
The National Association of Home Builders/Wells Fargo Housing Market Index (HMI) showed
sentiment improved for the fourth straight month in December, up to 84 from 83 last month.
January 2022                                                                           Page 21
Definition & Importance
The data services of the Federal Reserve Bank of St. Louis produce a seasonally adjusted series
including monthly state level data on the number of new housing units authorized by building
permits. These adjustments are made using the X-12 Procedure of SAS to remove the seasonal
component of the series so that non-seasonal trends can be analyzed. This procedure is based
on the U.S. Bureau of the Census X-12-ARIMA Seasonal Adjustment Program.
Current Developments
Oklahoma homebuilders requested more applications for new residential construction in
November. Total residential permitting for November was at a seasonally adjusted level of
1,224, up 14 (9.3 percent) from the October level of 1,120, but down 57 (-4.5 percent) from the
November 2020 level of 1,282 permits, according to figures from the U.S. Census Bureau and
the Federal Reserve Bank of St. Louis.
In November, permits for single-family homes accounted for almost all residential permitting at
a seasonally adjusted level of 1,209, up 127 permits (11.7 percent) from an upwardly revised
level of 1,082 in October. Multi-family permitting was at a seasonally adjusted level of only 15 in
November, down 23 (-60.6 percent) from the previous month’s level of 38 permits. Single-family
permitting accounted for 98.8 percent of total residential permitting activity in November while
the more volatile multi-family permitting accounted for 1.2 percent.
Statewide residential construction in 2020 rose to the highest level since 2014. Oklahoma total
residential permitting for 2020 was at a revised seasonally adjusted level of 13,681 permits. This
is 1,736 permits (14.5 percent) more than the 11,945 total permits issued during 2019.

January 2022                                                                               Page 22
Definition & Importance
Personal income is a broad measure of economic activity and one for which relatively current
data are available. Personal income includes earnings, property income such as dividends,
interest, and rent and transfer payments, such as retirement, unemployment insurance, and
various other benefit payments. It is a measure of income that is available for spending and is
seen as an indicator of the economic well-being of the residents of a state. Earnings and wages
make up the largest portion of personal income.
To show the vastly different levels of total personal income for the U.S. and Oklahoma on the
same chart, these data have been converted to index numbers. This chart shows a comparison
of Oklahoma and U.S. growth in real personal income with 1st quarter 2000 as the base year.
Current Developments
U.S. personal income grew again in November and consumer spending rose again despite the
fastest inflation in nearly four decades. Personal income increased $90.4 billion, or 0.4 percent
at a monthly rate, while consumer spending increased$104.7 billion, or 0.6 percent, in
November, according to estimates released the Bureau of Economic Analysis (BEA). The increase
in personal income primarily reflected increases in compensation of employees and government
social benefits. Consumer prices over the past 12 months have risen 5.7 percent, the biggest 12-
month gain since March 1982.
In November, purchases of goods declined 0.8 percent, as spending on durable goods such as
motor vehicles, slumped 1.0 percent. Spending on services was up 0.5 percent in November.
The personal savings rate—personal saving as a percentage of disposable personal income—was
6.9 percent in November, compared with 7.1 percent in October.

January 2022                                                                             Page 23
Definition & Importance
Quarterly estimates of state personal income are seasonally adjusted at annual rates by the
Bureau of Economic Analysis (BEA). Quarterly personal income estimates are revised on a
regular schedule to reflect more complete information than the data that were available when
the estimates were initially prepared and to incorporate updated seasonal factors.
Current Developments
State personal income—a measure of nationwide income calculated as the sum of personal
income of all states and the District of Columbia—decreased 21.8 percent at an annual rate in
the 2nd quarter of 2021 after increasing 56.9 percent in the 1st quarter, according to estimates
by the Bureau of Economic Analysis (BEA). In the 2nd quarter of 2021, the decrease in transfer
receipts was the leading contributor to personal income declines in all 50 states and the District
of Columbia. The percent change in personal income across all states ranged from –10.1 percent
in the District of Columbia to –34.0 percent in West Virginia.
Oklahoma’s personal income declined at a 27.8 percent rate in the 2nd quarter of 2021, to a
level of $206.1 billion, ranking the state 43rd among all states. For the 1st quarter of 2021,
Oklahoma’s personal income was revised upward to $223.5 billion (63.8 percent) from the
previous estimate of $221.6 billion (75.1 percent).
Transfer receipts decreased $1.7 trillion for the nation in the second quarter of 2021, accounting
for more than the entire $1.3 trillion decrease in personal income. The decrease in transfer
receipts primarily reflected a reduction in direct economic impact payments provided by the
Coronavirus Response and Relief Supplemental Appropriations Act and the American Rescue
Plan Act and a decrease in state unemployment insurance compensation.
In Oklahoma, the decrease in transfer receipts was the major contributor to the drop in personal
income in the 2nd quarter, subtracting $20.5 billion and accounting for 32.6 percent of the
decline in the state’s personal income.

January 2022                                                                              Page 24
Definition & Importance
Retail sales measure the total receipts at stores that sell merchandise and related services to
final consumers. Sales are by retail and food services stores. Data are collected from the
Monthly Retail Trade Survey conducted by the U.S. Bureau of the Census. Essentially, retail sales
cover the durables and nondurables portions of consumer spending. Consumer spending
accounts for roughly two-thirds of the U.S. GDP and is therefore essential to Oklahoma’s
economy. Retail sales account for around one-half of consumer spending and economic
recovery calls for consumption growth.
Current Developments
U.S. retail spending rose modestly in November after surging in October, as shoppers faced
rising inflation and supply shortages. Advance estimates of U.S. retail and food services sales for
November 2021, adjusted for seasonal variation and holiday and trading-day differences, but
not for price changes, were $639.8 billion, an increase of 0.3 percent from the previous month,
and 18.2 percent above November 2020, according to the U.S. Census Bureau. Total sales for
the September 2021 through November 2021 period were up 16.2 percent from the same
period a year ago. The September 2021 to October 2021 percent change was revised up from
1.7 percent to 1.8 percent.
Sales at auto dealerships dipped 0.1 percent in November, after rising 1.7 percent in October.
Sales at service stations increased 1.7 percent, lifted by higher pump prices. Excluding the
volatile automobile and gasoline categories, retail sales increased 0.2 percent in November.
Food and beverage store sales rose 1.3 percent in November, reflecting rising inflation. Receipts
at restaurants and bars increased 1.0 percent. Sales at sporting goods, hobby, musical
instrument and book stores rose 1.3 percent. Online sales was flat in November.
The less volatile “core” or retail-control group sales which are used to calculate gross domestic
product, and strips out automobiles, gasoline, building materials, and food services sales dipped
0.1 percent in November following an upwardly revised 1.8 percent rise in October.

January 2022                                                                               Page 25
Definition & Importance
The Center for Economic and Management Research (CEMR) Price College of Business, at the
University of Oklahoma produces the Oklahoma Monthly Retail Sales Series containing monthly
estimates of retail sales for Oklahoma, the Oklahoma City, Tulsa, and Lawton Metropolitan
Statistical Areas and 48 selected cities in Oklahoma. The series is based on sales tax collection
data provided by the Business Tax Division, Oklahoma Tax Commission (OTC). In order to take
out monthly volatility, we have used a six-month moving average.
Current Developments
Statewide retail spending rebounded in November, largely due to a jump in receipts at gas
stations. Total adjusted retail trade in November was at a level of $3.49 billion, up 2.7 percent
from the October level of $3.40 billion. Over the year, total adjusted retail trade was up 0.5
percent from the November 2020 level of $3.47 billion. Excluding estimated gasoline sales, total
retail sales for November declined 0.3 percent over the month.
In November, total durable goods sales declined 0.4 percent, all but two durable goods
categories reported losses over the month. Declining durable goods categories in November
included auto accessories & repair (-3.8 percent); miscellaneous durable goods (-1.4 percent);
used merchandise (-1.4 percent); and furniture (-0.1 percent). Lumber & hardware (0.9 percent)
and computer, electronics & music stores (1.5 percent) were the only categories reporting gains
over the month.
Non-durable goods expenditures climbed 3.8 percent in November, as the volatile estimated
gasoline sales category jumped 56.3 percent over the month. Other declining non-durable goods
categories were sales at apparel stores (-2.4 percent); drug stores (-1.2 percent); miscellaneous
non-durables (-0.7 percent); general merchandise stores (-0.5 percent); food stores (-0.4
percent) and liquor stores (-0.2 percent). Sales at eating & drinking places (0.7 percent) was the
only advancing non-durable goods category in November.

January 2022                                                                              Page 26
This workforce product was funded by a grant awarded by the U.S. Department of Labor’s Employment
and Training Administration. This product was created by the recipient and does not necessarily reflect
the official position of the U.S. Department of Labor. The U.S. Department of Labor makes no
guarantees, warranties, or assurances of any kind, express or implied, with respect to such information,
including any information on linked sites and including, but not limited to, accuracy of the information or
its completeness, timeliness, usefulness, adequacy, continued availability, or ownership. This product is
copyrighted by the institution that created it. Internal use by an organization and/or personal use by an
individual for non-commercial purposes is permissible. All other uses require the prior authorization of
the copyright owner.
You can also read