NTG Morning Comments www.nesvick.com - Thursday, July 7, 2022 - Nesvick Trading Group
←
→
Page content transcription
If your browser does not render page correctly, please read the page content below
Thursday, July 7, 2022
NTG Morning Comments
www.nesvick.com
Weather
No big changes to the forecast this morning. The first
map at the right shows Days 1-3 and the bulk of the
rains in this map will fall during the next 48 hours.
This will be the best shot of rainfall for the Corn Belt
for the duration of the two week timeframe. The
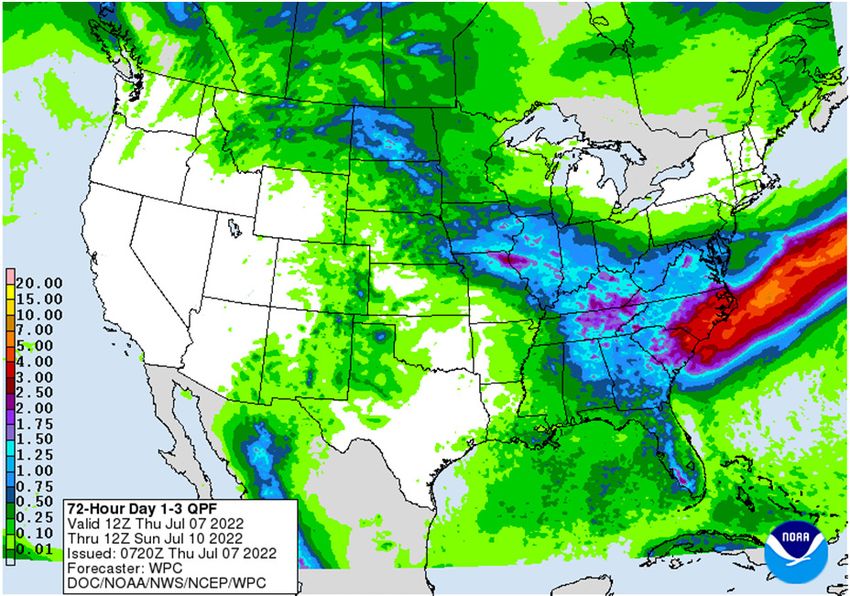
second map shows the Day 4-5 period. Some light
rains will be possible here as a cold front moves
through but probably not going to be a big rain-
maker. Beyond that, there isn’t anything in the
forecast models this morning showing another really
good shot of moisture for the 15-day period. We
should see mostly below normal precipitation for the
Corn Belt during both the 6-10 and 11-15 day periods.
Forecast models are still showing a shift where rainfall
chances favor more southern portions of the country
than the Corn Belt. That said, overnight models have
turned a little drier in even the southern portions of
the country.
Temps will continue to be hot in the next few days.
The majority of the Corn Belt could see temps return
to near-normal levels by early next week. The Plains,
however, could continue to see above normal temps,
as shown in the map at the bottom right. Some
models are hinting at a possible return of above
normal temps in the Corn Belt by the 11-15 day
period.
Crops
Today we’ll look at wheat production guesstimates.
Let’s start by looking at winter wheat objective yield
data. The two charts below are fairly similar. These
look at July NASS reported heads/sf and the implied
head weights vs. the condition index. The highlighted
2022 figures are using numbers from the June Crop
Production report with current condition ratings. I
find it interesting that the estimate on heads/sf would seem relatively inline with what you’d expect given the
condition index. However, the implied head weight from June seems a bit optimistic relative to conditions.
Obviously smaller head counts should lead to higher average weights, but the difference this year might be a bit
stretched, no? All else equal, this would imply some potential downside to winter wheat production next week.
Admittedly, I’m not sure how much faith to put into these scatters…they’re hardly slam dunks. Informa/IHS is
actually calling for slightly higher winter wheat production.
1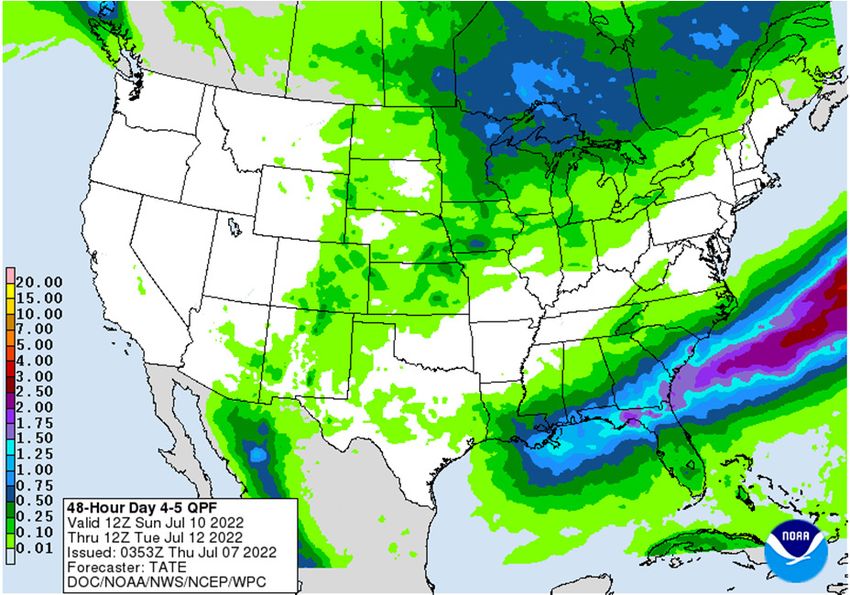
Thursday, July 7, 2022
                                                                                                                                      NTG Morning Comments
                                                                                                                                           www.nesvick.com

                                                                            July NASS Winter Wheat Objective Yield Data
                                                                                   Heads/SF vs. Conditions Index
                                                               75                                      2010            2019                                  2016

                                                                                                                              2012
                                                               70                                    2020
                                                                                         2017
                                  Early July Condition Index

                                                                                                             2008                    2021
                                                               65                                           2015

                                                                                  2018
                                                               60
                                                                                                                2011
                                                                                                                                            2013
                                                                               2014
                                                                                 2022
                                                               55

                                                               50
                                                                                                                                                        R² = 0.1974
                                                               45
                                                                    37    39             41                     43              45                 47                 49
                                                                                                Heads per Square Foot

                                                                            July NASS Winter Wheat Objective Yield Data
                           80                                                 Implied Head Weight vs. Condition Index

                           75                                                                                           2016
                                                                                                                         2010          2019
                                                                                          2012                                                       2020
                           70                                                                                                          2017
     Early July Condition Index

                                                                                                                                       2021
                           65                                                    2015
                                                                                                                                2018
                           60
                                                                                 2011
                                                                                  2013
                                                                         2014                                             2022
                           55

                           50

                           45
                                                                                                                               y = 72.876x + 17.391
                                                                                                                                    R² = 0.3046
                           40
                                     0.50                                0.55                 0.60                     0.65                   0.70                    0.75
                                                                                               Implied Head Weight

What to expect for spring wheat? We don’t have much to work with at this point in time…other than condition
ratings. The chart below plots the July NASS spring wheat yield vs. the current condition index. This year’s
condition index is represented by the red line. You can see that in the past few years (last year excluded) we’ve

                                                                                                            2
Thursday, July 7, 2022
                                                                                NTG Morning Comments
                                                                                     www.nesvick.com

seen the July yield come in higher than the trendline on the chart would imply. I would expect something similar
to be seen this year. If we assume something around a 43.5 bpa yield on spring wheat, the June NASS harvested
area estimate would imply something around a 465-470 mil bu spring wheat crop. This is a bit smaller than
what Informa/IHS gave us yesterday.

                                          Other Spring Wheat July Yield Forecast
                                                   vs. Condition Index
                         50
                                                                                        2018
                                                                                      2019
                                                                                      2015
                                                                                   2020
                                                                                    2016
                                                                                    2014
                                                                                            2010
                         45                                                       2013     2005
                                                                                    2011
                                                  2017                              2012
       July NASS Yield

                                                                                         2007
                         40                                                           2009
                                                                                   2004
                                                                                      2008 2003
                                                                           2000 2001
                         35                                         2006
                                                                 2002
                                   2021
                         30

                                                                                                R² = 0.3249
                         25
                              45    50     55        60           65       70        75        80             85
                                                     Week #26 Condition Index

Livestock
Late yesterday afternoon I heard some talk that 151 was traded in IA to a major. Not sure of what sort of
volume we’re talking about. Would expect that NE would be somewhere close to that whenever they get
around to trading. Obviously the south is still going to be a big discount.

The weekly broiler hatchery update isn’t something I normally spend much time on, but with retail chicken
prices still very high it is something we should casually monitor in the weeks and months ahead. Charts on eggs
set and chick placements follow on the next page. We’ve seen eggs set totals score lots of new record highs this
year, but chick placements have not been able to reach record levels until just recently. This continues to speak
to the poor hatchability that seems to be a never-ending problem for the industry. You can also see we’re
nearing our seasonal downturn in both categories.

                                                             3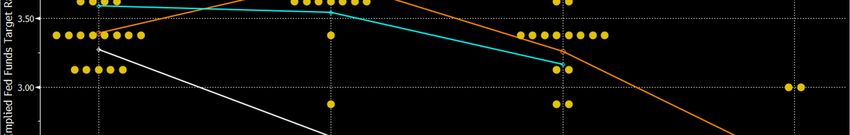
Thursday, July 7, 2022
                                                                                            NTG Morning Comments
                                                                                                 www.nesvick.com

                                          Broiler Eggs Set in Incubators
         245,000

         240,000

         235,000

         230,000

         225,000

         220,000

         215,000

         210,000
                1-Jan   1-Feb 1-Mar   1-Apr   1-May   1-Jun       1-Jul     1-Aug   1-Sep    1-Oct    1-Nov     1-Dec

                               2017       2018         2019               2020       2021            2022

                                       Chicks Placed for Meat Production
        195,000

        190,000

        185,000

        180,000

        175,000

        170,000

        165,000

        160,000
               1-Jan    1-Feb 1-Mar   1-Apr   1-May   1-Jun       1-Jul     1-Aug   1-Sep    1-Oct    1-Nov     1-Dec

                               2017       2018         2019               2020       2021            2022

Financials
Looking at the last Dot Plot projection from the Fed is a good way of seeing how the market’s expectations have
shifted in the past few weeks. The Dot Plot isn’t even a month old, but the market’s implied rate projections

                                                              4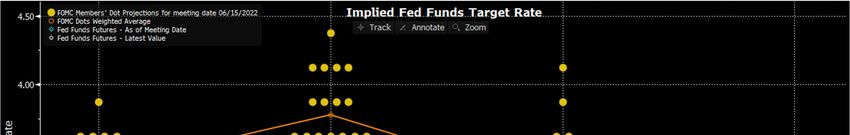
Thursday, July 7, 2022
                                                                             NTG Morning Comments
                                                                                  www.nesvick.com

have posted huge shifts. The Bloomberg version of the Dot Plot is below. The yellow dots are the various FOMC
member projections and the orange line is the weighted average for each projection. The blue line shows what
the Fed Funds futures were implying as of the release of these dots (6/15). For this year, Fed Funds were
actually stronger than the average FOMC guesstimate. For 2023 and beyond, Fed Funds were not quite as
aggressive as the FOMC, but they were still close. Fast forward to yesterday (when I pulled this chart) and the
white line shows what Fed Funds are implying right now. Fed Funds are implying less hiking than the June FOMC
for this year and is now pricing in rate cuts for 2023 and beyond. What a difference just a few weeks makes.

We’ve gone from needing the Fed to hike aggressively to counter inflation to “OMG the economy is in
shambles” in record speed. I’m of the opinion we’re overshooting the slowdown (for now). Thoughts
appreciated.

The big news overnight is that China’s Ministry of Finance is apparently considering a major stimulus package.
As usual for China, the package would be aimed at infrastructure funding. It sounds like what the Chinese are
doing are pulling forward regularly-scheduled debt sales for 2023 and allowing them to take place this year. The
focus on infrastructure spending is of course mainly geared towards hitting the government’s GDP targets.
Whether or not that is truly helpful for the Chinese economy is certainly open for debate. You can see this is
having a big impact on certain commodities, such as copper and soybeans. Oil is higher, but honestly not as
much as I might have expected.

The other interesting news of the evening is that UK PM Boris Johnson has finally succumbed to pressure to
resign. The BP is trading modestly higher at the time of writing this morning, though I’m not sure the PM’s
resignation is the primary cause. Johnson apparently is hoping to remain in the spot until October while the
party elects a new leader, but it seems unlikely that is going to happen.

                                                       5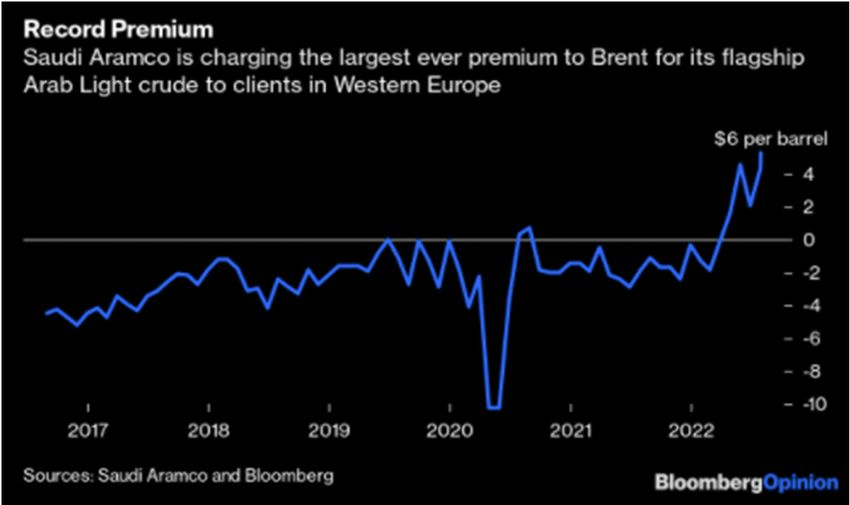
Thursday, July 7, 2022
                                                                               NTG Morning Comments
                                                                                    www.nesvick.com

Energy
Not much new information to pass along this morning. As mentioned above, oil futures are bouncing a bit this
morning – perhaps in response to the news on Chinese stimulus. I noted yesterday that calendar spreads were
not confirming the move lower in oil, and in
yesterday’s flat price weakness we continued to
see calendar spreads trade firm. Additionally,
as the chart to the right shows, the Saudis are
charging a record large premium to their
benchmark to customers…which hardly seems
indicative of slowing demand due to poor
economic growth. I’m of the opinion the oil
selloff has been a bit overdone…though I’m
certainly willing to entertain other opinions.

Today’s Calendar (all times Central)
   • Trade Balance – 7:30am
   • Jobless Claims – 7:30am
   • EIA Natural Gas Storage – 9:30am
   • EIA Petroleum Inventories – 10:00am
   • Several Fed speakers

Thanks for reading.
David Zelinski
dzelinski@nesvick.com
901-766-4684
Trillian IM: dzelinski@nesvick.com

DISCLAIMER:
This communication is a solicitation for entering into derivatives transactions. It is for clients, affiliates, and
associates of Nesvick Trading Group, LLC only. The information contained herein has been taken from trade and
statistical services and other sources we believe are reliable. Opinions expressed reflect judgments at this date
and are subject to change without notice. These materials represent the opinions and viewpoints of the
author and do not necessarily reflect the opinions or trading strategies of Nesvick Trading Group LLC and its
subsidiaries. Nesvick Trading Group, LLC does not guarantee that such information is accurate or complete and it
should not be relied upon as such.

Officers, employees, and affiliates of Nesvick Trading Group, LLC may or may not, from time to time, have long
or short positions in, and buy or sell, the securities and derivatives (for their own account or others), if any,
referred to in this commentary.

There is risk of loss in trading futures and options and it is not suitable for all investors. PAST RESULTS ARE NOT
NECESSARILY INDICATIVE OF FUTURE RETURNS. Nesvick Trading Group LLC is not responsible for any
redistribution of this material by third parties or any trading decision taken by persons not intended to view this
material.

                                                         6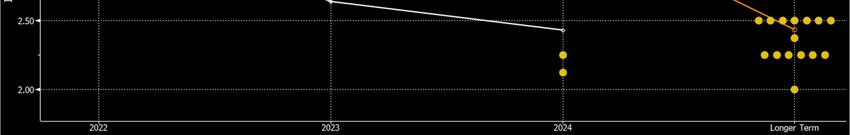
Thursday, July 7, 2022
    NTG Morning Comments
         www.nesvick.com

7
You can also read