NSTA National 2022 Houston, TX Let's Get Physical: Human Physiology Experiments - Vernier
←
→
Page content transcription
If your browser does not render page correctly, please read the page content below
NSTA National 2022 Houston, TX Let’s Get Physical: Human Physiology Experiments Experiments: Limb Position and Grip Strength Go Direct Hand Dynamometer Introduction to Electrocardiography Go Direct EKG Introduction to Electromyography Go Direct Hand Dynamometer Go Direct EKG Workshop presenters: Coleen McDaniel Nüsret Hisim biology@vernier.com Vernier Software & Technology • 888-VERNIER (888-837-6437) info@vernier.com • www.vernier.com
Graphical Analysis 2
Limb Position and Grip Strength
The importance of hand strength and function is evident in all aspects of our daily living, from
eating and maintaining personal hygiene to typing at the computer, performing brain surgery, or
playing tennis or the piano. People suffering from arthritis or hand injury quickly appreciate the
difficulty of performing even simple tasks with reduced grip strength.
Testing of hand grip strength is used by orthopedic surgeons and physical therapists to evaluate
the extent of an injury and the progress of recovery. Grip strength can also be used to diagnose
neuromuscular problems such as stroke, herniated disks in the neck, carpal tunnel syndrome, and
elbow tendonitis. Athletes are interested in grip strength because it relates to performance in many
sports, such as tennis, golf, baseball, football, gymnastics, and rock climbing.
Pinch strength is a way for occupational therapists to measure loss of fine-motor strength in the
thumb, fingers, and forearm. It is useful for analyzing the extent of an injury and the outcome
from surgery or therapy.
In Part I of this experiment, you will measure and compare grip strength in your right and left
hands. You will also correlate grip strength with arm position and handedness. In Part II you will
analyze the pinch strength of each of your four fingers on your dominant hand.
OBJECTIVES
Measure and compare grip strength of your right and left hands in three different lower arm
positions.
Compare grip strength of dominant hand and nondominant hand.
Compare the pinch strengths of the individual fingers of the dominant hand.
MATERIALS
Chromebook, computer, or mobile device
Graphical Analysis app
Go Direct Hand Dynamometer
Human Physiology Experiments © Vernier Software & Technology 1Limb Position and Grip Strength
PROCEDURE
Each person in the group will have a chance to be the subject. Important: Do not attempt this
exercise if you have arthritis, carpal tunnel syndrome, or any ailment that might be exacerbated by
using the muscles of your arm and hand.
Part I Hand grip strength
1. Launch Graphical Analysis. Connect Go Direct Hand Dynamometer to your Chromebook,
computer, or mobile device.
2. Set up the data-collection mode.
a. Click or tap Mode to open Data Collection Settings.
b. Change Rate to 100 samples/s and End Collection to 10 s.
c. Click or tap Done.
3. Zero the readings for the Hand Dynamometer.
a. Have the subject hold the hand dynamometer in an upright position as in Figure 1; there
should not be any force on the pads of the sensor.
b. When the readings stabilize, click or tap the Force meter and choose Zero. The readings
for the sensor should be close to zero.
Figure 1 Figure 2
4. Have the subject sit with his or her back straight and feet flat on the floor. The Hand
Dynamometer should be held in the left hand. The elbow should be at a 90° angle, with the
arm unsupported and the hand in a neutral position (see Figure 2).
5. Have the subject close his or her eyes or avert them from the screen.
6. Click or tap Collect to start data collection. After collecting 2 seconds of baseline data, instruct
the subject to grip the sensor with full strength for the next 8 seconds. Data will be collected
for 10 seconds.
7. Determine the maximum and mean force exerted by your hand during a portion of the data-
collection period.
a. Select the data from 4 s to 8 s.
b. Click or tap Graph Tools, , and choose View Statistics.
c. Record the maximum and mean force in Table 1.
d. Dismiss the Statistics box.
2 Human Physiology ExperimentsLimb Position and Grip Strength
8. Repeat Steps 3−7 with the right hand. Note: The previous data set is automatically saved.
Figure 3 Figure 4
9. Repeat Steps 3−8 with the hand in a pronated position (palm down) (see Figure 3).
10. Repeat Steps 3−8 with the hand in a supinated position (palm up) (see Figure 4).
11. Repeat Steps 3–10 for each group member.
12. Work with your classmates to complete Table 2.
Part II Pinch strength
13. Change the data-collection duration.
a. Click or tap Mode to open Data Collection Settings.
b. Change End Collection to 30 s.
c. Click or tap Done.
14. Have the subject sit with his or her back straight and feet flat on the floor, holding the base of
the sensor with the nondominant hand (see Figure 5). Note: No additional force should be
placed on the sensor by this hand.
Figure 5
15. Have the subject close his or her eyes or avert them from the screen.
16. Zero the readings for the Hand Dynamometer.
a. Hold the Hand Dynamometer at the base, in an upright position. Do not put any force on
the pads of the Hand Dynamometer.
b. When the readings stabilize, click or tap the Force meter and choose Zero. The readings
for the sensor should be close to zero.
Human Physiology Experiments 3Limb Position and Grip Strength
17. Click or tap Collect to start data collection. Instruct the subject to immediately pinch the end
of the sensor between the pads of the thumb and forefinger of his or her dominant hand, and
hold for 5 seconds.
18. Instruct the subject to switch to successive fingers every 5 seconds. Data collection will stop
after 30 seconds.
19. Determine the mean force applied during each pinch.
a. Select the data in the first plateau on the graph to select the data representing the pinch
strength of the thumb and index finger.
b. Click or tap Graph Tools, , and choose View Statistics. Record the mean pinch strength
to the nearest 0.1 N in Table 3.
c. Select the data in the second plateau, representing the pinch strength of the thumb and
middle finger.
d. Click or tap Graph Tools, , and choose View Statistics. Record the mean pinch strength
to the nearest 0.1 N in Table 3.
e. Repeat this process to obtain statistics for the pinch strengths of the remaining two fingers.
20. Repeat Steps 16–19 for each person in the group.
DATA
Table 1: Individual Grip Strength Data
Maximum force Mean force
(N) (N)
Right hand grip strength: neutral
Left hand grip strength: neutral
Right hand grip strength: prone
Left hand grip strength: prone
Right hand grip strength: supine
Left hand grip strength: supine
4 Human Physiology ExperimentsLimb Position and Grip Strength
Table 2: Class Grip Strength Data
Average mean force:
neutral
(N)
Right hand Left hand
Right-handed individuals
Left-handed individuals
Table 3: Individual Pinch Strength Data
Mean force
(N)
Dominant hand index finger
Dominant hand middle finger
Dominant hand ring finger
Dominant hand little finger
DATA ANALYSIS
1. Is there a difference in grip strength in your dominant and nondominant hands? Are you
surprised by the result?
2. Does there appear to be a correlation between grip strength and arm position? If so, in which
position was grip the strongest? Weakest?
3. Examining the data in Table 2, does there appear to be a correlation between “handedness”
and grip strength? Are the results similar for right-handed and left-handed people?
4. Using the pinch strength data in Table 3, describe the difference in strength between fingers.
Where is the difference the largest?
5. List at least two possible reasons for the differences you see between the pinch strength of the
first two fingers and the second two fingers. In your answer consider actions of the hand and
musculature. Note: You can use an anatomy book or atlas to view the muscles of the forearm
and hand.
EXTENSIONS
1. Perform daily hand-strengthening exercises to increase your grip and/or pinch strength (such
as squeezing a rubber ball). Measure your grip and/or pinch strength after two weeks and after
four weeks. Compare the results with your original data.
2. Design an experiment to explore whether there is a correlation between grip strength and other
physical characteristics such as height or arm circumference.
Human Physiology Experiments 5Graphical Analysis 8
Introduction to Electrocardiography
An electrocardiogram (ECG or EKG) is a graphical recording of the electrical events occurring
within the heart. In a healthy heart there is a natural pacemaker in the right atrium (the sinoatrial
node) which initiates an electrical sequence. This impulse then passes down natural conduction
pathways between the atria to the atrioventricular node and from there to both ventricles. The
natural conduction pathways facilitate orderly spread of the impulse and coordinated contraction
of first the atria and then the ventricles. The electrical journey creates unique deflections in the
EKG that tell a story about heart function and health (Figure 1). Even more information is
obtained by looking at the story from different angles, which is accomplished by placing
electrodes in various positions on the chest and extremities. A positive deflection in an EKG
tracing represents electrical activity moving toward the active lead (the green lead in this
experiment).
Five components of a single beat are traditionally recognized and labeled P, Q, R, S, and T. The
P wave represents the start of the electrical journey as the impulse spreads from the sinoatrial node
downward from the atria through the atrioventricular node and to the ventricles. Ventricular
activation is represented by the QRS complex. The T wave results from ventricular repolarization,
which is a recovery of the ventricular muscle tissue to its resting state. By looking at several beats
you can also calculate the rate for each component.
Figure 1
Doctors and other trained personnel can look at an EKG tracing and see evidence for disorders of
the heart such as abnormal slowing, speeding, irregular rhythms, injury to muscle tissue (angina),
and death of muscle tissue (myocardial infarction). The length of an interval indicates whether an
impulse is following its normal pathway. A long interval reveals that an impulse has been slowed
or has taken a longer route. A short interval reflects an impulse which followed a shorter route. If
a complex is absent, the electrical impulse did not rise normally, or was blocked at that part of the
heart. Lack of normal depolarization of the atria leads to an absent P wave. An absent QRS
complex after a normal P wave indicates the electrical impulse was blocked before it reached the
ventricles. Abnormally shaped complexes result from abnormal spread of the impulse through the
muscle tissue, such as in myocardial infarction where the impulse cannot follow its normal
pathway because of tissue death or injury. Electrical patterns may also be changed by metabolic
abnormalities and by various medications.
Human Physiology Experiments © Vernier Software & Technology 7Introduction to Electrocardiography
In this experiment, you will use the EKG sensor to make a five second graphical recording of the
heart’s electrical activity, and then switch the red and green leads to simulate the change in
electrical activity that can occur with a myocardial infarction (heart attack). You will identify the
different components of the waveforms and use them to determine heart rate.
OBJECTIVES
Obtain graphical representation of the electrical activity of the heart over a period of time.
Learn to recognize the different waveforms seen in an EKG and associate these waveforms
with activity of the heart.
Determine the heart rate by determining the rate of individual waveforms in the EKG.
Compare waveforms generated by alternate EKG lead placements.
MATERIALS
Chromebook, computer, or mobile device
Graphical Analysis app
Go Direct EKG
electrode tabs
PROCEDURE
Part I Standard limb lead EKG
1. Launch Graphical Analysis. Connect Go Direct EKG to your Chromebook, computer, or
mobile device.
2. Attach three electrode tabs to your arms as shown in Figure 2. Place a single patch on the
inside of the right wrist, on the inside of the right upper forearm (distal to the elbow), and on
the inside of the left upper forearm (distal to elbow).
Figure 2
3. Connect the EKG clips to the electrode tabs as shown in Figure 2. Sit in a relaxed position in a
chair, with your forearms resting on your legs or on the arms of the chair. When you are
properly positioned, have someone click or tap Collect to start data collection. Data collection
will stop after 3 seconds.
8 Human Physiology ExperimentsIntroduction to Electrocardiography
4. Determine the length of each of the intervals listed in Table 1. Use Figure 3 as your guide
when determining these intervals.
a. Click or tap the data point at the beginning of the interval and record the time component
of this point.
b. Click or tap the point at the end of the interval and record the time component of this point.
c. Determine the difference between the two time values and record this value to the nearest
0.01 s as the duration of the interval in Table 1.
5. Calculate the heart rate in beats/min using the EKG data. Record the heart rate to the nearest
whole number in Table 1.
Figure 3
P-R interval: time from the beginning of P wave to the start of the QRS complex
QRS complex: time from Q deflection to S deflection
Q-T interval: time from Q deflection to the end of the T
Part II Alternate limb lead EKG
6. Exchange the red and green EKG clips so that the green clip is now attached to the electrode
tab on the left arm and the red clip is on the right arm. . Sit in a relaxed position in a chair,
with your forearms resting on your legs or on the arms of the chair. When you are properly
positioned, have someone click or tap Collect to start data collection. Data collection will stop
after 3 seconds. Note: The previous data set is automatically saved.
7. Export, print, or sketch the tracing for alternate limb lead placement only.
DATA
Table 1
Beginning time Ending time Time
Interval
(s) (s) (s)
P–R
QRS
Q–T
R–R
Human Physiology Experiments 9Introduction to Electrocardiography
Heart rate (bpm)
Table 2: Standard Resting Electrocardiogram Interval Times
P–R interval 0.12 to 0.20 s
QRS interval less than 0.12 s
Q–T interval 0.30 to 0.40 s
DATA ANALYSIS
Health-care professionals ask the following questions when interpreting an EKG:
Can all components be identified in each beat?
Are the intervals between each component and each complex consistent?
Are there clear abnormalities of any of the wave components?
Using these questions as guides, analyze each of the following three-beat EKG tracings and record
your conclusions in Table 3 (indicate presence or absence of the P wave, and whether other
intervals and/or shapes are normal or abnormal). The first analysis (a) is done for you.
a. b.
c. d.
e. f.
g. h.
10 Human Physiology ExperimentsIntroduction to Electrocardiography
Table 3
P Wave PR Interval QRS Interval QRS Shape T Wave
ECG Beat Pres. Abs. Nml. Abs./Abn. Nml. Abs./Abn. Nml. Abn. Nml. Abs./Abn.
1 X X X X X
a 2 X X X X X
3 X X X X X
1
b 2
3
1
c 2
3
1
d 2
3
1
e 2
3
1
f 2
3
1
g 2
3
1
h 2
3
Human Physiology Experiments 11Graphical Analysis 3
Introduction to Electromyography
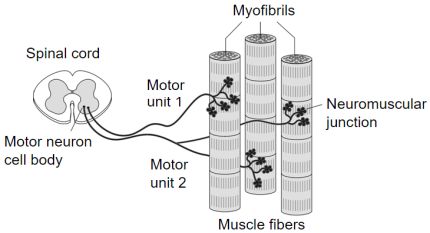
Voluntary muscle contraction is the result of communication between the brain and individual
muscle fibers of the musculoskeletal system. A thought is transformed into electrical impulses that
travel down interneurons and motor neurons (in the spinal cord and peripheral nerves) to the
neuromuscular junctions that form a motor unit (see Figure 1).
The individual muscle fibers within each motor unit contract with an all-or-none response when
stimulated, meaning that the muscle fiber contracts to its maximum potential or not at all. The
strength of contraction of a whole muscle depends on how many motor units are activated and can
be correlated with electrical activity measured over the muscle with a technique called
electromyography, or EMG.
In this experiment, you will use the Hand Dynamometer to measure maximum grip strength and
correlate this with electrical activity of the muscles involved as measured using the EKG Sensor.
You will see if electrical activity changes as a muscle fatigues during continuous maximal effort.
Finally, you will observe the results of a conscious effort to overcome fatigue in the muscles being
tested.
Figure 1
OBJECTIVES
Obtain graphical representation of the electrical activity of a muscle.
Correlate grip strength measurements with electrical activity data.
Correlate measurements of grip strength and electrical activity with muscle fatigue.
Observe the effect on grip strength of a conscious effort to overcome fatigue.
MATERIALS
Chromebook, computer, or mobile device
Graphical Analysis app
Go Direct Hand Dynamometer
Go Direct EKG
electrode tabs
Human Physiology Experiments © Vernier Software & Technology 13Introduction to Electromyography
PROCEDURE
Part I Grip strength without visual feedback
Select one person from your group to be the subject. Important: Do not attempt this experiment if
you suffer from arthritis or other conditions of the hand, wrist, forearm, or elbow.
1. Connect and set up the sensors.
a. Launch Graphical Analysis.
b. Connect Go Direct EKG to your Chromebook, computer, or mobile device.
c. Click or tap Sensor Channels. Deselect the EKG channel and select the EMG Rectified
channel.
d. Connect Go Direct Hand Dynamometer to your Chromebook, computer, or mobile device.
The default channel is correct for this experiment.
e. Click or tap Done.
2. Click or tap Mode to open Data Collection Settings. Change Rate to 100 samples/s and End
Collection to 60 s. Click or tap Done.
3. Zero the readings for the Hand Dynamometer.
a. Hold the hand dynamometer in an upright position as in Figure 2; do not put any force on
the pads of the sensor.
b. When the readings stabilize, click or tap the Force meter and choose Zero. The readings
for the sensor should be close to zero.
Figure 2
4. Set up the EKG sensor.
a. Attach three electrode tabs to one of your arms as shown in Figure 3. Two tabs should be
placed on the ventral forearm, 5 cm and 10 cm from the medial epicondyle along an
imaginary line connecting the epicondyle and the middle finger. The third tab should be on
the upper arm.
b. Attach the green and red leads to the tabs on the ventral forearm. For this activity, the
green and red leads are interchangeable.
c. Attach the black lead to the upper arm.
Figure 3
14 Human Physiology ExperimentsIntroduction to Electromyography
5. Have the subject sit with his or her back straight and feet flat on the floor. The elbow should
be at a 90° angle, with the arm unsupported.
6. Have the subject close his or her eyes or avert them from the screen.
7. Instruct the subject to grip the sensor with full strength and click or tap Collect to start data
collection. The subject should exert maximum effort throughout the data-collection period.
8. At 40 s, the lab partner(s) should encourage the subject to grip even harder. Data will be
collected for 60 s.
9. Determine the mean force exerted during three time intervals.
a. Select the data from 0 s to 20 s on the force vs. time graph.
b. Click or tap Graph Tools, , and choose View Statistics.
c. Record the mean force in Table 1, rounding to the nearest 0.1 N.
d. Dismiss the Statistics box.
e. Repeat this process to find the mean force for two other intervals: 20−40 s and 40−60 s.
10. Using the EMG graph, repeat Step 9 to record the maximum, minimum, and ΔmV during three
time intervals: 0–20 s, 20−40 s, and 40−60 s. Record the values in Table 1, rounding to the
nearest 0.01 mV.
Part II Grip strength with visual feedback
11. Have the subject sit with his or her back straight and feet flat on the floor. The Hand
Dynamometer should be held in the same hand used in Part I of this experiment. Instruct the
subject to position his or her elbow at a 90° angle, with the arm unsupported, and to close his
or her eyes, or avert them from the screen.
12. Instruct the subject to grip the sensor with full strength and click or tap Collect to start data
collection. The subject should exert near maximum effort throughout the duration of the
experiment.
13. At 40 s, instruct the subject to watch the screen and attempt to match his or her beginning grip
strength (the level achieved in the first few seconds of the experiment). The subject should
maintain this grip for the duration of the data-collection period. Data will be collected for 60 s.
14. Determine the mean force exerted during three time intervals.
a. Select the data from 0 s to 20 s on the force vs. time graph.
b. Click or tap Graph Tools, , and choose View Statistics.
c. Record the mean force in Table 1, rounding to the nearest 0.1 N.
d. Dismiss the Statistics box.
e. Repeat these steps to find the mean force for two other intervals: 20−40 s and 40−60 s.
15. Using the EMG graph, repeat Step 14 to record the maximum, minimum, and ΔmV during
three time intervals: 0–20 s, 20−40 s, and 40−60 s. Record the values in Table 1, rounding to
the nearest 0.01 mV.
Human Physiology Experiments 15Introduction to Electromyography
Part III Repetitive grip strength
16. Have the subject sit with his or her back straight and feet flat on the floor. The Hand
Dynamometer should be held in the same hand used in Parts I and II of this experiment.
Instruct the subject to position his or her elbow at a 90° angle, with the arm unsupported, and
to close his or her eyes or avert them from the screen.
17. Instruct the subject to rapidly grip and relax his or her grip on the sensor (approximately twice
per second). Click or tap Collect to start data collection. The subject should exert maximum
effort throughout the duration of data collection.
18. At 40 s, the lab partner(s) should encourage the subject to grip even harder. Data will be
collected for 100 s.
19. Determine the mean force exerted during three time intervals.
a. Select the data from 0 s to 20 s on the force vs. time graph.
b. Click or tap Graph Tools, , and choose Statistics.
c. Record the mean force in Table 1, rounding to the nearest 0.1 N.
d. Dismiss the Statistics box.
e. Repeat these steps to find the mean force for two other intervals: 20−40 s and 40−60 s.
20. Using the EMG graph, repeat Step 19 to record the maximum, minimum, and ΔmV during
three time intervals: 0–20 s, 20−40 s, and 40−60 s. Record the values in Table 1, rounding to
the nearest 0.01 mV.
DATA
Table 1: Continuous Grip Strength without Visual Feedback
EMG data
Mean grip strength
Time interval Max Min
(N) ΔmV
(mV) (mV)
0–20 s
20–40 s
40–60 s
Table 2: Continuous Grip Strength with Visual Feedback
EMG data
Mean grip strength
Time interval Max Min
(N) ΔmV
(mV) (mV)
0–20 s
20–40 s
40–60 s
16 Human Physiology ExperimentsIntroduction to Electromyography
Table 3: Repetitive Grip Strength
EMG data
Mean grip strength
Time interval Max Min
(N) ΔmV
(mV) (mV)
0–20 s
20–40 s
40–60 s
DATA ANALYSIS
1. Use the data in Table 1 to calculate the percent loss of grip strength that occurred between the
0–20 s and 20–40 s intervals. Describe a situation in which such a loss of grip strength is
noticeable in your day-to-day life.
2. Use the data in Table 1 to calculate the percent change in amplitude (∆mV) in electrical
activity that occurred between the 0–20 s and 20–40 s intervals. Do the same for grip strength.
What accounts for the difference in the percent change observed in grip strength and ∆mV for
the two time intervals?
3. Compare mean grip strengths and ∆mV for the 0–20 s and 40–60 s in Table 1. Do your
findings support or refute the practice of “coaching from the sidelines” at sporting events?
4. Use the graphs and the data in Table 1 to explain how our neuromuscular systems attempt to
overcome fatigue during heavy work or exercise. How might fatigue increase the risk of
musculoskeletal injury?
5. Compare the data in Tables 1 and 2. Explain any differences seen in the 40–60 s time intervals
between the two tables. What does this tell you about the brain’s role in fatigue?
6. The mean grip strength is much lower for repetitive gripping (Table 3) than for continuous
gripping because repetitive relaxation of the hand is averaged into the calculation.
a. Compare your mean grip strength during the 0–20 s and 40–60 s time intervals in Tables 1
and 3. Comparing continues gripping to repetitive gripping, was there a difference in your
ability to recover strength with coaching?
b. Calculate the percent change in mean grip strength between the 1–20 s and 20–40 s time
intervals in Tables 1 and 3. Do your answers support brief relaxation of muscles to delay
fatigue?
Human Physiology Experiments 17You can also read