NORTH CAROLINA A PATHWAY TO A CLEANER ENERGY FUTURE IN - Sierra ...
←
→
Page content transcription
If your browser does not render page correctly, please read the page content below

A PATHWAY TO A CLEANER ENERGY FUTURE IN

NORTH CAROLINA
Authors: Xiaojing Sun, Ph. D, Matt Cox, Ph. D   Prepared for the Sierra Club, August, 2017

TABLE OF CONTENTS

Executive Summary . .  .  .  .  .  .  .  .  .  .  .  .  .  .  .  .  .  .  .  .  .  .  .  .  .  .  .  .  .  .  .  .  .  .  .  .  .  .  .  .  .  .  .  .  .  .  .  .  .  .  .  .  .  .  .  .  .  .  .  .  .  .  .  .  .  .  .  .  .  .  .  .  .  .  . 3

CHAPTER 1. North Carolina’s Electricity Future in a Business-as-Usual World. .  .  .  .  .  .  .  .  .  .  .  .  .  .  .  .  .  .  .  .  .  .  .  .  .  .  .  .  .  .  .  .  .  . 7
                1.1 Historical electricity generation in North Carolina . . . . . . . . . . . . . . . . . . . . . . . . . . . . . . . . . . . . . . . . . . . . . . . 7

                1.2 Electricity generation in DEC and DEP in a Business-as-Usual future 	��������������������������������������������������������7

                           1.2.1 Bill Impacts . . . . . . . . . . . . . . . . . . . . . . . . . . . . . . . . . . . . . . . . . . . . . . . . . . . . . . . . . . . . . . . . . . . . . . . . . .  8

                           1.2.2 Emission Impacts. . . . . . . . . . . . . . . . . . . . . . . . . . . . . . . . . . . . . . . . . . . . . . . . . . . . . . . . . . . . . . . . . . . . .  8

                1.3 Peak demand in DEC and DEP in a Business-as-Usual future	����������������������������������������������������������������������� 9

CHAPTER 2. Designing A Cleaner Energy Future for North Carolina. . . . . . . . . . . . . . . . . . . . . . . . . . . . . . . . . . . . . . . . . . . . . . 10
                2.1 Methodology overview. . . . . . . . . . . . . . . . . . . . . . . . . . . . . . . . . . . . . . . . . . . . . . . . . . . . . . . . . . . . . . . . . . . . . . 10

                2.2 Adjusted electricity consumption and demand growth . . . . . . . . . . . . . . . . . . . . . . . . . . . . . . . . . . . . . . . . 10

                2.3 An economics-driven approach to reduce reliance. . . . . . . . . . . . . . . . . . . . . . . . . . . . . . . . . . . . . . . . . . . .  11

                2.4 Harnessing economically-viable clean energy. . . . . . . . . . . . . . . . . . . . . . . . . . . . . . . . . . . . . . . . . . . . . . . . .  12

                           2.4.1 Energy efficiency programs . . . . . . . . . . . . . . . . . . . . . . . . . . . . . . . . . . . . . . . . . . . . . . . . . . . . . . . . . . .  12

                           2.4.2 Building codes . . . . . . . . . . . . . . . . . . . . . . . . . . . . . . . . . . . . . . . . . . . . . . . . . . . . . . . . . . . . . . . . . . . . . .  12

                           2.4.3 Demand response . . . . . . . . . . . . . . . . . . . . . . . . . . . . . . . . . . . . . . . . . . . . . . . . . . . . . . . . . . . . . . . . . . .  13

                           2.4.4 Enhanced renewable energy penetration. . . . . . . . . . . . . . . . . . . . . . . . . . . . . . . . . . . . . . . . . . . . . . .  13

                2.5 Building a lean, clean and reliable grid under the Cleaner Energy Plan 	��������������������������������������������������� 15

                2.6 ATHENIA overview . . . . . . . . . . . . . . . . . . . . . . . . . . . . . . . . . . . . . . . . . . . . . . . . . . . . . . . . . . . . . . . . . . . . . . . .  15

CHAPTER 3. Building A Leaner, Cleaner Electricity Grid in North Carolina. .  .  .  .  .  .  .  .  .  .  .  .  .  .  .  .  .  .  .  .  .  .  .  .  .  .  .  .  .  .  .  .  .  .  .  . 16
                3.1 A new electricity production paradigm in North Carolina. . . . . . . . . . . . . . . . . . . . . . . . . . . . . . . . . . . . . . .  16

                           3.1.1 A grid without coal . . . . . . . . . . . . . . . . . . . . . . . . . . . . . . . . . . . . . . . . . . . . . . . . . . . . . . . . . . . . . . . . . . .  16

                           3.1.2 Generation shifts between gas technologies . . . . . . . . . . . . . . . . . . . . . . . . . . . . . . . . . . . . . . . . . . . .  16

                           3.1.3 The rising relative importance of nuclear power . . . . . . . . . . . . . . . . . . . . . . . . . . . . . . . . . . . . . . . . .  17

                           3.1.4 Tripling the clean energy contribution in a decade. . . . . . . . . . . . . . . . . . . . . . . . . . . . . . . . . . . . . . .  17

                3.2 Peak Demand in North Carolina . . . . . . . . . . . . . . . . . . . . . . . . . . . . . . . . . . . . . . . . . . . . . . . . . . . . . . . . . . . . .  18

A Pathway to a Cleaner Energy Future in North Carolina                                                                                                                                                                                             1
CHAPTER 4: Economic Benefits to North Carolina Ratepayers and the State Economy 	���������������������������������������������������� 20
           4.1 Electricity bill savings . . . . . . . . . . . . . . . . . . . . . . . . . . . . . . . . . . . . . . . . . . . . . . . . . . . . . . . . . . . . . . . . . . . . .  20

           4.2 Economic growth and job creation . . . . . . . . . . . . . . . . . . . . . . . . . . . . . . . . . . . . . . . . . . . . . . . . . . . . . . . . .  20

                   4.2.1 Employment . . . . . . . . . . . . . . . . . . . . . . . . . . . . . . . . . . . . . . . . . . . . . . . . . . . . . . . . . . . . . . . . . . . . . . . . 21

                   4.2.2 Income . . . . . . . . . . . . . . . . . . . . . . . . . . . . . . . . . . . . . . . . . . . . . . . . . . . . . . . . . . . . . . . . . . . . . . . . . . . . . 21

                   4.2.3 GDP. . . . . . . . . . . . . . . . . . . . . . . . . . . . . . . . . . . . . . . . . . . . . . . . . . . . . . . . . . . . . . . . . . . . . . . . . . . . . . . . 21

CHAPTER 5: Environmental, Social, and Economic Benefits of North Carolina’s Cleaner Electricity Future	���������������������������������� 22
           5.1 Emissions reductions . . . . . . . . . . . . . . . . . . . . . . . . . . . . . . . . . . . . . . . . . . . . . . . . . . . . . . . . . . . . . . . . . . . . . . . 22

           5.2 Avoided social and economic damages . . . . . . . . . . . . . . . . . . . . . . . . . . . . . . . . . . . . . . . . . . . . . . . . . . . . .  23

           5.3 Reduction in CO2 emissions and the associated social and economic benefits	����������������������������������� 25

           5.4 Savings in water consumption and withdrawals. . . . . . . . . . . . . . . . . . . . . . . . . . . . . . . . . . . . . . . . . . . . . .  25

CHAPTER 6. Overall Benefit-cost Analysis. . . . . . . . . . . . . . . . . . . . . . . . . . . . . . . . . . . . . . . . . . . . . . . . . . . . . . . . . . . . . . . . .  28
           6.1 Benefits . . . . . . . . . . . . . . . . . . . . . . . . . . . . . . . . . . . . . . . . . . . . . . . . . . . . . . . . . . . . . . . . . . . . . . . . . . . . . . . . . .  28

           6.2 Costs . . . . . . . . . . . . . . . . . . . . . . . . . . . . . . . . . . . . . . . . . . . . . . . . . . . . . . . . . . . . . . . . . . . . . . . . . . . . . . . . . . . .  28

CHAPTER 7. Moving Towards A Clean Energy Future. . . . . . . . . . . . . . . . . . . . . . . . . . . . . . . . . . . . . . . . . . . . . . . . . . . . . . . . .  29
           7.1 A lean, clean, and reliable electric grid is within reach in North Carolina 	����������������������������������������������� 29

           7.2 Harnessing the energy, environmental, and social benefits . . . . . . . . . . . . . . . . . . . . . . . . . . . . . . . . . . . .  30

Appendix A. Description of ATHENIA Modules . . . . . . . . . . . . . . . . . . . . . . . . . . . . . . . . . . . . . . . . . . . . . . . . . . . . . . . . . . . . . . 31

Appendix B. Costs Included in the Economic Analysis of Costs to Operate Power Plants 	������������������������������������������������������� 34

Appendix C. Expanded Energy Efficiency and Conservation Modeling Details . . . . . . . . . . . . . . . . . . . . . . . . . . . . . . . . . . . .  34

Appendix D. Methodology for Determining Social Damages Associated with Emissions 	������������������������������������������������������� 36

A Pathway to a Cleaner Energy Future in North Carolina                                                                                                                                        2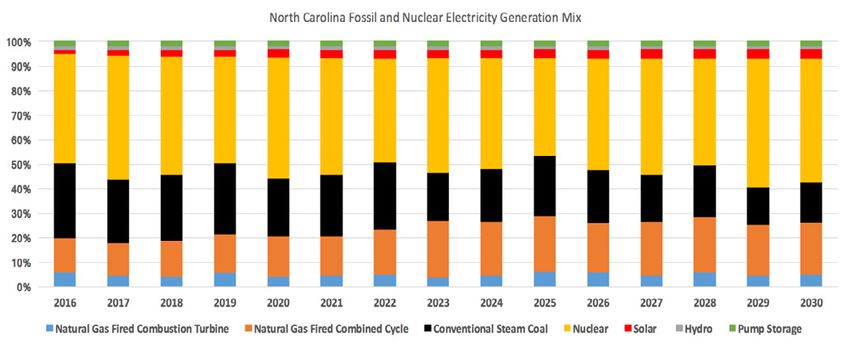
EXECUTIVE SUMMARY
The state of North Carolina is at a crossroads regarding demand. The results of this study suggest that the
its energy future, facing two dramatically different Cleaner Energy Plan will not only maintain the reliability
paths. Duke Energy, the main electricity provider in of the grid and make electricity service more affordable
the state, calls for 5,617 MW of new fossil and nuclear for North Carolinians, it will reduce the environmental
demand levels diminish the argument
capacity between 2018 and 2028 in its preferred for new fossil andassociated
impact nuclear capacity. Additionally,
with electricity production. all
existingplans.
resource coal-fired generating
Under this capacity can
“Business-As-Usual” be retired in a 10-year period, reducing system costs
(BAU)
D E S I G N I N G A C L E A N E N E R GY F U T U R E
without jeopardizing grid reliability. Finally, the machine
vision, fossil fuel and nuclear generation are front
The Cleaner learning-powered
Energy Plan evaluated simulation results
in this study begins
and center in meeting electricity demand. Although
show that clean energy plays an important
renewable energy and energy efficiency are required to
role in meeting
with realisticdemand and
electricity keep the
consumption grid
and reliable.
peak demand
supply 12.5% of the utility’s sales by 2021, Duke Energy forecasts that align with those of other energy system
does not plan to add any utility-owned solar or wind modeling experts and recent North Carolina history.
The Clean Energy Future Is Economically
capacity to the grid; does not plan to meaningfully
Wiser
The results demonstrate that Duke Energy severely
increase energy efficiency levels (which under Duke’s overestimated both consumption and demand growth.
plans will meet, at most, 0.5% of electricity demand); The realistic growth rates of the Cleaner Energy Plan
Theplans
and Cleaner Energy
to utilize only aPlan
very will
small deliver tangible
amount of demandfinancial benefits to North Carolina electricity
eliminate some of the utilities’ justification for the
ratepayers.
response The reduction in customer electricity demand
programs. constructiondueofto energy
new efficiency,
generating demand
assets. Furthermore,
response, and distributed renewable sources translates
In dramatic contrast to Duke Energy’s fossil fuel-reliant
to lower
the Cleaner overall
Energy consumption
Plan introduces and lower
cost-effective
electricity
vision, bills. Despite
The Greenlink Group (an modest
energybeginnings,
research firm)the savings
automated ramp up quickly
demand responseand eventually
programs reach a
and energy
cumulative
has evaluated savings
a cleaner of $5.4pathway,
energy billion whereby
for Duke Energy customers. Relative to the BAU, residential
efficiency programs, further deepening the reductions
in electricity consumption and peak demand. In
customers
23% will demand
of electricity see an average
is met by $101
resourcesreduction
such in their annual electricity bills; non-residential
addition, the Cleaner Energy Plan would also take
customers will experience a $611 annual electricity
as energy efficiency, distributed and utility-scale solar, bill saving.
full advantage of economical renewable and energy
wind, hydroelectric power, demand response, and
energy storage technologies. In this Cleaner Energy storage technologies, lowering the emissions intensity
of the electricity supply.
Jobs, incomes, and GDP are all higher in the Cleaner Energy Plan than in the BAU. Under the
Plan, none of the new fossil and nuclear capacity that
Duke Energy has proposed to construct over the next
Cleaner Energy Plan, employment would increase,
ten years will be needed, and the seven coal plants
ranging from 109,000 to 157,000 job-years
The proposed clean energy measures would
fundamentally alter the dynamics of electricity demand
betweenon2018
currently Duke’sand 2028.
system willIncomes
be retiredwould
between experience
2018 and asupplynet increase of $4.8 billion to $7.7 billion,
in North Carolina. Their substantial impact
while
and 2027North Carolina’s
because GDP increases
they are unnecessary bysystem
to meet $3.7 billion
on Duke to Energy’s
$8.2 billion (Figure
resource ES-1). Overall,
mix manifests in three
economic development is accelerated dramatically under the Cleaner Energy Plan.
$1,200 20,000
18,000
$1,000
16,000
14,000
$800
Job-Years
Millions $
12,000
$600 10,000
8,000
$400
6,000
4,000
$200
2,000
$0 0
2018 2019 2020 2021 2022 2023 2024 2025 2026 2027 2028
Net Job-Years (H) Net Job-Years (L) Net Income (H)
Net GDP (H) Net Income (L) Net GDP (L)
Figure ES-1 Net EconomicFigure ES-1 Net Economic Development Impacts of the Cleaner Energy Plan for North Carolina (2015-$) (H: High, L: Low)
Development Impacts of the Cleaner Energy Plan for North Carolina
(2015-$) (H: High, L: Low)
A Pathway to a Cleaner Energy Future in North Carolina 3
scenario than under the BAU. Overall gas use, however, is lower under the Cleaner Energy Plan
   than under the BAU.

                                                                    16% 17% 22% 22% 25% 28% 29% 31% 30% 32% 35%

         Figure ES-2 Electricity Generation in Duke Energy
                                                    Figure ES-2 System,       BAU invs.
                                                                Electricity Generation    Cleaner
                                                                                       Duke           Energy
                                                                                            Energy System, BAU vs.Plan
                                                                                                                  Cleaner Energy Plan
                                        (Percentage
      (Percentage numbers indicate decrease         numbers
                                             in total       indicatebased
                                                      fossil-fuel    decrease in total fossil-fuel
                                                                           generation       in thebased generation
                                                                                                    Cleaner        in thePlan
                                                                                                              Energy      Cleaner Energy
                                                                                                                               over  BAU)Plan over BAU)

   In contrast
ways.             to the
       First, under   the diminishing
                          Cleaner Energy  role of fossil
                                             Plan, more- generation,     cleanwould
                                                                    Incomes      energy  resourcesa net
                                                                                      experience     experience
                                                                                                          increase of $4.8 billion
likely consumption and peak demand levels diminish                  to $7.7 billion, while North Carolina’s GDP increases
   tremendous growth under the Cleaner Energy Plan, meeting 23% of the total Duke Energy
the argument for new fossil and nuclear capacity.                   by $3.7 billion to $8.2 billion (Figure ES-1). Overall,
   system    load   in 2028.  Solar   becomes     the  largest
Additionally, all existing coal-fired generating capacity      clean   energy source
                                                                    economic            in the isCleaner
                                                                                 development               Energy
                                                                                                  accelerated      Plan,
                                                                                                                dramatically
canproducing
     be retired nearly    16 million
                 in a 10-year   period, MWh     of system
                                         reducing   electricity in 2028,
                                                                    under more     than twice
                                                                            the Cleaner  EnergyasPlan.
                                                                                                   much as its 2028
   contribution in the BAU scenario. New wind capacity in northeastern North Carolina and wind
costs  without  jeopardizing    grid reliability. Finally, the
machine learning-powered simulation results show                    T H E C L E A N E R E N E R GY P L A N
   energy purchases from transmission projects make wind            TRAN   the
                                                                             S Fsecond
                                                                                 O R M Slargest
                                                                                          T H E Gclean
                                                                                                   R I D energy
that clean energy plays an important role in meeting
   resource
demand    andinkeepthethe
                       State  (Figure
                           grid reliable.ES-3). Energy efficiency’s contribution to reducing electricity
                                                                    A significant fuel mix change will occur for Duke

   demand will ramp up from its current level of 0.4% Energy’s       to 4% bycentralized-generating      system over the course
                                                                                  2028, a ten-fold growth.     Albeit
T H E C L E A N E N E R GY F U T U R E I S                          of the next decade. Compared to the BAU scenario,
E Csmall
    O N OinM Ienergy
               C A L LYterms,
                          WISE   demand
                                   R       response programs come          at a critical time when power
                                                                    the Cleaner Energy Plan creates a significant shift away
Thereductions    help to
     Cleaner Energy        maintain
                        Plan           operational
                              will deliver            reliability and
                                           tangible financial       fromcost-effectiveness.    The aggressive
                                                                          coal, nuclear, and combined             pursuit
                                                                                                           cycle gas generation
benefits to North Carolina electricity ratepayers. The              towards clean energy resources such as solar, wind, and
reduction in customer electricity demand due to                     battery storage (Figure ES-2). Coal-fired power plants
                                                                                                                          7
energy efficiency, demand response, and distributed                 are phased out entirely by 2027. While combined cycle
renewable sources translates to lower overall                       gas plants play a smaller role under the Cleaner Energy
consumption and lower electricity bills. Despite modest             Plan, combustion turbine gas units will generate more
beginnings, the savings ramp up quickly and eventually              electricity under this scenario than under the BAU.
reach a cumulative savings of $5.4 billion for Duke                 Overall gas use, however, is lower under the Cleaner
Energy customers. Relative to the BAU, residential                  Energy Plan than under the BAU.
customers will see an average $101 reduction in their
                                                                    In contrast to the diminishing role of fossil generation,
annual electricity bills; non-residential customers will
                                                                    clean energy resources experience tremendous growth
experience a $611 annual electricity bill saving.
                                                                    under the Cleaner Energy Plan, meeting 23% of the
Jobs, incomes, and GDP are all higher in the Cleaner                total Duke Energy system load in 2028. Solar becomes
Energy Plan than in the BAU. Under the Cleaner                      the largest clean energy source in the Cleaner Energy
Energy Plan, employment would increase, ranging from                Plan, producing nearly 16 million MWh of electricity in
109,000 to 157,000 job-years between 2018 and 2028.                 2028, more than twice as much as its 2028 contribution

A Pathway to a Cleaner Energy Future in North Carolina                                                                                               4
North Carolina’s energy mix, as shown in Figure ES-4.
40 153%
139%
35
40 116% 153%
101% 139%
30
35 92% 99% 116%
85% 101%
25
30 71% 85%
92% 99%
72%
20
25 71%
72%
MWhMWh
15
20 7%
5%
10
15 7%
Million
5%
5
10
Million
05
20182018
20192019
20202020
20212021
20222022
20232023
20242024
20252025
20262026
20272027
20282028
20182018
20192019
20202020
20212021
20222022
20232023
20242024
20252025
20262026
20272027
20282028
0
BAU Scenario Clean Energy Scenario
Hydro Solar Pumped
BAUStorage
Scenario Wind Battery Storage Clean
Efficiency Demand Response
Energy Scenario
Hydro
Figure ES-3 Solar Pumped
Electricity Storage
Generation fromWind Battery Storage
Clean Energy Resources, Efficiency
BAU vs. CleanerDemand Energy Response Plan
Figure ES-3numbers
(Percentage Electricity Generation
indicate increase in from Clean
total clean Energy
electricity
Figure ES-3 Resources,
generation
Electricity BAU
in the
Generation from Clean Energyvs.
Cleaner Cleaner
Energy
Resources, vs.Energy
BAUPlan Plan
overEnergy
Cleaner BAU) Plan
(Percentage numbers indicate increase in total clean electricity generation in the Cleaner Energy Plan over BAU)
(Percentage numbers indicate increase in total clean electricity generation in the Cleaner Energy Plan over BAU)
Pumped Battery
Storage Efficiency NGCT Pumped Storage Demand
Pumped
1.8% Battery
0.1% Efficiency Response
0.2% 6.1% Storage
Storage Efficiency NGCT Pumped Storage
Wind Demand
0.1%
Solar 2.3% 2.4%
1.8% 0.2% 6.1% Storage 0.1% Efficiency
5.2% Response
Hydro 4.0% Wind 0.1%NGCT
Solar 2.3% 2.4%
1.6% 5.2% 17.8%
Hydro 4.0% Solar NGCT
1.6% NGCC
10.6% 17.8%
21.1% Solar
NGCC
Hydro10.6%
21.1%
2.0%
Hydro NGCC
2.0% 13.8%
NGCC
Nuclear 13.8%
43.6%
Nuclear
43.6%
Steam Nuclear
Coal 45.5%
Nuclear
Steam
21.6% 45.5%
BAU Coal Clean Energy Scenario
21.6%
BAU Clean
Figure ES-4 Energy
Resource Scenario
Mix in 2028, BAU vs. Clean Energy Scenario
Figure ES-4 Resource Mix in 2028, BAU vs. Clean Energy Scenario
Figure ES-4 Resource Mix in 2028, BAU vs. Clean Energy Scenario
in the BAU scenario. New wind capacity in northeastern critical time when power reductions help to maintain
North Carolina and wind energy purchases from operational reliability and cost-effectiveness. The
transmission projects make wind the second largest aggressive pursuit of energy efficiency and demand 8
clean energy resource in the State (Figure ES-3). response will also reduce peak load on the Duke 8
Energy efficiency’s contribution to reducing electricity Energy system by 18% in 2028. Altogether, clean energy
demand will ramp up from its current level of 0.4% resources become a substantial component of North
to 4% by 2028, a ten-fold growth. Albeit small in Carolina’s energy mix, as shown in Figure ES-4.
energy terms, demand response programs come at a
A Pathway to a Cleaner Energy Future in North Carolina 5
of Carbon). Overall, the Cleaner Energy Plan reduces total damages from electricity generation
   by $21 billion between 2018 and 2028, a 45% decline from the BAU scenario (Figure ES-5).

              Figure ES-5. Damages from All Pollutant Emissions,    BAU vs. Cleaner Energy Plan
                                                          Figure ES-5. Damages from All Pollutant Emissions, BAU vs. Cleaner Energy Plan
                                                                                                                          9
T H E C L E A N E R E N E R GY P L A N B E N E F I T S                 total damages from electricity generation by $21 billion
THE PUBLIC AND THE ENVIRONMENT                                         between 2018 and 2028, a 45% decline from the BAU
In addition to electricity bill savings, job creation, and             scenario (Figure ES-5).
GDP growth, the Cleaner Energy Plan also achieves a
suite of social and environmental benefits. Emissions                  Because many pollutants travel across state and
of carbon dioxide (CO2), sulfur dioxide (SO2), nitrogen                national borders, the public health benefits due to a
oxides (NOx), particulate matter, ammonia, and volatile                cleaner grid in North Carolina can be enjoyed in and
organic compounds (VOCs) are lower in the Cleaner                      beyond the state. Adult mortality declines by 1,200,
Energy Plan than the BAU scenario. Cumulatively,                       nearly 900 hospital visits for issues like asthma and
over 160 million metric tons of CO2 emissions will be                  cardiovascular disease are avoided, and society benefits
avoided between 2018 and 2028, equivalent to the                       from the added productivity of 93,000 missed work
expected emissions of 3.4 million cars over the same                   days being added back to the economy.
period. Similarly, across the other six pollutants, nearly             A C L E A N E N E R GY F U T U R E , A B E T T E R
47% of the emissions will be avoided.                                  FUTURE
                                                                       The Cleaner Energy Plan designed in this study is a
In addition to better air quality, 53 billion gallons of
                                                                       much more attractive development pathway for North
water consumption is avoided due to the retirement of
                                                                       Carolina. Economic opportunities are greatly expanded,
water-intensive coal-plants and the avoided operations
                                                                       environmental damage is much reduced, and social
of a new nuclear unit.
                                                                       outcomes are significantly better than under the BAU
A cleaner electricity supply leads to a suite of social,               trajectory. It is also significantly more cost-effective
environmental, and economic benefits such as better                    than the BAU case. The cumulative net monetary
public health, fewer crop failures, and lower extreme-                 benefits achieved in the Cleaner Energy Plan associated
weather-related risks to the economy. The avoided                      with the full complement of costs and benefits totals at
CO2 emissions alone produce about $3.6 billion social,                 $59 billion to $100 billion dollars. Overall, these results
environmental, and economic benefits globally (valued                  suggest the Cleaner Energy Plan represents a more
using the U.S. Interagency Working Group Social Cost                   desirable and sustainable future for North Carolina, its
of Carbon). Overall, the Cleaner Energy Plan reduces                   businesses, and its residents.

A Pathway to a Cleaner Energy Future in North Carolina                                                                                 6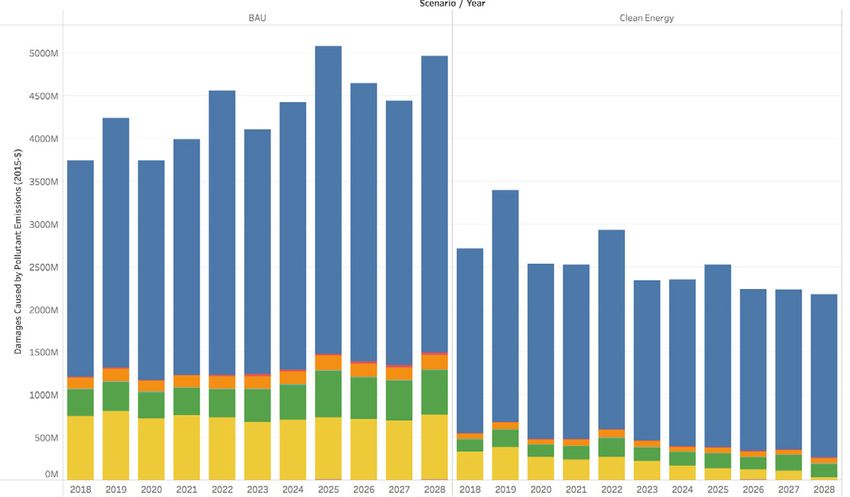
CHAPTER 1. NORTH CAROLINA’S ELECTRICITY FUTURE IN A BUSINESS-AS-USUAL
WORLD
1 .1 H I S TO R I C A L E L E C T R I C I T Y has been hampered by an unfavorable regulatory
G E N E R AT I O N I N N O R T H C A R O L I N A
environment. Although the state has a strong wind
The primary electric service provider in North Carolina
potential in the Appalachian mountain region as well
is Duke Energy, servicing over 70% of North Carolina’s
as the coastal region, the Mountain Ridge Protection
electricity demand. Duke Energy oversees two utility
Act, commonly called the “Ridge Law,” has restricted
companies in North Carolina: Duke Energy Progress
development of wind turbines on mountain ridges. The
(DEP) and Duke Energy Carolinas (DEC). DEC is the
consequence of the Ridge Law is that it has effectively
larger of the two companies, with 2.5 million residential,
banned 75% of the state’s on-shore wind potential from
commercial, and industrial customers, while DEP
being developed. The only wind farm that currently
services approximately 1.5 million customers.
exists in the state is a 200 MW project in Dominion’s
Historically, North Carolina has relied on fossil-based territory along the coast in the northeast corner of the
and nuclear energy as the primary resources for state.
electricity generation. Coal-fired generation was the
Although energy efficiency is a qualifying resource
single largest generation source in the 1990s, being
under the REPS, it has not grown in the resource mix
used to produce 61% of electricity in-state over the
over the past four years relative to demand growth.
decade.1 However, with the economics of natural gas
In 2016, energy efficiency offset 0.5% and 0.4% of the
improving over the past decade, the prominence of coal
generation in DEC and DEP, respectively. The American
decreased. In 2015, coal was the second largest source
Council on an Energy-Efficient Economy (ACEEE) ranks
of generation, after nuclear power and just ahead of
North Carolina 30th in the nation in terms of total-
natural gas by 3%, as shown in Figure 1-1.
percentage-savings from energy efficiency.3 In addition,
Renewable energy has seen significant growth in both utilities place in the bottom quartile in savings
North Carolina since the mid-2000s, due to regulatory achieved from efficiency and rank 31st and 35th out of
dynamics and rapid price reductions. A significant 51 in the ACEEE utility efficiency scorecard.4
CHAPTER
player1.inNORTH bothCAROLINA
aspects ’S Efor the North
LECTRICITY FUTURECarolina
IN A BUSINESS -AS-USUAL WORLD
market
1 . 2 E L E C T R I C I T Y G E N E R AT I O N I N D E C
was the establishment of the Renewable Energy and A N D D E P I N A B U S I N E S S -A S - U S UA L
Energy Efficiency Portfolio Standard (REPS) in 2007, FUTURE
1.1 HISTORICAL ELECTRICITY GENERATION IN NORTH CAROLINA
which requires that by 2021, 12.5% of the prior year’s Phase I of this study conducted a modeling exercise
Theretail
primaryelectricity
electric servicesales
providerfrom investor-owned
in North Carolina is Duke Energy, electric
servicing over 70% of
to understand the electricity landscape in the State of
North Carolina’s
utilities inelectricity
the state demand.
mustDukebeEnergy oversees two
supplied byutility companies in North
eligible
Carolina: Duke Energy Progress (DEP) and Duke Energy Carolinas (DEC). DEC is the larger of
North Carolina. Using the ATHENIA model, the study
the renewable
two companies, withand2.5energy efficiency
million residential, sources.
commercial, Utility-
and industrial customers, while developed a forecast of electricity demand and supply
DEP scale solar
services has led
approximately 1.5the charge
million customers.of renewable energy in Duke Energy Carolinas and Duke Energy Progress
deployment in North Carolina, most of which has been territory between 2017 and 2030 based on both
Historically, North Carolina has relied on fossil-based and nuclear energy as the primary
brought
resources onto generation.
for electricity the gridCoal-fired
as qualified
generationfacilities (QFs),
was the single largest generation utilities’ 2016 Integrated Resource Plans (IRP), referred
making
source thebeing
in the 1990s, stateusedfirst in the
to produce 61% nation for in-state
of electricity over the decade.1
PURPA-enabled to as the business-as-usual (BAU) scenario.
However, with the economics of natural gas improving
solar capacity, both in percentage and actual megawatt over the past decade, the prominence of
coal decreased. In 2015, coal was the second largest source of generation, after nuclear powerUnder the BAU scenario, demand for electricity in North
andterms.
just ahead In contrast, wind capacity
in Figuredevelopment
2
of natural gas by 3%, as shown 1-1.
Carolina will experience modest to strong growth in
Other
the next 15 years, following DEC and DEP’s Integrated
Resource Plans. After considering utility sponsored
Renewables
energy efficiency programs, DEC and DEP anticipate
Nuclear that demand from their customers will grow at 1% and
0.9% annually, respectively. The commercial sector will
Natural Gas
experience the strongest annual demand growth at
Coal 1.3%, followed by the residential sector and industrial
0 10 20 30 40 50 sectors.
Million MWh To meet this demand growth, the Duke utilities call
Figure 1-1 Electricity Generation by Fuel Type in North Carolina, 2015 for an expansion in electricity generating capacity to
Figure 1-1 ElectricitySource:
Generation by Fuel
EIA Form 923Type in North Carolina, 2015
Source: EIA Form 923 maintain demand-supply balance. As of 2016, 57% of
A Pathway to a Cleaner Energy Future in North Carolina 7
1
US Energy Information Administration. 2017. “State Electricity Data System.”
11
Figure 1-2 Duke Energy
Figure System-wide
1-2 Duke Energy System-wide Electricity Generation
Electricity Generation Mix for FossilMix for Fossil
and Nuclear and
Resources Nuclear
under the Business-as-Usual Scenario
Resources under the Business-as-Usual Scenario
the electricity generation in DEC came from nuclear 1 . 2 .1 B I L L I M PAC T S
1.2.1 BILL IMPACTS
power plants, followed by 25% from coal-fired power Consumers from all sectors in DEC and DEP are
plants; gas accounted for just over 10% of electricity expected to experience increases in their electricity
Consumers from all sectors in DEC and
generation. Although still the largest generation source, DEP are expected to experience
bills, due to upward increases
pressure on in electricity
their rates from
electricity
nuclear bills,fordue
accounts onlyto 39%
upward pressure
of DEP on electricity
generation; gas- rates from the
the planned planned
capacity capacity
and and grid as well as
grid expenditures,
expenditures,
fueled plants edge asout
wellcoal-fired
as growing powerconsumption
plants by 2levels. growing consumption levels.
percentage points to be the second largest electricity
Forecasts conducted in the first phase of this study
generation source in DEP, meeting 28% of demand.
Forecasts conducted in the first phase
Renewable energy accounts for less than 7% for both
of this study find
findthat onon
that average, residential
average, residentialcustomers
customersinin DEC will
DEC will
utilities. Morepay $119 pergenerating
fossil-based month for capacity
their electricity
will be use in 2017, but that will increase by 62% to
pay $119 per month for their electricity use in 2017, but
reachto$194
added in 2030
the DEC (bothsystems,
and DEP in nominal dollars).
according The bill that
to the
will increase by 62% to reach $194 in 2030 (both in
increase is more pronounced in DEP, as
nominal dollars). The bill increase is more pronounced
theBetween
IRPs. average 2017
residential
and 2030,customer is projected
DEC plans to add oneto see their monthly bills go up by 85% between
in DEP, as the average residential customer is projected
new gas combustion turbine (NGCT) plant rated at 468
2017 and 2030. Non-residential customers will also see toasee sizable
their increase in their
monthly bills electricity
go up by 85% between 2017
MW, one new gas combined cycle (NGCC) plant rated
bills. In both DEC and DEP, industrial
at 1221 MW, and two 1117 MW-rated nuclear units. Over
and commercial and customers will pay
2030. Non-residential 55% more
customersevery
will also see a
themonth
same for electricity in 2030 compared to 2017. Although non-residential customers inbills.
DECIn both DEC and
sizable increase in their electricity
period, DEP plans to add six new NGCT plants
DEP, industrial and commercial customers will pay 55%
payatless
rated perMW
2,158 kWh, their average
capacity, along withelectricity
two newconsumption
NGCC is 68% higher than their DEP
more every month for electricity in 2030 compared to
counterparts.
plants that have Consequently,
a combined rated thecapacity
electricity bill for
of 1,781 MW.an average non-residential customer in DEC
2017. Although non-residential customers in DEC pay
Asisa estimated
result of the to capacity
reach $1,471 per month
expansion, in 2030.
the utilities planAverage
lessnon-residential electricity
per kWh, their average bills in consumption
electricity DEP is
onaregasapproximately
to play a more 22% lower than in DEC, reaching $1,148
important role in meeting Duke’s 68% higher by 2030.
than their DEP counterparts. Consequently,
future electricity demand. The combined generation the electricity bill for an average non-residential
from NGCT and NGCC plants in 2030 will account for customer in DEC is estimated to reach $1,471 per month
1.2.2 E MISSION IMPACTS
over 27% of system-wide generation, seven percentage in 2030. Average non-residential electricity bills in DEP
points higher than the 2016 contribution. In the are approximately 22% lower than in DEC, reaching
ATHENIA
meantime, the tracks the byproducts
prominence of coal-firedof power
fossil-based
plants electricity
$1,148 generation,
by 2030. including six localized
willpollutants – SO2, NOx,
decline significantly PMnext
in the 2.5, PM 10, VOCs,
13 years; only and
14% NH
of 3 – as well as greenhouse gas emissions of
theCO 1 . 2 . 2 E M I S S I O N I M PAC T S
2. Previous analysis found that SO2, NOx, PM2.5, and CO2 are the four major air pollutants
electricity demand in 2030 will be met by coal-fired
power plants, down 26 percentage points from 2016 ATHENIA tracks the byproducts of fossil-based
levels. The majority of the fuel switch between coal electricity generation, including six localized 14pollutants
and gas happens between NGCC and coal-fired plants – SO2, NOx, PM2.5, PM10, VOCs, and NH3 – as well as
because they have similar generating profiles. greenhouse gas emissions of CO2. Previous analysis
found that SO2, NOx, PM2.5, and CO2 are the four
A Pathway to a Cleaner Energy Future in North Carolina 8coal plants such as Roxboro, Belews Creek, and Marshall have the largest damages associated
with their operations (Figure 1-3).
Dan River
Mayo
Marshall
Ashville CC
Cliffside
Figure 1-3 Cumulative Damages Caused by Criteria
Figure Pollutants
1-3 Cumulative Between
Damages Caused by Criteria 2017
Pollutantsand 2030
Between 2017 and 2030
Accounting for the full, global scope of pollutant impacts, the single largest source of social and
economic
major damage
air pollutants thatfrom thefor
account Duke
98% fleet
of theis CO2. Again, coal-fired
Cumulative power
emissions plants
across DECare theDEP
and largest
between
total damages associated with electricity generation 2017 and 2030 are slightly above 820 million metric
emitters of CO2 and are therefore responsible for the largest damages. Cumulative emissions
emissions in North Carolina. Within the localized tons, causing a cumulative damage of over $3 trillion
acrossfamily,
pollutant DEC NOx
and isDEP between
the single 2017
largest and of
source 2030 are(undiscounted)
slightly aboveover 820the million
next 14metric
years. tons,
causinginaterms
emissions cumulative damage
of tonnage. of over
However, $3 trillion (undiscounted) over the next 14 years.
the public
health and the environmental damage caused by 1.3 PEAK DEMAND IN DEC AND DEP IN A
B U S I N E S S -A S - U S UA L F U T U R E
a ton of NOx is significantly less than that caused
One key indicator that Duke Energy uses in their
by SO2 and PM2.5, due to the more severe public
resource planning is forecasted system peak demand
health consequences related to the latter two. In the
because they are obligated to build enough resources
projection, SO2 is initially the worst offender, causing
to reliably meet system demand. According to the
more than $470 million in damage in 2016. Coal- 15
BAU forecast conducted in the first phase of this study
fired power plants are the largest emitters of SO2.
using Greenlink’s proprietary model, both DEC and
Fortunately, as the share of electricity generated from
DEP’s peak demand will occur in winter time by 2028.
coal declines over time, the amount of SO2 and its
The highest electricity demand on the Duke system
associated damages also shrinks between 2016 and
(DEC and DEP combined) occurs at 8am on a January
2030. However, PM2.5, an air pollutant associated with
morning. Close to 34,000 MW of electric power needs
the combustion of both coal and natural gas, sees a
to be produced and delivered to the customers at
sharp increase between 2022 and 2028, due to the
that hour, a value approximately 7% higher than the
added NGCC and NGCT capacity in both DEC and DEP.
summer peak demand, which occurs around 5pm in
The projection finds that it will overtake SO2 in 2023
July. Although DEC and DEP experience their system
to be the most damaging air pollutant. In 2028, PM2.5
peaks on different days, because DEC’s system load
will cause more than $440 million in public health and
is 40% higher than that of DEP, the total Duke system
environmental damage; the damage value will decline
peak corresponds with DEC’s peak day. The predicted
slightly to $360 million by 2030. Large coal plants such
system-wide summer peak hour is around 5pm, which is
as Roxboro, Belews Creek, and Marshall have the largest
different from both utilities’ individual peak hours.
damages associated with their operations (Figure 1-3).
In summary, under the business-as-usual scenario,
Accounting for the full, global scope of pollutant
electricity demand in North Carolina will continue to
impacts, the single largest source of social and
grow between now and 2030; Duke Energy intends to
economic damage from the Duke fleet is CO2. Again,
respond to this by adding more electricity generating
coal-fired power plants are the largest emitters of CO2
capacity – the overwhelming majority of which will be
and are therefore responsible for the largest damages.
A Pathway to a Cleaner Energy Future in North Carolina 9gas. The results of this trajectory are higher system significant clean energy resources that can supplement
expenditures, higher electricity bills for customers, or even displace its current fossil- and nuclear-driven
worse air quality, growing CO2 emissions, and greater centralized electricity generation model. The remaining
stress on water resources, none of which are desirable sections of this report articulate a cleaner energy vision
outcomes for the public. that ensures the reliability of the grid and reduces
environmental externalities, while simultaneously saving
Fortunately, the business-as-usual scenario is not the
North Carolina ratepayers money.
only pathway available to North Carolina. The state has
CHAPTER 2. DESIGNING A CLEANER ENERGY FUTURE FOR NORTH CAROLINA
Using the BAU scenario as a baseline, Greenlink the pressure on utilities to finance and build many new
evaluated the possibility of a cleaner energy future for generating assets to meet demand and meet reliability
the state that does not involve significant spending on requirements.
building or maintaining fossil-based generating plants.
The rest of this chapter and its associated appendices
In this Cleaner Energy Plan, a significant portion of
explain the process of avoiding capacity expansions,
the future electricity demand will be met by a diverse
retiring existing centralized generation, and the
set of clean energy resources, including customer-
approach for adding new clean energy resources.
side solutions such as energy efficiency, demand
Core to this approach is the retirement of expensive
response, and distributed solar, as well as utility-scale
generation as made feasible through other efforts
technologies such as utility-scale solar, onshore wind,
evaluated in the study. Expensive generation is
grid-facing energy storage, and more. A more realistic
identified as incurring plant-level total operating
demand growth forecast is also envisioned, derived
expenses greater than $20 million in any given year
from the Energy Information Administration (EIA)’s
between 2018 and 2028 and costing over $10,000
2017 Annual Energy Outlook.5 In combination, these
per MW of capacity annually to maintain. Generation
resources can be utilized to offset the need for new
satisfying these criteria are retired, starting with the
fossil plants and the continued operation of costly
most-costly, as the reserve margin and loss-of-load-
existing fossil plants while still meeting state-wide
hour analysis permits, to ensure reliability. Overall, this
electricity demand over the next 10 years, i.e. between
allows for a lower-cost system to come into being in
2018 and 2028.
North Carolina.
2 .1 M E T H O D O LO GY OV E R V I E W Lastly, economically feasible energy efficiency and
The Cleaner Energy Plan in this study brings a
renewable energy resources will be deployed at scale
new approach to electricity supply and demand in
to cost-effectively meet demand as well as to displace
North Carolina. It begins with rethinking electricity
marginally more-expensive electricity production
consumption and peak demand forecasts and asks
coming from the remaining fossil and nuclear fleet
whether the growth trajectories proposed by the
in DEC and DEP territory. The overarching goal of
utilities are appropriate. After comparing the utilities’
this approach is to use economically-viable clean
reported growth rates with historical data and
energy resources to replace costly fossil plants while
predictions from other reputable sources, it is apparent
maintaining grid reliability.
that the growth rates in the two utilities’ IRP filings are
the most optimistic among all reviewed sources. If a 2 . 2 A DJ U S T E D E L E C T R I C I T Y
more likely growth forecast is adopted, the demand C O N S U M P T I O N A N D D E M A N D G R OW T H
for new generating assets is significantly less than in A N D T H E I R I M PAC T O N C E N T R A L I Z E D
G E N E R AT I N G C A PAC I T Y A D D I T I O N S
the BAU scenario. For the purpose of modeling the
Over the past four years, DEC’s electricity consumption
Cleaner Energy Plan, this study chooses to ground
growth has been relatively flat. However, the Company
the assumptions about the growth rates on historical
projects annual consumption growth of 1.1% per year
data using EIA Form 861 (formerly Form 826) and the
(1.0% after accounting for utility energy efficiency
assumptions used in Annual Energy Outlook 2017. As
programs), with the greatest growth coming from
a result, electricity consumption and peak demand
the commercial sector. Like DEC, DEP’s electricity
growth rates are reduced by more than 50% from DEC
consumption growth has been relatively flat, while the
and DEP forecasts. Lower growth rates relieve some of
A Pathway to a Cleaner Energy Future in North Carolina 10Table 2-1 Unnecessary Fossil-based and Nuclear Generating Capacity after Adjusting Demand
Growth and Accounting for Clean Energy
Utility Plant Type Capacity Proposed Online
(MW) Year
DEC Natural Gas Combined Cycle (NGCC) 1221 2023
DEC Natural Gas Combustion Turbine (NGCT) 468 2025
DEC Nuclear 1117 2027
DEP Natural Gas Combined Cycle (NGCC) 1221 2022
DEP Natural Gas Combustion Turbine (NGCT) 468 2023
DEP Natural Gas Combustion Turbine (NGCT) 186 2024
DEP Natural Gas Combustion Turbine (NGCT) 468 2026
DEP Natural Gas Combustion Turbine (NGCT) 468 2028
Table 2-1 Unnecessary Fossil-based and Nuclear Generating Capacity after Adjusting Demand Growth and Accounting for Clean Energy
2.3 AN ECONOMICS-DRIVEN APPROACH TO REDUCE
utility projecting a 1.1% pre-energy efficiency growth
RELIANCE ON EXISTING FOSSIL-BASED
is modeled as growing slightly less than 0.6% per year.
rate and a 0.9% post-efficiency growth rate. Both
PLANTS
utilities expect their peak demand to grow at a faster
Combined with an expansion of renewable energy
resources, described in Section 2.4, a slower growth in
rate than electricity consumption, at 1.3% per year.
demand for electricity makes clear that building seven
Besides
After avoiding
considering recentbuilding
historicalnew fossil-
patterns andand nuclear-based
other generating
fossil plants capacity,
and one nuclear unit isthis
not study also
unnecessary
seeks to understand the ability to cost-effectively reduce North Carolina’s use of fossil-based
projections, this study does not use the growth rates (Table 2-1).
from the IRPs, as they project growth increasing
generating
improbably capacity.
rapidly. An evaluation
The primary counterpoint of the operating
2 . 3 cost
A N of
E Ceach
O N Ocoal-fired
M I C S - D R Iand
V E Ngas-fired plant
A P P R OAC H
TO R E D U C E R E L I A N C E O N E X I S T I N G
determines
grounding which existing
this analysis plants
is the demand are the most expensive
projection F O S S I L-for
B ANorth
S E D PCarolina
L A N T S ratepayers to keep
for the VACAR SERC region (which is dominated by
on the system. Operating cost is defined as the total costavoiding
Besides required to operate,
building maintain,
new fossil- and
and nuclear-based
Duke Energy and Dominion), produced by the Energy generating capacity, this study also seeks to understand
retain environmental
Information Administrationcompliance forAnnual
as a part of the a plant. Thethemaintenance cost for each plant is calculated
ability to cost-effectively reduce North Carolina’s
basedOutlook
Energy on FERC Form
(AEO). 6
This1report
data. isApublished
list of the cost categories
and that aregenerating
use of fossil-based included capacity.
in the calculation can
An evaluation
updated annually to incorporate the best information
be found in Appendix B.
the federal government has on the current state of
of the operating cost of each coal-fired and gas-fired
plant determines which existing plants are the most
the entire energy system and projects future demands expensive for North Carolina ratepayers to keep on
based on peer-reviewed published methodologies. the system. Operating cost is defined as the total cost 19
The model used for the Annual Energy Outlook is the required to operate, maintain, and retain environmental
same one used to analyze energy policy proposals for compliance for a plant. The maintenance cost for each
Congress and other interested parties within the federal plant is calculated based on FERC Form 1 data. A list of
government. the cost categories that are included in the calculation
In the Reference Case of the 2017 AEO, net energy for can be found in Appendix B.
load in the electric power sector in the VACAR SERC Using the Coal Asset Valuation Tool (CAVT), this study
region grows by 0.4% per year from 2017 through 2028. calculates the environmental compliance costs of the
Since AEO does not report peak demand growth, it is coal plants in DEC and DEP territory.7 Compliance costs
calculated by taking the ratio between growth in peak center on three areas: cooling water circulation, CCR,8
demand and growth in total consumption provided by and effluent discharges. The compliance costs for each
the utilities in the IRP filings and comparing this to the plant are first amortized and then added to the annual
growth in total consumption. As a result, peak demand maintenance costs to derive final operating costs.
A Pathway to a Cleaner Energy Future in North Carolina 11$20 million annual in operating costs and maintenance 2 . 4 .1 E N E R GY E F F I C I E N C Y P R O G R A M S
costs of $10,000 per MW are the criteria chosen to Energy efficiency in electricity use is evaluated sector-
define costly fossil plants. Plants requiring greater than by-sector. Estimates for naturally-occurring or federally-
these levels of investment to remain functional are driven energy efficiency improvements are derived
usually old plants with pollution control technologies from the 2017 Energy Information Administration
that are in need of upgrades in order to comply with Annual Energy Outlook Reference Case.9
current or upcoming environmental regulations.
ToUsing theoperating
continue Coal Asset Valuation
plants Tool
of this kind (CAVT), thisCost-effective
means study calculates the improvements
efficiency environmental for the demand
sectors are identified
7 and modified from studies by the
compliance
high costs
system costs thatofare
the coal plants
ultimately passedin on
DECto and DEP territory. Compliance costs center on
National Renewable Energy Laboratory (NREL) and
three areas: cooling water circulation, CCR8, and effluent
ratepayers. In the Cleaner Energy Plan, they are retired
the Americandischarges. The
Council for ancompliance costs
Energy- Efficient for
Economy
from the generating fleet, which produces ratepayer
each plant
savings; someare first amortized
of these plants were and then
already added
slated for to the annual maintenance costs to derive final
(ACEEE). The modeling approach starts with the
10,11
current annual energy efficiency levels achieved by the
operatingreflecting
retirement, costs. that this is not a wholly new
utilities, and captures ten percent of the achievable
approach to utility operations. Table 2-2 shows the
efficiency potential each year, such that these territories
$20 million
plants meeting annual
these cost in criteria.
operating costs
In the and Energy
Cleaner maintenance costs of $10,000 per MW are the criteria
have reached their potential by 2026. Afterwards, these
Plan, these plants are phased out of the generating
chosen to define costly fossil plants. Plants requiring greater
efforts than these
are maintained to levels
ensure of investment
there to
is no backslide
mix between 2018 and 2028, after considering system
remain functional are usually old plants with pollution
reliability. control
throughout thetechnologies
remainder of thethatmodeling
are in need of For
horizon.
more details, please see Appendix C.
upgrades in order to comply with current or upcoming environmental regulations. To continue
2 . 4 H A R N E S S I N G E C O N O M I C A L LY-V I A B L E
Coperating
L E A N E Nplants
E R GYof this kind means high system costs
2 . 4 .that
2 BU are
ILDultimately
I N G C O Dpassed
ES on to ratepayers.
New buildings also present an opportunity to improve
In Cleaner
The the Cleaner Energy
Energy Plan, they
Plan evaluates are retired from the generating fleet, which produces ratepayer
the economic
viability of increased reliance on renewable resources energy performance when building codes are adopted
savings; some of these plants were already
and energy efficiency as compared to the BAU case.
slated for
and retirement,
implemented. reflecting
New that
building this
code is not
standardsa are
wholly
These newenergy
include approach to utility
efficiency, operations.
demand response,Table 2-2 shows
issued on a the plantsthree-year
consistent meeting these cost states
basis. Several
have now passed legislation that updates the state
criteria.
solar In the Cleaner
photovoltaics, Energy
wind (both Plan,
in-state andthese plants are phased out of the generating mix between
out-of-
state projects), and energy storage. A brief summary of building codes when a new standard is issued by the
2018 and 2028, after considering system reliability. national and international authorities (ASHRAE and
the methodology for evaluating each of these resources
to derive an economic potential follows. IECC. Similar actions in North Carolina would improve
Table 2-2 Costly Fossil Plants in the DEP and DEC Generating Fleet
Plant Utility Plant Annual Amortized Total Maintenance
Type Maintenance Environmental Operating Cost
Cost Compliance Cost ($/MW)
Cost
Marshall DEC Steam 38,973,890 35,588,921 74,562,811 19,304
Coal
Belews DEC Steam 35,884,251 33,625,069 69,509,320 16,218
Creek Coal
Roxboro DEP Steam 33,246,288 33,278,126 66,524,414 14,403
Coal
Allen DEC Steam 18,428,679 29,055,468 47,484,147 15,976
Coal
Cliffside DEC Steam 17,914,907 10,255,269 28,170,176 15,031
Coal
Asheville DEP Steam 10,972,135 10,002,147 20,974,282 27,504
Coal
Mayo DEP Steam 13,121,549 7,702,420 20,823,969 20,171
Coal
Table 2-2 Costly Fossil Plants in the DEP and DEC Generating Fleet
7
The Coal Asset Valuation Tool (CAVT) was developed by Synapse Energy Economics. It aggregates data from
A Pathway to a Cleaner Energy Future in North Carolina 12
publically available sources. Environmental compliance costs come from a variety of public sources.new building energy efficiency through technology PVWatts model outputs to observed generation in
and shell improvements, and are generally considered Southeastern contexts. This assumption applies for
cost-effective.12 The energy savings associated with a solar in both utility-scale and distributed generation
code advancement vary. In this case, it is assumed that configurations. Panel technical performance is assumed
there is 2% annual building turnover,13 consistent with to degrade at 0.5% per year while new panel efficiency
national averages. The first code update assumes that improves at 0.25% per year.15
building codes will provide the average savings of the
Distributed solar capacity is deployed in accordance
past two code updates, as assessed by the Department
with the revealed consumer behaviors in North
of Energy. Each subsequent update occurs every three
Carolina. The price elasticity of demand for consumers
years, and is modeled as advancing the code by the
observed over the past several years is used to project
lower savings level of the previous two code updates.
future demand in light of projected declines in total
In total, there are four code updates modeled in this
installed cost for this customer segment.16 In addition,
manner.
a short-lived psychological response to achieving
2.4.3 DEMAND RESPONSE grid-parity, observed in more than a dozen other
Demand response programs currently exist within the states, is incorporated into the modeling of distributed
Duke territory, but do not currently make use of critical generation photovoltaic adoption.
peak pricing and technological approaches that are
Utility-scale solar deployments in North Carolina
now proven leading programmatic designs to establish
have been largely dictated by regulatory and policy
price sensitivity and ensuring smart grid integration as
decisions. Both Duke utilities are expected to add
a power-saving tool. The vast majority of customers
significantly to their solar portfolios to keep track with
served by Duke have been provided advanced metering
the North Carolina Renewable Energy and Energy
infrastructure (more than 90% of residential and
Efficiency Portfolio Standard requirements. However,
commercial customers in both DEC and DEP), but there
instead of stalling after the REPS targets have taken full
are no critical peak pricing programs.14
effect, the Cleaner Energy Plan continues to add to the
Since new technologies must be deployed to take solar portfolios of both utilities, as the recent Daymark
advantage of this potential, the realization of the Energy Advisors study has shown is economic.17 By
savings are phased in over a ten-year period, similar 2028, Duke Energy Carolinas is anticipated to have
to energy efficiency. The cost of direct load control roughly 4 gigawatts of solar capacity integrated onto
technologies and installations are taken from industry their system, while Duke Energy Progress is modeled as
suppliers (such as Cooper Industries) and program achieving 6.7 gigawatts.
and administrative costs reported for other efficiency
Wind
programs by Duke.
The generation characteristics for wind are derived
2 . 4 . 4 E N H A N C E D R E N E WA B L E E N E R GY from the Wind Prospector tool developed by the
P E N E T R AT I O N National Renewable Energy Laboratory (NREL). New
Many types and configurations of renewable energy are wind capacity is modeled both in North Carolina and
modeled to meet electricity demand in North Carolina wheeled in from other states; in North Carolina, wind
in both the Business-As-Usual and the Cleaner Energy generation profiles for northeastern coastal North
Plan. In the Cleaner Energy Plan, solar, wind, and energy Carolina are utilized, while wheeled power profiles are
storage are added to the system above BAU levels taken from Stillwater, Oklahoma, and near Lubbock,
to meet electricity demand in a least-cost fashion, Texas. Current costs for power purchase agreements
albeit with some technical, economic, and regulatory are taken from U.S. DOE’s Wind Technologies Market
restrictions on their deployment. The assumptions Report, while costs for in-state builds are taken from
behind each of these resources and their deployment the 2016 EIA Capital Cost report.18
trajectory follows.
In-state Development
Solar New wind capacity is added to the Duke Energy
The hourly generation of solar sited in North Carolina Progress territory, reviewing NREL estimates of cost-
is determined using the PVWatts model developed by effective coastal locations. While there is a cost-
the National Renewable Energy Laboratory. The lower effective wind resource in western North Carolina,
bound of the generation range produced by the model current regulations limit development prospects and
is used in this study due to experience in comparing amendments to these regulatory barriers are not
A Pathway to a Cleaner Energy Future in North Carolina 13Table 2-3 Duke Energy Carolinas (DEC) Generating Capacity and Reserve Margin under the Cleaner Energy (CE) Plan
2018 2019 2020 2021 2022 2023 2024 2025 2026 2027 2028
BAU – System Total
Capacity (MW)* 22,722 22,735 22,839 22,835 22,857 24,153 24,232 24,126 24,179 25,294 25,292
CE – Avoided Plant 1221 468 1117
and Capacity (MW)
NGCC NGCT Nuclear
CE – Retirement 1,996 1,080 1,080 1,151 571 571
Plant and Capacity
(MW) Belews Belews
Marshall G.G.Allen Cliffside Cliffside
Creek Creek
Unit 1-4 Unit 1-5 5 6
Unit 1 Unit 2
CE – Total Added
Clean Resource
1,565 2,112 2,926 3,532 4,162 4,821 5,510 6,228 6,975 7,689 6,604^
Capacity (MW)**
CE – Total System
Capacity (MW) 20,726 20,739 19,763 18,679 18,701 17,621 17,129 16,555 15,698 15,696 15,694
CE – Total System
Peak Demand (MW) 17,324 16,874 16,158 15,650 15,119 14,559 13,970 13,352 12,706 12,093 13,280
CE – Reserve Margin
19.6% 22.9% 22.3% 19.3% 23.7% 21.0% 22.6% 24.0% 23.6% 29.8% 18.2%
Notes:
* Total system capacity according to DEC Table 2-3
2016 DukeIRPEnergy Carolinas (DEC) Generating Capacity and Reserve Margin under the Cleaner Energy (CE) Plan
* Total system capacity according to DEC 2016 IRP
** Clean energy resources include energy efficiency, distributed and utility scale solar, Clean Line wind, and demand response
** Clean energy resources include energy efficiency, distributed and utility scale solar, Clean Line wind, and demand response
^ The reduction in total added clean resource capacity in 2028 relative to 2027 is due to the change in the timing of peak demand.
^ The reduction in total added clean resource capacity in 2028 relative to 2027 is due to the change in the timing of peak demand. Until 2027, DEC system is expected to experience peak demand
duringUntil
summer2027, DECsolar’s
time, where system is expected
contribution topeak
to meet the experience peak demand
is higher compared to a winter during summer
peaking system. time,
In 2028, DECwhere solar’s
is expected to shift contribution
to winter peaking.to Asmeet
a result,the peak
solar’s is
contribution
higher compared to a winter peaking system. to meetingInthe2028, DECwhich
peak shrinks, is expected to shift
leads to the drop in theto winter
total peaking.
added clean resourceAs a result,
capacity solar’s
as it counts in thecontribution to
reserve margin analysis.
meeting the peak shrinks, which leads to the drop in the total added clean resource capacity as it counts in the reserve margin analysis.
Table 2-4 Duke Energy Progress (DEP) Generating Capacity and Reserve Margin under the Cleaner Energy (CE) Plan
2018 2019 2020 2021 2022 2023 2024 2025 2026 2027 2028 26
BAU – System Total
16,892 16,958 16,359 16,404 16,811 16,825 17,021 17,026 17,499 17,502 17,738
Capacity (MW)*
CE – Avoided Plant and 1221 468 186 468 468
Capacity (MW) NGCC NGCT NGCT NGCT NGCT
380 673 698 711 746
CE – Retirement Plant
and Capacity (MW) Roxboro Roxboro Roxboro Roxboro
Mayo
Unit 1 Unit 2 Unit 3 Unit 4
CE – Total Added Clean
Resource Capacity 872 1,186 1,671 2,009 2,437 2,796 3,168 3,551 3,946 4,085 4,233
(MW)**
CE – Total System
16,512 15,905 14,608 14,653 13,839 13,385 12,684 12,689 12,694 11,951 11,719
Capacity (MW)
CE – Total System Peak
12,361 12,123 11,714 11,453 11,102 10,820 10,526 10,222 9,905 9,845 9,777
Demand (MW)
CE – Reserve Margin 33.6% 31.2% 24.7% 27.9% 24.7% 23.7% 20.5% 24.1% 28.2% 21.4% 19.9%
Notes:
* Total system capacity according to DEP Table20162-4 Duke
IRPEnergy Progress (DEP) Generating Capacity and Reserve Margin under the Cleaner Energy (CE) Plan
**Clean energy resources include energy efficiency, distributed and utility scale solar, coastal wind, Clean * Total system
Linecapacity according toCross
and Southern DEP 2016 IRP
**Clean
wind, energy resources
grid-facing include
battery energy efficiency,
storage, and demand distributed and utility scale solar, coastal wind, Clean Line and Southern Cross wind, grid-facing battery storage, and demand response
response
incorporated into the modeling. New wind in Duke Delivered Wind
Energy Progress is timed to maximize financial benefits, In addition to the capacity available for development
aiming to take advantage of anticipated cost declines within North Carolina, utilities could also procure wind
while still receiving the maximally-beneficial tax resources through transmission projects currently
treatment, targeting developments that break ground in underway, intended to deliver Midwestern wind
the 2018-2019 time frame. resources to the Southeastern United States. In this
case, both utilities are modeled as making significant27
A Pathway to a Cleaner Energy Future in North Carolina 14You can also read