NORDIC GRID DEVELOPMENT PERSPECTIVE 2021 - Statnett
←
→
Page content transcription
If your browser does not render page correctly, please read the page content below
NORDIC GRID DEVELOPMENT PERSPECTIVE 2021
1        2         3         4          5         6         7                                                                                                                                                                                                                                                                      2

CONTENT
Executive summary..................................................................... 3                               4 Focus area studies..................................................................19                     5 Bilateral study updates........................................................ 30
                                                                                                                       4.1 North-South transmission needs................................................19                         5.1 Norway-Sweden..................................................................................30
1 Introduction...............................................................................6                             4.1.1 Future Power Balance Compared to Today............19                                               5.2 Finland-Sweden................................................................................... 32
                                                                                                                           4.1.2 Changing north-south flow patterns                                                                 5.3 Finland-Norway.................................................................................... 33
2 Climate Neutral Nordics Scenario....................................... 7                                                      in the system............................................................................20        5.4 Norway-Denmark................................................................................ 34
2.1 Scenario building................................................................................... 7                 4.1.3 Needs for grid capacity.......................................................21                   5.5 Denmark-Sweden............................................................................... 34
2.2 Storyline of Climate Neutral Nordics........................................ 7                                         4.1.4 P2X’s influence on the need
2.3 Key drivers.................................................................................................8                of north-south capacity.......................................................21                   6 Further work........................................................................... 36
2.4 Scenario assumptions...................................................................... 10                          4.1.5 Summary..................................................................................... 22
    2.4.1 Electricity consumption..................................................... 10                              4.2 Resource Adequacy.......................................................................... 22           7 Annexes.....................................................................................37
    2.4.2 Electricity generation capacity...................................... 10                                         4.2.1 Methods...................................................................................... 22   7.1 Consumption and generation in each country
    2.4.3 Flexibility..................................................................................... 10              4.2.2 Status of the resource adequacy                                                                        for Climate Neutral Nordics scenario......................................37
2.5 Overview of electricity balance and power prices............13                                                               in the Nordics........................................................................... 23       7.2 Status of grid development projects in the Nordics...... 39
    2.5.1 Price levels..................................................................................13                 4.2.3 Status on the resource adequacy by country........ 24                                                  7.2.1 National projects of Nordic significance..................40
2.6 Uncertainties..........................................................................................14          4.3 Offshore Wind...................................................................................... 26       7.2.2 Cross border projects within the Nordic area....... 45
                                                                                                                           4.3.1 Overview of offshore status by country................... 27                                           7.2.3 Interconnectors to continental
3 Identification of System Needs.........................................15                                                4.3.2 Offshore wind requires new methods                                                                           Europe/Great Britain..........................................................46
3.1 Methods....................................................................................................15                and cooperation......................................................................28
3.2 Results.......................................................................................................16       4.3.3 Summary..................................................................................... 29
    3.2.1 Flows..............................................................................................16
    3.2.2 Price differences..................................................................... 17
3.3 Summary...................................................................................................18
1   2     3    4     5    6    7                                                                                                  3

EXECUTIVE SUMMARY
Development towards climate neutral Nordic society induces      scenario assumes the annual Nordic electricity consumption
an unprecedented change in the energy sector. For example,      to increase from the current approximately 400 TWh to 655
consumption in the Nordic power system is growing due to        TWh by 2040. On the other hand, the scenario assumes the
electrification and new types of industry. On the other hand,   renewables generation capacity to more than double from
the amount of renewables is growing at a rapid speed, and       85 GW to 189 GW. The speed of the change in the energy
conventional generation is being phased out. The speed          system is faster than ever.
of the change is showing no signs of slowing, but instead,          The Climate Neutral Nordics scenario also shows that
is continuously increasing. Consequently, the Nordic power      the electricity transfer needs in the Nordic system are
system of 2030 and 2040 will be significantly different         increasing. Furthermore, the existing flow patterns might
compared with the current system. A strong Nordic power         change significantly in the future. As an example, the future
grid is in the core of this system.                             dominant flow direction might be from bidding zone SE2 to
    In this report Energinet, Fingrid, Statnett and             SE1 instead of the opposite. The results of this report indi-
Affärsverket svenska kraftnät (Svenska kraftnät) present        cate that there is a need to reinforce the Nordic grid and
a common perspective on the overall development of the          large investments are needed to increase the grid capacities
Nordic power system. In addition, a more detailed outlook       in several Nordic corridors. In many cases, building new lines
on certain selected focus areas is presented. The analyses      or cables are needed. However, there exists also solutions to
are based on a common Nordic scenario, “Climate Neutral         increase the capacities without traditional grid investments
Nordics” for years 2030 and 2040, created by the Nordic         or solutions for more effective use of the existing transmis-
TSOs. The key findings of the report are summarized below.      sion capacity, e.g. utilizing flexibility. The needs identified
                                                                based on the Climate Neutral Nordics scenario are impor-
Climate neutral society needs more electricity -                tant input to more detailed planning processes.
Significant investments to the grid and cross border
connections are needed
Electricity consumption and production is expected to
increase significantly in the future. Climate Neutral Nordics
1     2    3      4   5   6   7                                                                                                                                                                    4

Photo: Henrik Glette /Statnett

                                                                                     The Nordics are an excellent place for future investments          these resources in the future system. However, conventional
                                                                                     The Nordic electricity system is already a strong system with      generation and especially reservoir hydropower will remain to
                                                                                     good possibilities to connect generation and consumption.          be important resources in the future system.
                                                                                     In addition, the Nordic TSOs are making significant invest-
                                                                                     ments to the power grid to be able to connect the electricity      Future system is more complex and has new
                                                                                     production and consumption required in the climate neutral         characteristics - new solutions and collaboration
                                                                                     society of the future.                                             throughout the whole energy system are needed
                                                                                        This means that there will be a lot of competitively priced     The future system is becoming more complex and different
                                                                                     and green electricity available in the Nordics in the future.      sectors are becoming more interlinked. Furthermore, the
                                                                                     The Climate Neutral Nordics scenario indicates an electricity      future system is expected to contain large amounts of new
                                                                                     surplus in the Nordics in the future, with average power prices    resources and technologies such as offshore wind and P2X.
                                                                                     lower than the prices in continental Europe. This combined         The entire energy system should operate together seam-
                                                                                     with a strong power grid, makes the Nordics a great place for      lessly with the new resources, and this increases the need for
                                                                                     power intensive investments.                                       collaboration between different actors. The grid, consump-
                                                                                                                                                        tion, production, flexibility, and other resources should be
                                                                                     Future system is more volatile - flexibility is needed and         developed together.
                                     Fact Box 1:
                                                                                     will become increasingly profitable                                    In addition, the characteristics of the future system
                                                                                     The analyses shows that the volatility in the future system is     will differ significantly from the current system. The future
                                        Climate Neutral Nordics scenario assumes:    increasing. This applies to all aspects of the power system -      system has high amounts of converters, lower inertia, and
                                                                                     flows, balances, prices, adequacy questions, etc. As volatility    high and volatile transfer needs. New solutions are needed to
                                        • Nordic yearly electricity consumption to   increases, so does the need for flexibility throughout the         tackle these challenges in an optimal way. These challenges
                                          grow from current 400 TWh to 530 TWh       whole power system. Furthermore, the energy transition and         and solutions are discussed more thoroughly in the Nordic
                                          (33%) by 2030 and 655 TWh (65%) by         electrification increase the need for flexibility.                 Solutions1 report that will be published in 2022.
                                          2040.                                         Available flexibility helps in optimal development and
                                        • Nordic renewable energy sources capacity   operation of the future system. Flexibility resources, such
                                          to increase from current 85 GW to 145 GW   as demand-side response (DSR), power-to-X (P2X), storage,
                                          (70%) by 2030 and 189 GW (122%)            and electric vehicles will become increasingly important to
                                          by 2040.                                   even out the variations in the system and are needed to
                                                                                                                                                        Previous Solutions report can be found here: https://www.fingrid.fi/globalassets/
                                                                                                                                                        1
                                                                                     reduce the volatility. Due to higher variation in the power        dokumentit/fi/tiedotteet/sahkomarkkinat/2020/solutions-report-2020-3-april-2020-
                                                                                     prices, it is expected that there are profitable ways to operate   updated-figure.pdf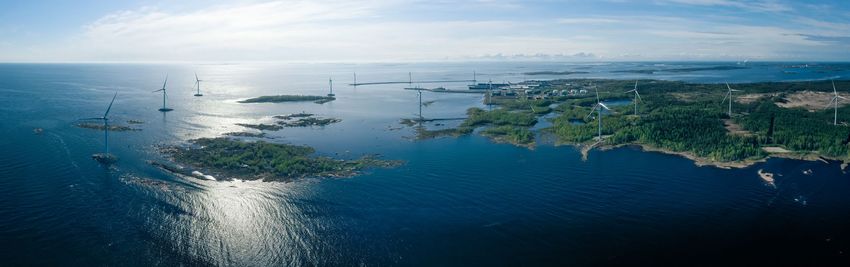
1 2 3 4 5 6 7 5
Regional grid plans and studies will be updated and Fact Box 2:
developed
The Nordic Grid Development Perspective (NGDP) will be
updated every second year and constitutes only one of many The Nordic TSOs are making significant investments 4. Svenska kraftnät is building 800 km of lines,
different regional grid development initiatives. The next to increase the future grid capacities during the 20–30 new substations and making total invest-
NGDP report is planned to be published in 2023. The Nordic ten-year period: ments worth approximately 8.1 billion euros (2021
TSOs are also preparing a common Nordic strategy which value).
will be published in the Solutions report of 2022. In addi- 1. Energinet is building approximately 3,000 km
tion to system planning aspects, the strategy will provide a of cables/lines, 8 new substations and making 5. In total, the Nordic TSOs are building over
broader view including markets and system operation. More- total investments worth approximately 7.8 billion 10,000 km of lines, over 100 new substations and
over, the Nordic TSOs have identified the need of devel- euros (2021 value, values are not including making total investments worth around 25 billion
oping mid-term collaboration both in operational and plan- Energy Islands). euros (2021 value).
ning aspects to complement the long-term collaboration.
In the European context, ENTSO-E is publishing the 2. Fingrid is building 3,700 km of lines, 41 new All TSOs are also planning to reinvest in several
European Ten-Year Network Development Plan (TYNDP) substations and making total investments worth substations and lines, make equipment upgrades, etc.
every second year. A regional Baltic Sea investment plan is approximately 2.1 billion euros (2021 value). These costs are also included in the total investment
published as a part of the TYNDP. costs.
Furthermore, each TSO is continuously updating their 3. Statnett is building 2,500–4,000 km of lines,
national grid development plans and publishing long term 30–35 new substations and making total invest-
market and grid analyses. These reports focus more closely ments worth approximately 6–10 billion euros
on the national aspects. (2021 value).
It is also important that the Nordic planning and collab-
oration processes are transparent and that stakeholders are
involved at an early stage. Thus, involvement of stakeholders
through workshops and consultations will continue to be an
important part of the Nordic grid planning and other forms
of collaboration.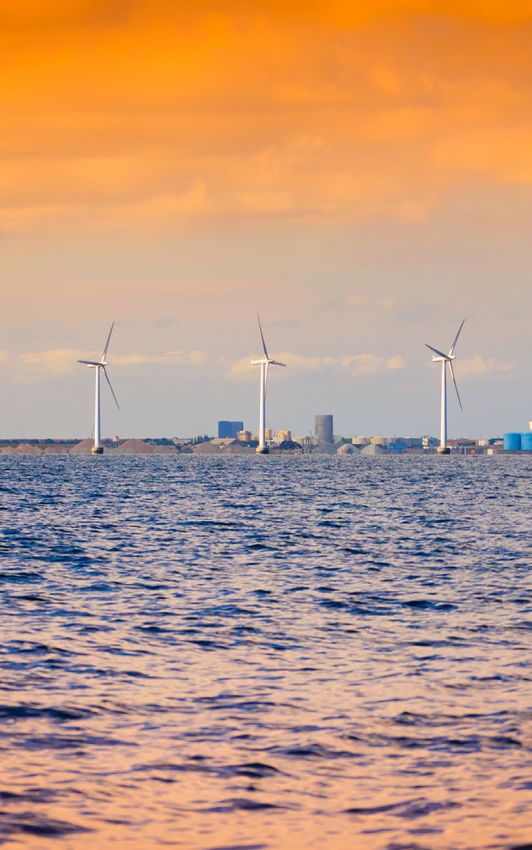
1   Introduction      2     3    4     5     6    7                                                                                                                                                                  6

     1                          INTRODUCTION
The Nordic countries have a long-term history of cooper-           future system needs. Furthermore, the report presents a           tion, etc). These aspects have been recognized by the Nordic
ation in energy matters. The Nordic electricity system is          Nordic view on selected focus areas: offshore wind, north-        TSOs, but they are not the main focus of this report. There
highly interconnected, and the countries are frontrunners for      south power transfer and resource adequacy in the future          are several other Nordic reports available where different
example in renewables and sector-coupling. This creates an         system. In addition, the report updates the status of the five    topics are considered, such as: Nordic Solutions Reports5,
excellent platform to address the new challenges together –        Nordic corridors of interest from the bilateral analyses from     Challenges and Opportunities for the Nordic Power System
for example in the form of the NGDP2021 report.                    NGDP20193 (FI-NO, FI-SE, NO-SE, DK-SE, DK-NO).                    Reports6, etc. Furthermore, the Nordic TSOs are currently
    The NGDP20212 is intended to function as a complemen-             An important part of the NGDP2021 work has been to             preparing a common Nordic strategy on sector integration
tary bridge between the national planning processes and the        prepare a common Nordic scenario for the years 2030 and           and wind power development which will be published in the
ENTSO-E Ten Year Network Development Plan (TYNDP).                 2040. The scenario Climate Neutral Nordics presents a path        Solutions report of 2022. Where the NGDP is focused on
Where TYNDP presents a high-level plan for the entire Euro-        towards decarbonization of the Nordic society, and it is based    system planning related aspects, the strategy will provide a
pean grid and national plans focus more on local aspects in        on national scenarios and ENTSO-E’s TYNDP2020 scenario            broader view including also markets and system operation.
grid development, NGDP2021 presents a perspective for              Distributed Energy. The Climate Neutral Nordics scenario was
the Nordic energy system and highlights key focus areas            also consulted with stakeholders4 and updated based on the
                                                                                                                                     2
                                                                                                                                       The Nordic electricity Transmission System Operators (TSO), Energinet, Fingrid,
that are relevant especially for the Nordic region. It is impor-   received feedback. The created scenario is not identical to all   Statnett and Svenska kraftnät publish a common grid development report (NGDP) every
tant to recognize that NGDP2021 presents an early-stage            national TSO scenarios used for grid planning but will function   second year, on request by the Nordic Council of Ministers. The aim of the NGDP2021 is
                                                                                                                                     to present a common Nordic view on selected key topics rather than presenting a tech-
vision, and more detailed national or joint Nordic analyses are    as an important input to national planning processes. Most of     nical grid development plan in purely traditional sense. Thus, NGDP2021 is named Nordic
required before actual investment decisions are made. Thus,        the analyses of the NGDP report are based on the Climate          Grid Development Perspective (previously Plan).
                                                                                                                                     3
                                                                                                                                       The previous NGDP can be found here: https://www.fingrid.fi/globalassets/dokumentit/
NGDP2021 is from this year called a perspective rather than a      Neutral Nordics scenario.                                         fi/tiedotteet/lehdistotiedotteet/stet0126_nordic_grid_dp_2019.pdf
plan to underline that this report is more exploring the future       The Nordic TSOs are constantly collaborating to enable         4
                                                                                                                                       https://www.fingrid.fi/en/pages/news/news/2021/feedback-on-the-climate-neutral-nor-
                                                                                                                                     dics-scenario/
rather than presenting a firm traditional investment plan.         the clean energy system of the future and solve related chal-     5
                                                                                                                                       Latest Solutions report: https://www.fingrid.fi/globalassets/dokumentit/fi/tiedotteet/
    The NGDP2021 report communicates a common Nordic               lenges. There are also various other future challenges, which     sahkomarkkinat/2020/solutions-report-2020-3-april-2020-updated-figure.pdf
                                                                                                                                     6
                                                                                                                                       Latest Challenges and Opportunities for the Nordic Power System report:
view on the development of the future power system in              the NGDP2021 report is not aiming to analyse (i.e. reduced        https://www.fingrid.fi/globalassets/dokumentit/fi/yhtio/tki-toiminta/report-
the climate neutral Nordic society and investigates the            inertia, increasing dominance of converter connected genera-      challenges-and-opportunities-for-the-nordic-power-system.pdf
1    2   Climate Neutral Nordics scenario           3    4     5   6     7                                                                                                                                          7

    2                          CLIMATE NEUTRAL
                               NORDICS SCENARIO
All Nordic countries have ambitious climate targets. Electri-      2.1 Scenario building                                              2.2 Storyline of Climate Neutral Nordics
fication of different sectors, such as industry, transportation    This scenario has been developed in the collaboration with         The scenario Climate Neutral Nordics delivers on the ambi-
and heating, is seen as the main tool to reduce emissions and      all the Nordic TSOs. For the scenario, the four Nordic TSOs        tion of decarbonisation of the Nordic region. The scenario is
achieve climate targets. This extensive electrification calls      have agreed on generation capacities and annual demand.            based on national scenarios from the Nordic TSOs fulfilling
also for new clean electricity generation.                         The analyses have then been run in each TSOs own market            the goal for decarbonisation in 2030–2050 and opens up a
    By design, the scenario is ambitious with high electrifica-    simulation tool. This means not only that different software       role for the Nordics of being a net exporter of green prod-
tion rates and thus rather high electricity demand in 2040.        and modelling setup has been used, but also that each TSO          ucts such as electricity, steel, and to some extent hydrogen.
At the same time the grid is represented by the current            has been using its own set of detailed data such as seasonal           The Climate Neutral Nordics focuses on high direct and
national ten-year grid plans and has not been expanded             profiles, assumed availabilities, etc.                             indirect electrification throughout the energy systems. With
further even if the scenario might indicate that to be bene-           Despite these differences, the results are rather well         the increased electrification a large increase in electricity
ficial. The purpose of this is that the scenario shall highlight   aligned, which indicates a robustness of the modelling.            consumption is assumed, mainly from new consumption like
potential system needs in a future power system with high          Furthermore, given the large uncertainties in a scenario           electric vehicles (EVs), industry, heat pumps and P2X. In
electrification and demand and large volumes of renew-             looking 20 years into the future, it will not add much certainty   order to facilitate this electrification of the Nordic region,
able generation. Investigation of system needs is further          to the final result to harmonize every single bit of data in the   large amounts of renewable power production need to be
discussed in Chapter 3.                                            models and tools.                                                  built throughout the region, primarily wind, onshore and
    The common Nordic scenario is not a forecast, nor                  The Nordic scenario was presented in a stakeholder             offshore and to a smaller extent photovoltaic (PV).
a prediction of the future. As a scenario it presents one          webinar and a public consultation period was also included
potential development path of many, for the Nordic power           in the scenario building process. Certain changes were made        7
                                                                                                                                       https://www.fingrid.fi/en/pages/news/news/2021/feedback-on-the-climate-neutral-nor-
system.                                                            based on the received stakeholder feedback7.                       dics-scenario/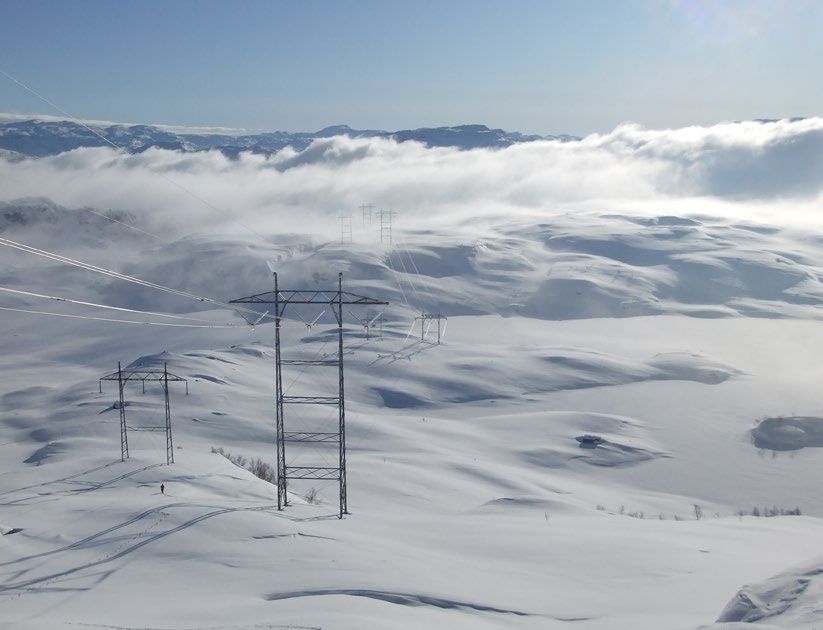
1    2   Climate Neutral Nordics scenario          3     4    5   6       7                                                                                                                                                 8

    The Climate Neutral Nordics will seek to benefit from the     Table 1 – Drivers of the Climate Neutral Nordics scenario
large onshore wind resources available in the northern regions
                                                                                                                                                        Finland                 Sweden             Denmark                 Norway
as well as offshore potentials in the North Sea and Baltic
Sea. The flexibility from hydro reservoirs in the Nordics and     Decarbonisation year (power sector/society)                                     2035/2035                  2040/2045          2030/2050              2040/2050
new types of demand-side response like P2X and batteries          Hydroelectric power                                                                           ≈                      ≈                  ≈                      +
from EVs will benefit the electricity system and help balance     Onshore wind power                                                                         +++                    +++                   +                      +
production and demand when generation from renewable              Offshore wind power                                                                       +(+)                      ++                +++                     ++
energy sources (RES) are extraordinarily high or low.             Photovoltaics
                                                                  and energy storage                                                                            +                     ++                 ++                      +
2.3 Key drivers                                                   Nuclear power                                                                                 ≈                   ≈ (-)               n/a                     n/a
The key drivers for the scenario are to a large extent the same   Other thermal power                                                                            -                      -                 -                       -
as in the previous version of the NGDP, but with a few clear
                                                                  Electricity consumption                                                                    +++                    +++                 +++                     +++
changes. First, projections for future demand are showing
                                                                  P2X                                                                                        +++                    +++                 +++                      +
higher and higher numbers, partly driven by electrolysers for
                                                                  Demand-side response (excluding P2X)                                                          +                      +                  +                      +
production of green hydrogen. Second, the levelized cost of
electricity (LCOE) of RES continue to fall thus enabling an       Electricity balance                                                          2020: Import            2020: High export     2020: Balanced 2020: Moderate export
increasing amount of installed capacity that can meet the                                                                                    2040: Balanced             2040: Low export       2040: Export 2040: Moderate export
increasing demand. Finally, the Swedish nuclear reactors are      + increase, - decrease, ≈ remain at similar level. The drivers show the development compared to today
not assumed to all be decommissioned before 2040. The             and are not directly comparable between countries.
key drivers, and the assumed rate of change over time, are
presented beneath and are summarized in Table 1.
                                                                  Decarbonisation year of the society                                                                the form of additional small hydro plants and to some extent
                                                                  All the Nordic countries are aiming to reach climate neutrality                                    because of increased inflow due to climate change. In Finland
                                                                  of the society in the coming decades. However, the decarbon-                                       and Sweden, however, it is assumed that no more large-scale
                                                                  isation year can vary between sector and society as a whole. In                                    hydro can be developed, and generation capacity is thus flat
                                                                  addition, EU is expected to become climate neutral by 2050.                                        over the scenario period.
                                                                                                                                                                        The hydropower is the main provider of flexibility in the
                                                                  Hydroelectric power                                                                                power system of today, and its importance will be even
                                                                  Norwegian annual hydropower generation is expected to                                              greater in a future system with much larger volumes of inter-
                                                                  grow somewhat during the next two decades, primarily in                                            mittent generation.
1   2   Climate Neutral Nordics scenario         3     4    5   6     7                                                                                                                    9

Onshore wind power                                              are currently no plans for new reactors, although there are       P2X
Onshore wind continues to expand in Finland and Sweden,         discussions about potential lifetime extension of the reac-       Electricity consumption is also assumed to increase due to
although for Sweden the growth rate might be declining.         tors currently in operation.                                      production of hydrogen. Hydrogen has during the few last
Onshore wind is the cheapest source of new green capacity                                                                         years become a potential key element in the transition
in the Nordics, and is already competitive without subsidies.   Other thermal power                                               towards a climate neutral society. The increased use of green
In Denmark and Norway, the growth of onshore wind is            Thermal power, other than nuclear, is assumed to be reduced       hydrogen is assumed in heavy transport, including air traffic,
assumed to be very low, due to a rather strong public resist-   as wind and solar power grows. The increasing prices of emis-     in replacing natural gas in existing gas grids, and as a result
ance towards onshore wind.                                      sion rights and CO2 are also contributing to the decommis-        of electrification of industrial processes.
                                                                sioning of fossil-fuelled plants. The remaining plants will run
Offshore wind power                                             on biofuel or waste. Some of the Combined Heat and Power          Demand-side response (excluding P2X)
The LCOE of bottom-fixed offshore wind power is contin-         (CHP) plants providing district heating may also change to        Following the growing volumes of intermittent generation,
uously decreasing and offshore wind is becoming commer-         heat only.                                                        it is assumed that the increasing price volatility will make
cially competitive. The Nordic countries have all somewhat                                                                        DSR services more profitable. These resources are mainly
different approaches to this, for instance regarding grid       Electricity consumption                                           expected from EVs and industry and they are expected to
connection costs, but they all see a potential for a high       The EV share of new cars is continuously increasing as a          be important resources in the future system.
growth of offshore wind. The status of offshore wind in the     result of development in several areas; cheaper and better
different countries is described in Chapter 4.3.                batteries enable longer range, the infrastructure of charging
                                                                points is improving, and there are political ambitions to
Photovoltaic                                                    phase out fossil fuels. Alternatively heavy transports can also
Photovoltaics is expected to grow in all Nordic countries,      be fuelled by green gas (methane or hydrogen) which would
but with a slower rate compared to wind farms. The future       then require even larger volumes of electric energy.
capacity is assumed to be both roof top installations and          The Nordic region continues to be an attractive area
commercial sites.                                               for location of data centres, due to good infrastructure and
                                                                cheap, clean and reliable electricity supply. The demand for
Nuclear power                                                   new data centres is driven by the increasing digitalization,
Nuclear power is assumed to remain fairly stable during the     e.g. cloud services, Internet of Things (IoT), 5G telecom, etc.
scenario. Finland sees the commissioning of Olkiluoto 3 and        Both direct and indirect electrification of existing
Hanhikivi powerplants, while Loviisa plants are assumed to      industry processes is also expected to take place in the
be decommissioned. In Sweden, Forsmark 1, the oldest of         future. This will have a significant effect on the electricity
the six reactors is assumed to be decommissioned and there      consumption.
1 2 Climate Neutral Nordics scenario 3 4 5 6 7 10
2.4 Scenario assumptions Figure 1 – Development 700
The development towards a decarbonized Nordic region of Nordic electricity 34
consumption from 2020 600 23
involves large changes in the Nordic power system, related 51
to how electricity is produced, distributed and consumed. to 2040 in Climate Neutral 26 17
500
Nordics scenario. 22 108
The scenario assumptions are presented below. 26
400 25 35
Other consumption
TWh
2.4.1 Electricity consumption
Electricity consumption is assumed to increase from around Heat pumps 300 131 185 179
400 in 2020 to around 655 TWh in 2040, i.e. by approxi- Transport
200
mately 65 per cent. This development is illustrated in Figure 1. Hydrogen/P2X
The development of the general consumption, which Datacentres 100 231 226 224
consists of residential and service sector consumption, is
Industry
slightly decreasing towards 2040 by 8 TWh. 0
Hydrogen production/P2X accounts for the largest part General consumption 2020 2030 2040
of the development as it increases from 0 in 2020 to 108
TWh in 2040. Thereafter, electrification of existing and new
industry, and direct electrification of transport have the 2.4.2 Electricity generation capacity nuclear in the long run, which is decreasing by 1 GW.
largest impact respectively increasing by 49 and 48 TWh8. Development of generation capacity in each country is
Data centres’ consumption increases significantly by 33 Renewable electricity capacity presented in the Appendix 7.1.
TWh. Heat pump consumption is increasing by 14 TWh and The total capacity of renewable generation is increasing
other consumption increases from 21 to 34 TWh, which is from around 85 GW in 2020 to around 190 GW in 2040, 2.4.3 Flexibility
mainly due to an increase in grid losses, which is included i.e. by approximately 122 per cent. The increase in renewable High growth in consumption as well as a higher share of
in the category (grid losses might be lower that this after generation is primarily due to changes in wind and PV. The intermittent production increases the need for flexibility.
investment to new capacity). development is illustrated in Figure 2. Reservoir hydropower is an important source of flexibility
Development of consumption in each country is in the Nordics today and will play an increasing important
presented in the Appendix 7.1. Thermal capacity role in the future. Hydrogen is expected to emerge as a
The total capacity of thermal is assumed to decrease from 17 central, new source of flexibility, as well as a higher degree
GW in 2020 to 14 GW in 2040, i.e. by approximately 22 per of consumption flexibility both in existing and new consump-
cent. The development is illustrated in Figure 3. tion. In addition, the power transmission grid will continue
The decrease is mainly due to fossil fuels being phased to be an important enabler for the exchange of sources of
8
There is no hydrogen production included in the industry category. It is all included in
the hydrogen production/P2X category. out, but there is also a small decrease in the capacity of flexibility between regions.1 2 Climate Neutral Nordics scenario 3 4 5 6 7 11
Figure 2 – Development 200
Reservoir hydropower
of Nordic renewable 8 Reservoir hydropower constitutes a high share of the Nordic
electricity capacity from power generation mix. As the share of intermittent power
36
2020 to 2040 in Climate 150 generation increases, and before other sources of flexibility
10
Neutral Nordics scenario. have fully developed, reservoir hydropower will be the central
19 35
source of flexibility. Reservoir hydropower has an advantage in
GW
Bio fuels 17
100 being able to rapidly adjust the production at low cost, as well
PV 9 2 as being a seasonal storage. However, the existing reservoir
2 43 52
Offshore wind 20 hydropower system is not an abundant source of flexibility
Onshore wind 50 due to restrictions in storage capacity, installed capacity, as
Hydro 58
well as operational restrictions.
52 57
The generation capacity is expected to increase, in
0 particular through reinvestments in existing hydropower
2020 2030 2040 plant, but also through some new investments. Pumped
hydropower might become profitable as well, with increased
price volatility in the future, however large-scale pumped
Figure 3 – Development 20 hydropower is not considered in this scenario. In the long-
of Nordic thermal capacity term other sources of storage like hydrogen and batteries in
from 2020 to 2040 in EVs could compete with the storage in hydropower.
Climate Neutral Nordics 15 6
5
scenario. Demand flexibility
2 The potential for consumption flexibility in the Nordics is
1 1
Fossil
GW
10 1 high, but the volume is uncertain, as there are no extensive
Waste historical data or standardized models available. However,
Nuclear as the price variation increases towards 2030 and onwards,
11 11 10
5 the profitability in and incentives for avoiding high power
prices is expected to increase, compared with today.
Thus, the scenario assumes an increase in relatively cheap
0 demand flexibility from EVs, as smart charging features will
2020 2030 2040 enable adjustments according to the power price. Also, new1 2 Climate Neutral Nordics scenario 3 4 5 6 7 12
consumption from industry is assumed to be increasingly Figure 4 – Electrolyser capacity in the Climate Neutral the production will be most competitive when focused on
flexible. These industries include for instance P2X, as well as Nordics scenario. the periods where power prices are low due to excess renew-
other industries such as data centres, etc. GW able power production.
14 Production of hydrogen for the industry is also assumed
Hydrogen 13 to be flexible to some extent, but less so than hydrogen
Hydrogen is an enabler for the green transition in many 12 production for a hydrogen market. These units are modelled
sectors, and in the power system it provides flexibility in 10 with a storage of 2–3 days of supply, which enables that
multiple ways. The production of hydrogen from electricity production of hydrogen is optimized dependent on the elec-
is a source of low-price flexibility, while hydrogen as a fuel, 8 tricity prices and storage level.
can be viewed as a source of high-price flexibility when used 6 6 There is high uncertainty related to how the hydrogen
in power plants9. Hydrogen also serves as an energy storage, market will develop in general and in the Nordics. The cost
4
either stored directly as hydrogen, in the form of ammonia or 4 of electrolyses and storage, as well as the development of
3
as carbon-based synthetic fuels. renewables and infrastructure for hydrogen are key uncer-
2
Provided that affordable hydrogen storage or transmis- 1 1 tainties. The demand for hydrogen from the Nordic industry
0.4 0.4
sion infrastructure is available, the production of hydrogen 0 is assumed to be met by hydrogen production units in the
is relatively flexible and may be focused in the hours of large Denmark Norway Sweden Finland Nordic region, in the Climate Neutral Nordics scenario.
production from solar and wind, avoiding hours with high Large-scale hydrogen production to a hydrogen market that
2030 2040
electricity prices. In the coming years hydrogen is assumed is interconnected by hydrogen pipelines is not modelled
to be most relevant as a source of low-price flexibility in explicitly in the scenario. However, if the future shows
the Nordics, as there will be increasing need to produce in an industry will, to a lesser extent be price flexible, than availability of a hydrogen export grid, the location of such
hydrogen to decarbonize the industry and other hard-to- production of hydrogen for a hydrogen market. That is grid-connected units would be dependent both on market
abate sectors. However, this requires that the production because an interconnected market will likely facilitate other, dynamics in the new hydrogen market and the access to
costs of green hydrogen become competitive with blue and more competitive options for e.g. hydrogen storage and infrastructure.
grey hydrogen10. The potential for hydrogen as a source of trade than relying only on local storage at an industrial site.
high-price flexibility is assumed to be more limited due to The two types of hydrogen production are modelled
the high share of reservoir hydropower in the Nordics. separately. Production of hydrogen to a hydrogen market is 9
Low-price flexibility has low costs related to adjusting and is active on low power prices.
High-price flexibility has higher costs and is active on higher power prices.
To what extent the production of hydrogen in the power modelled as price flexible consumption, with cut-out prices 10
Green hydrogen is produced by using zero-carbon electricity – such as that generated
system will be flexible, depends on the access to infrastruc- for production at 40–60 €/MWh in 2030 and 30–45 €/ by wind turbines or solar panels – to split water into hydrogen and oxygen. The process
is carbon-neutral. Blue hydrogen is produced from natural gas through steam methane
ture for transport, the storage options and the end-use of MWh in 2040, resulting in a hydrogen price of approximately reforming with carbon capture and storage (CCS). Grey hydrogen is produced from
hydrogen. Production of hydrogen for direct use on-site 2–3 €/kg in 2030 and 1.5–2.5 €/kg in 2040. This because natural gas through steam methane reforming without CCS.1 2 Climate Neutral Nordics scenario 3 4 5 6 7 13
Power transmission grid Figure 5 – Nordic electricity balance in the Climate Figure 6 – Price duration curves in the Climate Neutral
The extensive transmission grid within the Nordics and to the Neutral Nordics scenario. Nordics scenario in SE3 and Germany. (The y-axis has
continental Europe has an important role in evening out vari- been cut off at 200 EUR/MWh)
ation between regions, through the exchange of production 800 200
resources and other sources of flexibility. The transmission
grid and trade are important to tackle local, short-term vari-
600 150
ation as well as seasonal variations. The transmission grid in
EUR/MWh
TWh/year
the scenario is represented by the current national ten-year
grid plans and has not been expanded further. This due to 400 100
the purpose of the scenario; to highlight the potential system
needs in a future power system. 200 50
35 53
13
2.5 Overview of electricity balance 0 0
and power prices 2020 2030 2040 0% 20% 40% 60% 80% 100%
The Nordics will have a positive electricity balance in all
analysed years i.e. annual total consumption is less than the SE3 2030
Consumption
annual total generation of electricity. Thus, the Nordics will
Production SE3 2040
remain a net exporter of electricity.
The power surplus is increasing through 2030 and Electricity balance Germany 2030
towards 2040, as the production in the region increases at Germany 2040
a somewhat higher pace than the consumption. The rather
large power surplus in 2040 of about 50 TWh in the Nordics,
will likely serve to attract more consumption. This, as it is 2.5.1 Price levels The simulated German power prices are based on the
expected that the market development is balanced in the Figure 6 presents the simulated price duration curves for ENTSO-E Distributed Energy Scenario, with an annual
long run, as a power surplus attracts more consumption, and electricity from the Climate Neutral Nordics scenario in the average power price between 40 and 50 EUR/MWh in 2030
a power deficit attracts more production. Nordic SE3 bidding zone as well as the German price dura- and 2040. Also, the price duration curve indicates a substan-
As the generation becomes more variable and weather tion curves. The SE3 price can be considered generally as a tial amount of power prices at 0 €/MWh. In a dynamic setting
dependent, the challenges of maintaining the instanta- proxy for the Nordic price levels. However, it should be noted this would lead to increased consumption from flexible
neous power margin will increase. More detailed analysis on that price differences and significant volatility are expected demand that can focus their demand on low price hours, such
resource adequacy is presented in Chapter 4.2 between the different Nordic bidding zones in the future. as P2X. This will in turn increase the prices in these hours.1 2 Climate Neutral Nordics scenario 3 4 5 6 7 14
In the Nordics, the annual average power prices are 2.6 Uncertainties
ranged between 20 and 30 EUR/MWh in 2030 and 2040, There are various uncertainties related to the assumptions
in the Climate Neutral Nordics scenario. However, the of the Climate Neutral Nordics scenario. The uncertainties
prices vary over a much larger range as the price volatility may, in certain cases, have a significant effect on the simu-
increases due to higher share of renewables combined with lation and analysis results. For example, the following uncer-
lower thermal and nuclear capacities. This gives a substan- tainties should be considered when interpreting the results
tial amount of close-to-zero prices both in 2030 and 2040, of the scenario work:
and a number of hours with extremely high prices, especially • Fuel and CO2 prices
in 2040. The Nordic average price levels decrease towards • Development of P2X, both capacities and how they are
2040 compared with 2030, due to the more integration of operated
wind and photovoltaics. • Development of electricity consumption
Compared to the German price level, the Nordic average • Availability of flexible consumption and generation
price level is expected to be somewhat lower (roughly half), • Role of batteries and other types of storage in the
due to an expected power electricity surplus in the Nordic Nordics (EVs, large-scale storage, etc.)
region. This makes the Nordic countries a competitive • Development of wind power capacity, especially offshore
option for power intensive industrial and P2X investments in wind, and offshore grids, and new connection types such
the future. In turn, this might lead to even higher consump- as energy islands
tion than assumed in the Climate Neutral Nordics scenario, • Phase-out of nuclear production
and hence, reduce the price differences between the Nordic • Uncertainties related to building the necessary infra-
region and the continent. structure: overhead lines, HVDC connections, etc.
It should be noted that there are various uncertainties In addition to these aspects, various other factors may
related to the assumptions, and thus, the simulated price increase the uncertainty related to scenario modelling and
levels of the Climate Neutral Nordics scenario. The next analysis results. The Climate Neutral Nordics scenario is
chapter presents the uncertainties more in detail. showing one way of how the future Nordic energy system
might develop. Given the ambitious targets for decarboni-
sation in the Nordics, the Climate Neutral Nordic scenario is
the common “best guess” for a very ambitious decarbonisa-
tion scenario to illustrate the future challenges and possibil-
ities for the Nordic system.1 2 3 Identification of System Needs 4 5 6 7 15
3 IDENTIFICATION
OF SYSTEM NEEDS
This chapter presents an analysis which seeks to identify the rather whether there exists a marginal benefit for increasing the
need for increased grid capacity between the existing bidding grid capacity on each of the bidding zone borders independently.
zones in the Nordic region, by using a simple metric. The Further, the analysis does not consider the costs of increased
analysis was carried out using the Climate Neutral Nordics grid capacity, hence no cost-benefit analyses (CBAs) has been
scenario, for the years 2030 and 2040. More detailed performed. The analysis also excludes other benefits of increased
analysis on selected transmission corridors is presented in grid capacity, for instance related to renewables integration,
Chapter 5. security of supply, or improved functioning of reserve markets.
As this report is a perspective rather than an investment The modelled grid in the scenario consists of the current
plan, the results shown in this chapter should be considered grid and each TSOs national ten-year development plans11
as preliminary starting points for future studies for grid including expected decommissions of interconnectors
investments. Before actual investment decisions can be reaching their end of life. No additional lines or interconnec-
made, more detailed studies must be carried out. tors have been added in the scenario-building process.
Furthermore, it is important to note that the direction of
3.1 Methods the price difference may vary from hour to hour, and calcula-
The analysis has used the absolute hour-by-hour price differ- tion of absolute hour-by-hour price difference disregards the
ence as a metric for the economic benefit of increased grid direction. Benefit for the interconnector exists regardless of
capacity between the existing bidding zones in the Nordic which zone has the lower price, making absolute price differ-
region. This metric is used as it reflects the marginal benefit ence a good metric for the benefits.
of increased grid capacity between two bidding zones, that 11
Statnett’s Grid Development Plan from 2019 was included in the reference grid in this
is, the benefit of increasing the grid capacity by 1 MW. analysis. The planned investments in the Grid Development Plan of 2021 will serve to
further increase the north-south capacity. See also the appendix for the planned invest-
This study does not consider what an optimal capacity ments of Nordic interest and Statnett’s Grid Development Plan for 2021:
between bidding zones would be in the NGDP scenario, but https://www.statnett.no/en/about-statnett/news-and-press-releases/news-archive-2021/
grid-development-plan-for-the-green-change-of-pace/1 2 3 Identification of System Needs 4 5 6 7 16
3.2 Results Figure 7 – Electricity Balance (TWh) in the Nordic bidding zones in 2030 and 2040 from the Climate Neutral Nordics
scenario. The values for 2020 are historical values.
3.2.1 Flows
In general, the power will flow from areas of electricity surplus 2020 2030 2040
to areas of electricity deficit. Figure 7 shows the electricity 2020: Realized
balance in the Nordic bidding zones. The northern part12 of annual electricity +5 +6 +4
the Nordics is a large surplus area as it stands for about 30 balance (source
per cent of the annual Nordic power production today and Nordpool) +13 +4 -15
only 15 per cent of the annual consumption. The western
part of Norway also has a considerable power surplus. Most
of the consumption is in the southern part of the Nordics13. +37
-15
+1 +50
-2
+1 +53
-5
-2
Hence, the main flow direction in the Nordic power system
today is from the electricity surplus areas in the north, to the +15 +4 +3
-15 -12 -20
electricity deficit areas in the south, and further on towards
the continent. To a smaller extent, the power also flows in +17 -10 +16 -15 +20 -14
the west-east direction in the Nordics. The power flows
today and in 2040 in the Climate Neutral Nordics scenario -1 -16 +15 -4 +22 +11
are illustrated in Figure 8. The arrows indicate the net flow -6 +6 -2
direction, and the size of the arrows also indicates the size of
the power flows. Single direction of the arrows indicates that
>75% of the electricity goes in one direction.
12
Northern part refers to bidding zones NO4 (partly), SE1, SE2, northern part of bidding
zone Finland.
13
Southern part refers to SE3, SE4, Southern part of Finland and Denmark.1 2 3 Identification of System Needs 4 5 6 7 17
Figure 8 – Power flows (TWh) in 2020 and in the Towards 2040, a high consumption growth as well as a 3.2.2 Price differences
Climate Neutral Nordics 2040 scenario. high share of intermittent production will affect the flow The absolute hour-by-hour price differences between the
pattern, and the price differences between bidding zones. Nordic bidding zones increases from today to 2030 and to
More consumption is expected to be situated in the northern 2040 in the Climate Neutral Nordics scenario, as illustrated in
2020: Realized market flow parts of the Nordics, especially in the north of Sweden and in Figure 9.
2040: Climate Neutral Nordics Norway. In the Climate Neutral Nordics scenario, the consump- The increase in price differences between 2030 and
tion in the northern part of the Nordics will increase to almost 2040 is an indication of an increased need for grid invest-
25 per cent, up from 15 per cent today, and the production in ments towards 2040. The price differences between bidding
the northern area will not be able to supply all of this. Hence, zones are increasing both due to increased electricity trans-
0–5 TWh the surplus in the north decreases and the annual north-south port, as well as increased variation in production due to a
flow is reduced compared with today. In Finland and Denmark, higher share of intermittent production and less thermal
5–10 TWh the annual flows from north to south will increase substantially capacity, as explained in the previous section. Reduced price
towards 2040. Increased flow between Denmark and the difference between SE2 and SE3 is due to including the
10–25 TWh continent is mainly due to energy islands. planned north-south grid reinforcements up to 2040 in the
The flows will also be increasingly dependent on the reference grid.
production from intermittent production. That is, the In addition, the continental power prices also vary more
25+ TWh
flow pattern may more often be in the opposite direction, towards 2040, due to higher consumption and higher share
SE-DE +
SE-LT + depending on the wind power production. For instance, the of intermittent production. This increases the existing price
* Single direction arrow new electricity consumption in the north will also lead to differences in the Nordics.
SE-PL
if >75% in one direction
the flow going northwards, for instance between SE1 and
Due to energy SE2 and NO3 and NO4, especially in periods with high wind
islands
power production further south in Norway and Sweden.
The Nordic region is also expected to have increased
export and import towards 2030 and 2040, as the inter-
connector capacity towards the continent and the UK
increase, as well as the share of intermittent power produc-
tion. Increased import and export will in general increase the
bottlenecks and thus the hour-by-hour price differences in
the Nordic system, if no investments to grid capacity are
made.
More details on the flows in the Nordic system in Chapter 4.1.1 2 3 Identification of System Needs 4 5 6 7 18
Figure 9 – Average absolute hour-by-hour price differences (in EUR/MWh) in the Climate Neutral Nordics scenario for 3.3 Summary
2030 and 2040, as well as an estimate of the average price differences today, based on prices from 2016 to 2020. The analysis shows that the transmission needs are expected
For Norway, NO1, NO2 and NO5 have been considered as one bidding zone. to increase in the future when the consumption increases,
and large amounts of renewable generation is integrated in
the Nordic power system. Hence, the analysis is indicating
2016– 2030 2040 corridors which should be subject for further analysis and is
9 11* 15*
2020 important input to more detailed studies.
Even though the analysis illustrates large price differ-
4 5 11
ences in many corridors, it does not necessarily mean that
6 5 10
there must be made investments in new grid. Over time
0 1 6
4 7 11 the market dynamics may lead to more equal prices which
2 6 7
will reduce the need for new grid investments. For instance,
6 12
2 8 8 localisation of new consumption and production in line with
2 5 5
the local price signals may lead to smaller price differences
2 4 1 between bidding zones. Also, the higher price variation
4 9 6 9 12
4
which is expected in the Climate Neutral Nordics scenario
will increase the profitability of peak capacity and demand
7 4 2
18 16 1 22 19 4 flexibility, both in power intensive industries and in individual
2 13 14
households. In turn this could reduce the price variations
2 4 4
which would lead to smaller price differences.
In addition to traditional grid investments, there are also
other options for increasing grid capacity for the markets.
* Investment cost (which is not included in the analysis) between Finland and Norway is expected to be high compared to These include for example: dynamic line rating, series
benefit (see Chapter 5 for more information). compensation, static var compensator / static synchronous
compensator devices (SVC/STATCOM), voltage control
solutions, and system protection schemes. The Nordic TSOs
are investing in the most cost-efficient options for increasing
the grid capacity.
For more details on the specific bilateral corridors, see
Chapter 5.1 2 3 4 Focus area studies 5 6 7 19
4 FOCUS AREA STUDIES
4.1 North-south transmission needs The vanishing regional surplus occurs even though the deficit in bidding zone SE1 and increases the need for import
The large consumption growth, balanced with mostly investments are made in onshore wind power in Sweden and on all corridors into northern parts of Sweden by 2040. The
onshore wind power in the north and offshore wind power Finland. The added consumption from these developments right part of Figure 10 illustrate the development in the elec-
in the southern part of Scandinavia, will have major impacts is about 65 TWh for Sweden and Finland in total. tricity balances. Both SE2 and the northern part of Finland
on power flows and bottlenecks in the Nordic power system Even though the region has a positive electricity balance increase the energy surplus towards 2040 whereas SE1 has
compared to today. This chapter analyses the North-South as a whole, consumption growth leads to a large electricity a negative balance of about 15 TWh in 2040.
flows and needed capacity in the future Nordic power
system. The analysis is based on the Climate Neutral Nordics
Figure 10 – Left: yearly electricity 120 60
scenario. 109 53
balances for 2020 and 2040 for the 102
100
area comprising the northern part 40 37
4.1.1 Future power balance compared to today 80
of Norway (NO4), Sweden’s bidding
TWh
In the Climate Neutral Nordics scenario, the power system in 60 57 20 17
zone 1 (SE1) and the northern part 13
the northern part of the Nordics will undergo major changes 36
of Finland (northern part of Finland 40 3
towards year 2040. This is related to both consumption and 0
includes the part of the country north 20 7
production growth. For the region comprising northern parts 22
of the Kemi-Oulujoki cut). Right: 0 -20 -15
of Norway, Sweden and Finland, the consumption growth
yearly electricity balances for 2020 2020 2040
brings the region towards lower electricity balance in 2040 2020 2040 2020 2040 2020 2040
and 2040 for the bidding zones SE1,
compared to the electricity surplus of today. This develop- Consumption
SE2 and northern part of Finland, SE1 SE2 Finland North
ment is shown in the left part of Figure 10. This is mainly due to Production
respectively.
the consumption growth caused by P2X in bidding zone SE1.
Electricity balance1 2 3 4 Focus area studies 5 6 7 20
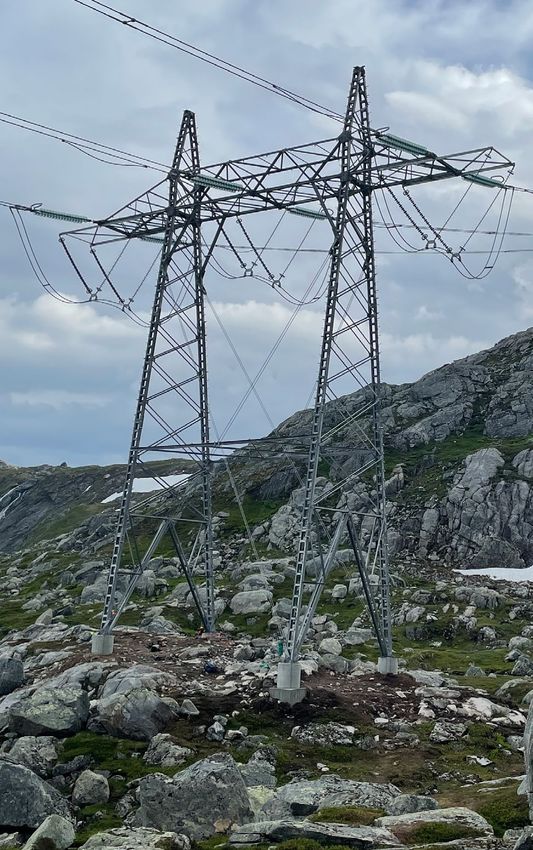
Photo: Statnett
4.1.2 Changing north-south flow patterns in the system Norway is experiencing increasing power flows from the
The changed electricity balances in different parts of the north and central parts of the country to the southern parts.
Nordic system will subject the grid to partially new flow This trend will be reinforced in the next couple of years. After
patterns. An overview of the present and future energy flows 2030 the flows will probably be more bidirectional, even if
can be seen in Figure 8 in Chapter 3.2.1. The flows in the the main direction still will be southwards. The main reason
interconnected Nordic system are at present generally domi- behind this is increased industry consumption in the central-
nated by relatively steady energy flows from the north to the and northern parts of Norway and Sweden, combined with
south, albeit with variations in the flow between regions, years development of more offshore wind and PV in the south.
and seasons. The projected changes to the production and Typically, the flows from south to north can be extensive
consumption of electric energy in the Nordics will cause some in hours with large contribution from solar energy in the
of these flows to increase, decrease and even reverse. Bottle- summer.
necks can therefore become more constraining, alleviated or Sweden will have a deficit of energy in its northernmost
appear in new places. In the following, a per-country overview part (SE1) that will make SE1 a net importer instead of an
is given: exporter. The border between SE1 and SE2 will be heavily
Denmark will experience an increased flow from southern utilized and subject to bidirectional flows, partly due to
Sweden (SE4) to eastern Denmark (DK2). This flow will keep wind power development in northern Sweden and Finland
its current north-south direction. All other flows between and partly due to electrification in SE1. The border between
areas become more bidirectional. The main contributor to SE2 and SE3 will continue to experience large north-south
the bidirectional flows is the increase in offshore wind power flows. Finally, the border between SE3 and SE4 will transfer
in Denmark (especially in DK1, the western bidding zone) less energy on average and become bidirectional. The main
while P2X and electrification in Denmark will drive a higher drivers behind this change is offshore wind power in the
flow from SE4 to DK2. Some of these flows will also extend south of Sweden and increased imports on the HVDC-inter-
through Denmark to the continent via new or existing inter- connectors that connect SE4 to continental Europe.
connectors.
Finland will have a significantly increased north-to-
south energy transfer. Increasing amounts of onshore wind
power generated in northern Finland and increasing elec-
tricity consumption (electrification and P2X) in the south of
Finland drives this change. The cross-border flow to northern
Finland will become more bidirectional due to the electrifica-
tion of heavy industry in northern Sweden (SE1).1 2 3 4 Focus area studies 5 6 7 21
4.1.3 Needs for grid capacity power with necessary new transmission lines will yield higher developments could increase significantly the north-south
As described above, there will be significant changes in socioeconomic welfare than developing offshore wind power transmission needs. However, demand increase in SE1 (e.g.
Nordic demand-supply balance. Due to that development, that might be located closer to power demand but would be fossil-free steel industry) can somewhat balance the situa-
there will be an increasing need for new grid capacity. Rele- more expensive to connect. Fingrid has also been given guid- tion. The onshore wind power in SE2 will need to be trans-
vant issues are presented country-wise in the following: ance by national legislation and customers to keep Finland as mitted to both south (SE3) and north (SE1). Substantial grid
Denmark is in a key position when developing connec- one bidding zone, a target that requires constant develop- investments are planned to reinforce the SE2-SE3 transfer
tions between the Nordic countries and continental Europe. ment of new north-south transmission lines. capacity. Also, some of the offshore wind power will be
Denmark is in the process of expanding both onshore and Norway has a more decentralized power system located close to demand centres in bidding zones SE3 and
offshore renewables connected in the southern and western compared to Sweden and Finland where consumption and SE4, which can help reduce the north-south flows. Due to its
part of the country. Compared to the other Nordic countries production is spread across the whole country. Statnett is location in the middle of the Nordic power system, Sweden
Denmark has a higher population density and a smaller land planning to upgrade all 300 kV lines to modern 420 kV will have a large impact also on other countries. Therefore,
area. Despite this internal grid expansion is still possible, but lines by 2040. This will add capacity in the north-south the development of Swedish transmission grid needs to be
to be able to handle a larger transfer capacity in the Danish direction and help reduce price difference between NO3 taken into account also in other Nordic countries.
grid this need to be combined with HVDC-projects, both and the prices zones in the southern Norway. It will also to
onshore and offshore. Both internally and in the North Sea some degree relieve north-south flows in the Swedish grid. Generally, the increasing wind power will increase need for
and the Baltic Sea new HVDC-projects are being planned to This is also necessary to meet the demand for grid capacity power transmission within and between countries, as there
expand the capacity to the neighbouring countries to handle due to development of large industry units and offshore are always some wind variations between areas. The availa-
these new flows. wind in the southern and western part of Norway. New large bility of hydropower and hydrogen solutions to balance the
Finland will have most of the new onshore wind power industry units can also create demand for new local power wind variations differs between areas. Therefore, there is an
in northern parts of the country, while majority of demand lines due to security of supply. This is especially the case increasing need for common understanding how the power
is expected to stay in southern Finland. That will require in the northern parts with relatively few power lines today transmission grid could and should be developed in each
large investments in north-south transmission lines. Possible combined with very large distances. On a Nordic level this Nordic country.
HVDC connections from southern Finland to Estonia and development combined with more industry and wind power
Sweden will further increase the need for internal grid in Sweden will contribute to more congestion between 4.1.4 P2X’s influence on the need of north-south capacity
investments. Finland is prepared for this situation, the devel- the countries both in north, mid and south. Internal rein- In the Climate Neutral Nordics scenario it is assumed that
opment of power system is monitored and investment plans forcement in the two countries will to a little degree relieve P2X will expand its power consumption to 108 TWh by
are updated frequently. Additionally, Finland has proven congestion between the two countries. 2040. P2X is a technology that is rapidly developing and can
experience on developing new grid and there are available Sweden will face challenges to use mainly wind power be a major contributor to balancing renewable production.
and environmentally acceptable routes for new overhead to satisfy both consumption growth and replace the power By storing and transporting energy, it can both be an alter-
transmission lines. Therefore, developing onshore wind production from decommissioned nuclear units. These native and a complement to electricity. To be able to have aYou can also read