Climate change stressors affecting household food security among Kimandi-Wanyaga smallholder farmers in Murang'a County, Kenya
←
→
Page content transcription
If your browser does not render page correctly, please read the page content below
Open Agriculture 2021; 6: 587–608
Research Article
Mary W. Ngure*, Shem O. Wandiga, Daniel O. Olago, Silas O. Oriaso
Climate change stressors affecting household
food security among Kimandi-Wanyaga
smallholder farmers in Murang’a County, Kenya
https://doi.org/10.1515/opag-2021-0042 temperature changes, and household food security. For
received October 21, 2020; accepted July 27, 2021 robust and strategically designed climate policies and
Abstract: Climate change hazards including droughts programs for food security, governments need to commu-
and floods are adversely affecting crop productivity and nicate to policy makers the perceptions of smallholder
food security among Kenyan smallholder farmers. This farmers involved in autonomous climate adaptation.
article analyzes rainfall and temperature change effects on Keywords: smallholder farmers, crop productivity, indi-
household food security in Kimandi-Wanyaga, in Murang’a genous perceptions, rainfall variability, warmer temperatures
County, Kenya. Both the meteorological and the community
perceptions were analyzed. Monthly rainfall and tempera-
ture data for Thika Meteorological Station were analyzed for
trends using MAKESENS procedure. The community per- 1 Introduction
ceptions data obtained through household survey, key
informant interviews, and focus group discussions were Sustainable agriculture promotes food security under
analyzed using Statistical Package for Social Sciences (SPSS) the sustainable development goal 2 of ending hunger,
and content analysis. The study hypotheses were tested achieving food security, and improving nutrition [1].
using chi-square tests. The community perceived inadequate Food security exists when “all people, at all times, have
rainfall during crop growth (79%), reduced rainfall intensity physical, social and economic access to sufficient, safe,
(77%) and erratic onset and cessation of seasonal rainfall and nutritious food to meet their dietary needs and food
(73%) had interrupted their crop productivity. These dis- preferences and is supported by an environment of ade-
agreed with MAKESENS rainfall trends that showed sta- quate sanitation, health services and care, allowing for a
tistically insignificant rainfall variability (α > 0.1). The healthy and active life” [2]. Our diets and nutrition are
community’s warmer temperature perceptions agreed with founded on agriculture. Thus, food production and good
observed rising maximum temperature trend at 0.001 signif- nutrition can enhance environmental sustainability, eco-
icance level. This study observed a significant relationship nomic development, equity, and inclusion and reduce
between the community’s perceived local rainfall and the burden on health systems [2]. Climate change impacts
augment food security risks and threaten to erode the
gains made against malnutrition and hunger among the
most vulnerable nations and communities [3]. The United
* Corresponding author: Mary W. Ngure, Department of Earth and Nations Framework Convention on Climate Change (UNFCCC)
Climate Sciences, Institute for Climate Change and Adaptation defines climate change as “a change of climate which is
(ICCA), University of Nairobi, P.O. Box 21162-00505, Nairobi, Kenya, attributed directly or indirectly to human activity that
e-mail: mngure2013@gmail.com, tel: +254-726434085
alters the composition of the global atmosphere and which
Shem O. Wandiga: Department of Earth and Climate Sciences,
Institute for Climate Change and Adaptation (ICCA) & Department of is in addition to natural climate change attributable to
Chemistry, University of Nairobi, P.O. Box 30197-00100, Nairobi, Kenya human activities altering the atmospheric composition, and
Daniel O. Olago: Department of Earth and Climate Sciences, climate variability attributable to natural causes” [4]. Recent
Institute for Climate Change and Adaptation (ICCA), University of studies note that global rising temperatures will lower yields
Nairobi, P.O. Box 30197-00100, Nairobi, Kenya
of major crops by 3–13% without accounting for adaptations
Silas O. Oriaso: Department of Earth and Climate Sciences, Institute
for Climate Change and Adaptation (ICCA) & School of Journalism &
and CO2 fertilization [5].
Mass Communication, University of Nairobi, P.O. Box 30197-00100, Africa’s agriculture and livelihoods are heavily cli-
Nairobi, Kenya mate dependent with over 95% of Sub-Saharan Africa’s
Open Access. © 2021 Mary W. Ngure et al., published by De Gruyter. This work is licensed under the Creative Commons Attribution 4.0
International License.588 Mary W. Ngure et al.
(SSA) total cropland being rain-fed [6,7] and over 60% of County focused directly on climate stressors and their
the population working in the agricultural sector [8]. In implications on household-level food security. This study
SSA, agriculture contributes approximately 23% of the aimed to address the knowledge gap by eliciting an in-
GDP [9]. About 80% of Africa’s agriculture is small scale [10]. depth household-level understanding and scientific evi-
Africa risks the 21st-century pervasive disturbances and dence of rainfall and temperature variations and their
threats of extreme events because of overdependence on implications on food crop production and food security
rural livelihoods and climate-sensitive natural resources among smallholder farmers in the County. By under-
[11–13], limited economic and institutional adaptive capa- standing, planning for, and adapting to climate change,
city [14], low GDP, and absence of safety nets [15,16]. Food households can minimize risks from climate-related stresses
security is particularly susceptible to climate change because [37].
crop production relies on relatively predictable year to year This study worked with Kimandi-Wanyaga community
temperatures, timing, and amount of rainfall, particularly at in Ndakaini location, Gatanga sub-County in Murang’a
critical crop development stages [17]. In SSA, an estimated County. Residents are predominantly small-scale subsis-
agricultural loss of 2–7% GDP is predicted by 2100 [18]. In tence rain-fed farmers mainly growing tea under prevailing
East Africa, the expected widespread rainfall increase is unli- socio-economic challenges of a soaring population,
kely to improve agricultural productivity due to its spatial- shrinking land resources, limited livelihood opportunities,
temporal variations [19]. and rising food insecurity. They practice minimal food
Kenya’s climate is mainly driven by the Inter-Tropical crop production and most of their tea income goes to
Convergence Zone (ITCZ), a broad low-pressure zone, food purchases. Unpredictable weather patterns also affect
caused by intersection of northeast and southeast trade their crop productivity, and despite historical coping efforts,
winds of the two hemispheres [20–22]. Significant spatial- the vulnerability of the majority of the smallholder farmers
temporal rainfall variations mainly emanate from topo- to crop production constraints persists [30,38]. The inter-
graphy complexity and the presence of many lakes [23–25]. section of prevailing challenges and a changing climate
The temperature regime is equatorial characterized by could push the smallholder farmers beyond their coping
minimal average monthly and annual temperatures limits. Rainfall and temperature were the independent vari-
closely correlated with altitude. Most areas experience ables, and food security indicators were the dependent vari-
above 0°C and daily temperature variations between 9 ables. The food security indicators were as follows: the
and 13°C [26,27]. The economy heavily depends on rain- number of meals that households consumed daily, the
fed agriculture [28]. Drought cycles in Kenya have shor- number of months in a year households ate own produced
tened [29], resulting in severe food security challenges foods, the household’s meal variety, and the household’s
that render majority of Kenyans unable to access the right meal sizes. The research adopted the following research
food quality and quantity. The Kenya Food Security questions: What are the observed rainfall and temperature
Steering Group (KFSSG) and Murang’a County Integrated trends during the period 1984–2014 in Kimandi-Wanyaga in
Development Profile [30] note that many Kenyan house- Murang’a County, Kenya? What are the community’s per-
holds are net food consumers while others spend most of ceived rainfall and temperature changes? What is the rela-
their income on food purchase [30,31]. tionship between the community’s perceived rainfall and
Murang’a County in Kenya faces climate change impacts temperature changes and their food security during the
manifested in frequent droughts, floods, and drying water- period 1984–2014? The main aim of the study is to analyze
ways that deteriorate agricultural production and worsen climate stressors, specifically rainfall and temperature,
communities’ food insecurity. Climate disasters slow down affecting food security among the Kimandi-Wanyaga com-
the County’s economic development as limited resources munity in Murang’a County in Kenya. The study’s specific
are diverted to disaster response and recovery programs. objectives are to analyze the observed rainfall and tem-
Without adaptation, the situation is bound to worsen vis- perature trends for the period 1984–2014; the community’s
à-vis climate change [30,32]. A range of climate studies has perceived rainfall and temperature changes; and the rela-
been carried out in the County, and much of it focused on tionship between perceived rainfall and temperature
County-level climate and landslide occurrence [33], rain- changes on the community’s food security during the
fall distribution and crop growing seasons [34], potential period 1984–2014. To achieve the first objective, observed
evaporation estimation [35], and rainfall variability deter- rainfall and temperature data were analyzed using the
mination [32]. Given that climate change impacts in devel- MAKESENS procedure. To achieve the second and third
oping countries are locally specific and highly uncertain objectives, the study tested two hypotheses: (1) H01: There
[36], there remains a dearth of knowledge in Murang’a is no significant relationship between perceived rainfallClimate change and food security 589
changes and the household food security among the 2 Methods
Kimandi-Wanyaga community in Murang’a County, Kenya.
(2) H02: There is no significant relationship between per-
2.1 Study area
ceived temperature change and the household food security
among Kimandi-Wanyaga community in Murang’a County,
Kenya. The findings would raise awareness on climate The community occupies Kimandi-Wanyaga sub-location,
change reality and its impacts on food security among the Ndakaini location, Kariara Ward, Gatanga sub-County in
most vulnerable and provide recommendations for policy- Murang’a County covering approximately 9.169 km2
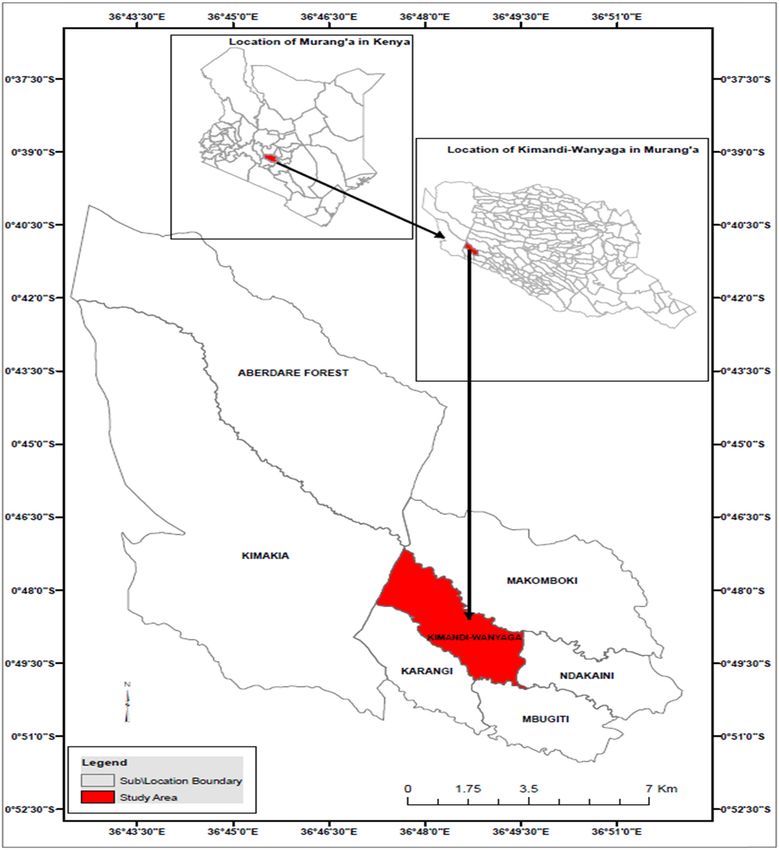
makers on climate change adaptation for food security. (Figure 1). The total population is 3,479 people, 943
Figure 1: Location map of the study area in Murang’a County, Kenya.590 Mary W. Ngure et al.
households with a population density of 379 persons per N
n= , (1)
km2 [39]. It lies at 2,040 m above sea level within lower 1 + N (e ) 2
highland (LH1) agro-ecological zone (also called Tea-Dairy where n = sample size, N = number of households in the
Zone) characterized by permanent cropping possibilities population, and e = allowable error (%).
dividable in a long to very long cropping season followed Substituting numbers to the formula:
by a medium one. Proximity to Mt. Aberdares and Mt. Kenya
makes the climate generally wet and humid, hence suitable 943
n= ,
for tea and dairy farming. Mean annual temperatures 1 + 943(0.05)2
range from 15 to 18°C with an annual average rainfall n = 280.8637.
of 1,700–2,400 mm. Rainfall distribution is bimodal with Rounded off to 281 households.
long rains falling in March to May (MAM) and short rains Sampled households were selected through the sys-
from November to early January. April rainfall is highest in tematic sampling method [41]. A probability inclusion
amount and reliability [38]. range (sampling fraction) was expressed as = n , where
N
Residents are predominantly smallholder rain-fed n is the sample size and N is the population size, which
farmers. The average household farm size is 1.4 acres. was determined as follows:
Over 95% of arable land is under tea. Common food crops
grown include maize, beans, Irish potatoes, sweet pota- 281
= = 1/ 3.
toes, cabbages, kales, and avocadoes, which are grown 943
near homesteads and along river valleys. Most farm pro- Thus, one in every three households took part in
duce is consumed at home. Livestock reared include the study. Respondents were household heads whether
cows, goats, chicken, rabbits, and a few sheep [30]. male or female. The question on diet diversity was only
Over 35% of the landscape is steep with fragile soils answered by the person in charge of household meal pre-
susceptible to soil erosion and landslides. The volcanic paration the previous day. Key informants (KIs) were pur-
rock system has disconformities and porous beds, which posively selected based on knowledge required to meet
collect and move ground water and regulate water supply study objectives.
from wells and boreholes [38]. Perennial rivers in the area
are Kayuyu, Thika, Githika, and Gitabiki draining into
Ndakaini Dam. Approximately 60% of the population 2.3 Data collection method
have piped water, while 40% rely on river and rain water
harvesting. The use of tap water for irrigation is prohi- Primary data were collected between September and
bited. Currently, the area experiences erratic weather pat- December 2015. Monthly rainfall data (1961–2016) and tem-
terns resulting in river flow recession, low crop yields, perature data (1988–2016) for Thika Meteorological Station
total crop failure, and food insecurity. The steep relief were sourced from the Kenya Meteorological Department
and fragile soils expose the area to flush floods, soil ero- (KMD) Nairobi. Community perceptions data were collected
sion, environmental degradation, landslides, river and using semistructured questionnaires in a household survey,
dam siltation, and water eutrophication. Landslides cause KI interviews, and focus group discussions (FGDs). A house-
human and livestock mortalities and loss of crops and hold was used as the unit of analysis and defined as “a
farming land [30]. group of people living in the same compound consisting
of enclosed set of buildings, eating from the same pot and
recognizing one head of household, usually a husband and
father or guardian” [39]. Factors underlying the commu-
2.2 Sampling procedure and sample size nity’s food insecurity were based on a number of food
determination security indicators such as number of meals consumed
daily, length of time households consumed own produced
The study adopted a mixed methods research design. The foods, and diet quality. Diet quality was measured through
study population comprised 943 Kimandi-Wanyaga sub- a Household Dietary Diversity Score (HDDS) [42] to get a
location smallholder subsistence households [39]. The snapshot reflection of the households’ economic ability to
Yamane formula at 95% confidence level [40] was used access different foods. A 24 h recall period was used to
to derive the household survey sample of 281 households. count the total food groups that a household had consumed
Taro Yamane formula: in the preceding 24 h. A household dietary diversityClimate change and food security 591
questionnaire was adapted to Kimandi-Wanyaga context A trend at α = 0.001 significance level indicates a
by having a government nutrition officer and some local high probability of existence of a monotonic trend.
women categorize the food group list, translate it into A trend at α = 0.1 significance level indicates the data
locally available foods, and recognize names for meal, values are from a random distribution with a 10% prob-
snack, and household. Information gathered included all ability risk of rejecting the hypothesis of no trend.
foods consumed by the household members the previous The Z statistic is assumed to have a normal distribu-
day and night and all ingredients used in preparing the tion and is used to evaluate the presence of a statistically
foods. significant trend, where:
A positive value stipulates an upward trend.
A negative value stipulates a downward trend.
2.4 Data analysis
Monthly rainfall data (1961–2016) and temperature data 2.4.1 Mann–Kendall test
(1988–2016) for Thika Meteorological Station primary
data were collected between 2015 and 2017. Meteoro- For number of data values exceeding 10, the normal
logical data from local volunteer weather stations were approximation test is used.
found to contain long periods of missing data and hence Mann −Kendall statistic
considered insufficient for robust conclusions. Therefore, (2)
= Number of positive differences
the study used monthly data available at Thika Meteoro-
− Number of negative differences.
logical Station whose rainfall data (1961–2016) had no
missing values. However, the station’s only available S variance is calculated using the following equation
monthly minimum temperature data were for 29 years accounting for any ties present:
(1988–2016), while the monthly maximum temperature
data were for the period 1980–2016 with two year’s missing Variance of Mann −Kendall statistic
Average of squared differences (3)
data (1997 and 1998). The data were analyzed as they were = .
using Mann–Kendall and Sen’s slope analyses commonly Count of data values
referred to as the MAKESENS procedure [43]. The MAKE- The test statistic Z is computed using the values of
SENS procedure is based on the nonparametric Man- statistic and variance of statistic as follows:
n–Kendall test for detecting trends, and the nonparametric
Statistic − 1
Sen’s slope estimator, for estimating magnitude of the Test statistic Z = ,
Square root of variance (4)
trends. The Mann–Kendall test detects the presence of
decreasing or increasing monotonic trends of annual time if statistic is greater than 0.
series with no seasonal or other cycle, while Sen’s method Test statistic Z = 0, if statistic is equal to 0. (5)
estimates a linear slope for the trends. MAKESENS was
Statistic + 1
mainly developed to detect and estimate trends, in time Test statistic Z = ,
Square root of variance (6)
series of annual values of atmospheric and precipitation
concentrations. The approach has been applied in various if statistic is less than 0.
studies to measure rainfall and temperature trends [44–48].
In this study, MAKESENS approach was found appropriate
for the trend analysis because data do not require to conform 2.4.2 Sen’s method
to particular distribution, it allows for missing data, and the
Sen’s method is not highly sensitive to outliers or single data Sen’s method estimates the true slope of an existing trend
errors. The two-tailed test in the MAKESENS analysis is spe- (annual change) assumed to be linear and fitting the equation:
cifically employed at four significance levels symbolized as True slope = Slope estimate + constant. (7)
follows:
*** If trend at α = 0.001 level of significance. To get the slope estimate, the data value sets of all
** If trend at α = 0.01 level of significance. slopes are calculated, where:
* If trend at α = 0.05 level of significance.
Slope estimate
+ If trend at α = 0.1 level of significance. (8)
Difference of data values between years
If blank cell, α > 0.1 level of significance. = .
Difference between years
Therefore:592 Mary W. Ngure et al.
The median of the number of time periods (between Table 1: Characteristics of the survey population
the years) is Sen’s estimator of slope.
The number of slope estimates = number of time Characteristic Percentage
periods + (number of time periods less 1 divided by 2). Age (years) 85 2.5
Slope estimate 1 ≤ slope estimate 2 ≤ slope estimate 3 Gender Male 76.2
Female 23.8
Sen’s estimator = Median slope (9) Formal education None 8.9
level
= Median of slope estimates if number of slope estimates Primary 28.8
is odd Secondary 52.7
College/University 9.5
= Average of the two middle slope estimates if number of
Household farm 0–0.5 6.0
slope estimates is even acreage
0.51–1.0 19.6
The quantitative data obtained from the household 1.01–1.5 17.8
survey were analyzed through descriptive statistics using 1.51–2.0 16.0
the Statistical Package for Social Sciences (SPSS). The 2.01–2.5 16.0
2.51–3.0 10.3
study hypotheses were analyzed using chi-square tests
3.01–3.5 2.5
and cross tabulation between different parameters of 3.51–4.0 5.0
rainfall and the households’ food security indicators. 4.01–4.5 2.1
The community’s perceived rainfall change parameters 4.51–5.0 2.1
were the frequency of drought, adequacy of rainfall during 5.01–5.5 1.1
>5.51 1.4
crop growing season, rainfall intensity, and the rainfall
Household arable Tea crop 67.34
season onset and cessation. The temperature parameters farm uses
were an increase, a decrease, or remained the same. Food crops 20.59
The household food security indicators were as follows: Household head Farming only 83.3
the number of meals consumed daily, length of time occupation
households consumed own produced foods, diet quality/ Farming and informal 8.9
employment
variety, and the food rations. The significance of the
Farming and formal 7.8
relationships was assessed using the probability values employment
(where the critical p value was 0.05) associated with
the computed chi-square statistics. An associated p value
of less than 0.05 led to the rejection of the null hypothesis of the farmers (95.3%) owned less than 4.5 acres of land,
and vice versa. The findings were presented in tables. and most of the arable land was under tea crop (67.34%).
Qualitative data were analyzed using the content analysis
and presented in direct quote formats.
3.2 The factors underlying the household’s
food insecurity
3 Results Multiple responses from the household survey indicated
that within the year 2013, 62% of respondents had
3.1 Characteristics of the survey population gone hungry, 68% had run out of money to buy food,
while 71% had cut the sizes of their meals. About 74%
Results of the study (Table 1) show that majority of house- of respondents had skipped a meal, while 76% had
hold heads (76.2%) were male, middle-aged (57.3%), and reduced the variety of foods eaten. One FGD participant
had attained secondary level education (52.7%). Majority added that:Climate change and food security 593
“Rainfall in this area has changed and it has reduced our crop Table 3: Household dietary diversity score (HDDS)
yields especially maize. This has brought food shortage. In the
past, we used to harvest enough maize to store for the whole N Minimum Maximum Mean Std. deviation
year. Every home had a granary for storing maize. We dried the
maize in the sun and stored it for making Githeri (boiled maize HDDS 281 2 7 4.0036 1.11323
and beans) and porridge. We used to cook a lot of foods and
store it in the granaries. The granaries were not locked so that
all family members and visitors would be able to serve them-
selves food freely. We shared our food freely because we had a consumed cereals (82.6%), sugar and honey (67.3%), oils
lot of food. We also had many celebrations in a year especially and fats (65.5%), vegetables (60.5%), roots and tubers
after harvesting our crops. Now we don’t have granaries (58.7%), and legumes and nuts (55.5%). The food groups
because we have little food to store. We don’t have enough to least consumed by the households were fruits (31%),
food to keep until the next harvest and we buy most of our
meat and poultry (30.6%), and eggs (23.5%). The average
foods from the local markets, Thika town or from Nyandarua
County. Most of the money we get from tea is used to buy food HDDS observed among the study community (Table 3)
and pay school fees. Families with small farms don’t have was about 4.0036.
enough money to buy food and spend on other things and One KI also asserted that:
sometimes they go hungry. They have to work on other people’s
farms to earn money.” “The common foods we eat here are Githeri (a mixture of boiled
maize [Zea mays] and beans [Phaseolus vulgaris]) fried with
Regarding the length of time households consumed own cabbages (Brassica oleracea), Irish potatoes (Solanum tuber-
produced foods, 40.2% of respondents indicated 2 months, osum) or mashed with pumpkin (Cucurbita moschata) leaves,
38.8% indicated 1 month, 20.6% indicated 3 months, and Ugali (maize flour cooked with boiled water to a dough-like
consistency) eaten with Sukuma wiki (Brassica oleracea var.
0.4% indicated 6 months. One KI noted that:
viridis) or cabbages (Brassica oleracea). We also commonly
eat rice (Oryza sativa), beans (Phaseolus vulgaris), arrowroots
“Most of us here do not harvest enough food to use until the
(Xanthosoma sagittifolium), sweet potatoes (Ipomea batata)
next harvest. Families with enough money usually buy food
and eggs. Here we don’t commonly eat meat and chicken
like as Irish potatoes, green peas, cabbages, tomatoes and car-
because they are very expensive.”
rots from our neighboring Counties.”
The households’ daily food consumption results showed
that 71.5% consumed two meals, 27.1% consumed three
meals, 9.2% consumed one meal, and 1.4% consumed 3.3 The rainfall trend analysis during the
four meals. The study findings on the qualitative measure period 1984–2014
of the households’ access to various foods analyzed using
the HDDS method are presented in Tables 2 and 3. Station-based rainfall data for Thika Meteorological
The results in Table 2 indicate that within the 24 h Station (1961–2016) were analyzed using the MAKESENS
reference period, more than half of the households had procedure to detect seasonal and annual rainfall trends
Table 2: Percent of households consuming each food group within the reference 24 h period
Food categories No Yes Total
Count Percent Count Percent Count Percent
Cereals 49 17.4 232 82.6 281 100.0
Fish 264 94.0 17 6.0 281 100.0
Root and tubers 116 41.3 165 58.7 281 100.0
Legumes/nuts 125 44.5 156 55.5 281 100.0
Vegetables 111 39.5 170 60.5 281 100.0
Milk and milk products 158 56.2 123 43.8 281 100.0
Fruits 194 69.0 87 31.0 281 100.0
Oil/fats 97 34.5 184 65.5 281 100.0
Meat/poultry 195 69.4 86 30.6 281 100.0
Sugar/honey 92 32.7 189 67.3 281 100.0
Eggs 215 76.5 66 23.5 281 100.0
Miscellaneous food items 133 47.3 148 52.7 281 100.0594 Mary W. Ngure et al.
Table 4: The annual and seasonal rainfall trends
Annual rainfall MAM rainfall OND rainfall
N Test Z Sig. Q % change Test Z Sig. Q % change Test Z Sig. Q % change
56 0.01 0.063 0.37334 −0.37 −0.747 −9.4188 1.1 1.195 18.8865
N: the number of annual values in the calculation excluding missing values. Test Z: the test statistic Z. Sig: if blank cell, α > 0.1 level of
significance. Q: Sen’s estimator for the true slope of linear trend (change per unit time). % change: calculated as: ((Sen’s slope × length of
period)/mean) × 100.
y = -0.2603x + 952.97
1800.00
1600.00
Annual Rainfall (mm.)
1400.00
1200.00
Data
1000.00
800.00 Sen's
600.00 estimate
Linear
400.00 (Data)
200.00
0.00
1961
1964
1967
1970
1973
1976
1979
1982
1985
1988
1991
1994
1997
2000
2003
2006
2009
2012
2015
Year
Figure 2: The annual rainfall trend.
y = -0.4374x + 456.74
1000.00
900.00
800.00
700.00
Rainfall (mm.)
600.00 Data
500.00
Sen's
400.00 estimate
300.00 Linear
200.00 (Data)
100.00
0.00
1961
1964
1967
1970
1973
1976
1979
1982
1985
1988
1991
1994
1997
2000
2003
2006
2009
2012
2015
Year
Figure 3: Long season (March–May) rainfall trend.
in the study area. The results are stipulated in Table 4 and rainfall of October to December (OND) had increased by
Figures 2–4. 18.8865% at a magnitude of 1.195. Annual rainfall shows
Results of the seasonal rainfall trend (Table 4) indi- an increase of 0.37335% at a magnitude of 0.063. How-
cate that the long season rainfall of MAM had decreased ever, the significance level was greater than 0.1, indi-
by 9.4188% at a magnitude of −0.747 and the short season cating a higher than 10% probability risk of rejectingClimate change and food security 595
y = 0.598x + 331.21
1000.00
900.00
800.00
700.00
Rainfall (mm.)
600.00 Data
500.00
400.00 Sen's
estimate
300.00 Linear
200.00 (Data)
100.00
0.00
1961
1964
1967
1970
1973
1976
1979
1982
1985
1988
1991
1994
1997
2000
2003
2006
2009
2012
2015
Year
Figure 4: Short season (October–December) rainfall trend.
Table 5: The monthly maximum and minimum temperature trends
TMIN TMAX
N Test Z Sig. Q % change N Test Z Sig. Q % change
29 1.44 0.016 4.011 35 3.82 *** 0.040 9.745
N: the number of annual values in the calculation excluding missing values. Test Z: the test statistic Z. Sig: *** if trend at α = 0.001 level of
significance. Q: Sen’s estimator for the true slope of linear trend (change per unit time). % change: calculated as: ((Sen’s slope × length of
period)/mean) × 100.
the H0 hypothesis of no trend. Therefore, the annual and 4.011% at a magnitude of 0.016, a trend that was statistically
seasonal rainfall trends in the study area during the study insignificant (α > 0.1). The monthly maximum temperature
period 1984–2014 were not statistically significant (α > 0.1) trend showed an increasing change of 9.745% at a magni-
as also illustrated in Figures 2–4. The study area is char- tude of 0.04%, a trend that was statistically significant (*** if
acterized by the bimodal rainfall pattern of long rains trend at α = 0.001 significance level). This implied that the
(MAM) and short rains (OND), which drive crop produc- study area had significantly warmed during the period
tion cycles. Despite the statistically insignificant annual 1984–2014.
and seasonal rainfall trends, the study does not presume
that rainfall did not vary during the un-analyzed June–
July–August (JJA) season. 3.5 The perceived rainfall changes
(1984–2014)
3.4 Temperature trend analysis during the Approximately 91% of the study respondents reported
period 1984–2014 that they had observed changes in local rainfall and
72.2% reported an increase in drought frequency during
The maximum monthly temperature (1980–2016) and minimum the period 1984–2014. The majority of respondents (72.2%)
monthly temperature (1988–2016) data for Thika Meteoro- also reported rise in drought frequency. One KI reiter-
logical Station were analyzed for trends using the ated that:
MAKESENS procedure. The results are illustrated in
“Here in this area, rains have reduced and we have been
Table 5 and Figures 5 and 6. staying for long periods of time without rains compared to
The MAKESENS trend analysis results (Table 5) showed what used to happen long ago. This has made our animals to
that the monthly minimum temperature had increased by lack food. Our tea and crop harvests have also gone down.”596 Mary W. Ngure et al.
y = 0.0101x + 13.984
15.00
Min. Temperature. (˚C)
14.50
14.00
Data
13.50
Sen's
estimate
13.00 Linear
(Data)
12.50 1988
1990
1992
1994
1996
1998
2000
2002
2004
2006
2008
2010
2012
2014
2016
Year
Figure 5: Monthly minimum temperature trend.
y = 0.0407x + 24.915
28.00
27.50
Max. Temperature (˚C)
27.00
26.50
26.00 Data
25.50
25.00 Sen's
24.50 estimate
24.00 Linear
23.50 (Data)
23.00
1980
1982
1984
1986
1988
1990
1992
1994
1996
1998
2000
2002
2004
2006
2008
2010
2012
2014
2016
Year
Figure 6: Monthly maximum temperature trend.
About 75.3% of the study respondents also reported Nowadays, we are not sure when it will rain. If we plant crops at
a decrease in floods frequency. One FGD participant the beginning of rains, most of the rains fall quickly and end
added that: quickly making the days we have rains to be few compared to
what used happen a long time ago. Sometimes the rains stop
when crops are still growing making our crops to give low har-
“Here we don’t get floods because our land has many hills.
vests. Sometimes all our crops dry up due to lack of rains.”
When it rains heavily, our farms which area near the rivers
get flooded and this covers our crops such as vegetables and
arrowroots (Xanthosoma sagittifolium).”
Approximately 79.4% of the study respondents indicated
that they had noted a decrease in adequacy of rainfall 3.6 The perceived impacts of rainfall
during crop growing seasons, while about 77.2% of the changes on the households’ food
respondents perceived reduction in rainfall intensity. The security
FGDs participants noted that sometimes the rains were
heavy, while other times they were very light and below The following null hypothesis was tested:
crops needs. One KI added that:
H01: There is no significant relationship between the perceived rain-
“In the past, rainfall used to be plentiful and predictable such fall changes and the household food security among Kimandi-
that we knew when to dig our farms and when to plant our crops. Wanyaga community in Murang’a County, Kenya.Climate change and food security 597
Table 6: Cross-tabulation analysis between the perceived changes in drought frequency and the household’s food security
Frequency of drought Number of meals households consumed daily
Two Three Four Total χ² p-value
n (%) n (%) n (%) n (%)
No change 42 (67.70) 20 (32.30) 0 (0.00) 62 (22.06) 73.807a 0.000
Decreased 5 (31.20) 7 (43.80) 4 (25.00) 16 (5.69)
Increased 155 (76.40) 48 (23.60) 0 (0.00) 203 (72.24)
Total 202 (71.90) 75 (26.70) 4 (1.40) 281 (100.0)
a
0 cells (0.0%) have expected count less than 5. The minimum expected count is 6.23.
Frequency of drought Number of months in a year household ate own-produced foods
1 month 2 months 3 months 6 months Total χ² p-value
n (%) n (%) n (%) n (%) n (%)
No change 12 (19.40) 30 (48.40) 20 (32.30) 0 (0.00) 62 (22.06) 53.951a 0.000
Decreased 2 (12.50) 3 (18.80) 10 (62.50) 1 (6.20) 16 (5.69)
Increased 95 (46.80) 80 (39.40) 28 (13.80) 0 (0.00) 203 (72.24)
Total 109 (38.80) 113 (40.20) 58 (20.60) 1 (0.40) 281 (100.0)
a
0 cells (0.0%) have expected count less than 5. The minimum expected count is 6.06.
Frequency of drought Households reduced meal variety because food was not enough
Yes No Total χ² p-value
n (%) n (%) n (%)
No change 38 (61.30) 24 (38.70) 62 (22.06) 31.411a 0.000
Decreased 5 (31.20) 11 (68.80) 16 (5.69)
Increased 170 (83.70) 33 (16.30) 203 (72.24)
Total 213 (75.80) 68 (24.20) 281 (100.0)
a
0 cells (0.0%) have expected count less than 5. The minimum expected count is 4.87.
Frequency of drought Cut the size of meals in the past year (2014) because food was not enough
Yes No Total χ² p-value
n (%) n (%) n (%)
No change 26 (41.90) 36 (58.10) 62 (22.06) 53.333a 0.000
Decreased 4 (25.00) 12 (75.00) 16 (5.69)
Increased 167 (82.30) 36 (17.70) 203 (72.24)
Total 197 (70.10) 84 (29.90) 281 (100.0)
a
0 cells (0.0%) have expected count less than 5. The minimum expected count is 5.78.
The results of a chi-square test on the relationship between households’ daily meals, the length of time households con-
the perceived changes in drought frequency and the house- sumed own-produced foods, and the households’ meal
holds’ food security are presented in Table 6. variety and rations.
The computed p-value of 0.000 (Table 6) was less The study results of the cross-tabulation analysis
than 0.05, an indication that the drought frequency was between rainfall adequacy during the crops growing
significantly related with the number of meals households season and the household’s food security are presented
consumed daily (χ² = 73.807a, p = 0.000), the length of time in Table 7.
households consumed own-produced foods (χ² = 53.951a, From the study results (Table 7), rainfall adequacy
p = 0.000), the households’ meal variety (χ² = 31.411a, during crop growing season was significantly related to
p = 0.000), and the households’ food rations in the year the number of meals households consumed daily (χ² =
2014 (χ² = 53.333a, p = 0.000). The results implied that 43.265a, p = 0.000), the number of months in a year that
increased drought frequency had reduced the number of households consumed own-produced foods (χ² = 29.430a,598 Mary W. Ngure et al.
Table 7: Cross-tabulation analysis between the perceived changes in the rainfall adequacy during the crops growing season and the
household’s food security
Rainfall adequacy during crop growing season Number of meals households consumed daily
Two Three Four Total χ² p-value
n (%) n (%) n (%) n (%)
Decreased 172 (77.10) 51 (22.90) 0 (0.00) 223 (79.36) 43.265a 0.000
No change 10 (58.80) 7 (41.20) 0 (0.00) 17 (6.05)
Increased 7 (35.00) 10 (50.00) 3 (15.00) 20 (7.12)
Undecided 13 (61.90) 7 (33.30) 1 (4.80) 21 (7.47)
Total 202 (71.90) 75 (26.70) 4 (1.40) 281 (100.0)
a
0 cells (0.0%) have expected count less than 5. The minimum expected count is 5.30.
Rainfall adequacy during crop growing season Number of months in a year that households consumed own-produced foods
1 month 2 months 3 months 6 months Total χ² p-value
n (%) n (%) n (%) n (%) n (%)
Decreased 96 (43.00) 88 (39.50) 39 (17.50) 0 (0.00) 223 (79.36) 29.430a 0.001
No change 6 (35.30) 8 (47.10) 3 (17.60) 0 (0.00) 17 (6.05)
Increased 1 (5.00) 10 (50.00) 8 (40.00) 1 (5.00) 20 (7.12)
Undecided 6 (28.60) 7 (33.30) 8 (38.10) 0 (0.00) 21 (7.47)
Total 109 (38.80) 113 (40.20) 58 (20.60) 1 (0.40) 281 (100.0)
a
0 cells (0.0%) have expected count less than 5. The minimum expected count is 6.47.
Rainfall adequacy during crop growing season Ate a smaller variety of foods than usual because food was not enough
Yes No Total χ² p-value
n (%) n (%) n (%)
Decreased 184 (82.50) 39 (17.50) 223 (79.36) 31.045a 0.000
No change 11 (64.70) 6 (35.30) 17 (6.05)
Increased 7 (35.00) 13 (65.00) 20 (7.12)
Undecided 11 (52.40) 10 (47.60) 21 (7.47)
Total 213 (75.80) 68 (24.20) 281 (100.0)
a
0 cells (0.0%) have expected count less than 5. The minimum expected count is 6.11.
Rainfall adequacy during crop growing season Cut the size of meals in the past year (2014) because food was not enough
Yes No Total χ² p-value
n (%) n (%) n (%)
Decreased 181 (81.20) 42 (18.80) 223 (79.36) 75.860a 0.000
No change 9 (52.90) 8 (47.10) 17 (6.05)
Increased 0 (0.00) 20 (100.0) 20 (7.12)
Undecided 7 (33.30) 14 (66.70) 21 (7.47)
Total 197 (70.10) 84 (29.90) 281 (100.0)
a
0 cells (0.0%) have expected count less than 5. The minimum expected count is 5.08.
p = 0.000), the variety of households’ meals (χ² = 31.045a, The results of the cross-tabulation analysis of rainfall
p = 0.000), and the size of meals households consumed in intensity and household food security are provided in
the year 2014 (χ² = 75.860a, p = 0.000). Therefore, the Table 8.
rainfall adequacy during crops growing season was asso- The results of this study (Table 8) indicated a signifi-
ciated with the number of meals households consumed cant relationship between the rainfall intensity and the
daily, the period of time households consumed own-pro- number of meals that the households consumed daily
duced foods, and the households’ diet variety and rations. (χ² = 69.170a, p = 0.000), the period of time theClimate change and food security 599
Table 8: Cross-tabulation analysis between the perceived rainfall intensity and the household’s food security
Rainfall intensity Number of meals households consumed daily
Two Three Four Total χ² p-value
n (%) n (%) n (%) n (%)
Decreased 172 (79.30) 45 (20.70) 0 (0.00) 217 (77.23) 69.170a 0.000
No change 8 (50.00) 8 (50.00) 0 (0.00) 16 (5.69)
Increased 6 (22.20) 17 (63.00) 4 (14.80) 27 (9.61)
Undecided 16 (76.20) 5 (23.80) 0 (0.00) 21 (7.47)
Total 202 (71.90) 75 (26.70) 4 (1.40) 281 (100.0)
a
0 cells (0.0%) have expected count less than 5. The minimum expected count is 4.23.
Rainfall intensity Number of months in a year that households consumed own-produced foods
1 month 2 months 3 months 6 months Total χ² p-value
n (%) n (%) n (%) n (%) n (%)
Decreased 99 (45.60) 85 (39.20) 33 (15.20) 0 (0.00) 217 (77.23) 44.119a 0.000
No change 5 (31.20) 7 (43.80) 4 (25.00) 0 (0.00) 16 (5.69)
Increased 2 (7.40) 9 (33.30) 15 (55.60) 1 (3.70) 27 (9.61)
Undecided 3 (14.30) 12 (57.10) 6 (28.60) 0 (0.00) 21 (7.47)
Total 109 (38.80) 113 (40.20) 58 (20.60) 1 (0.40) 281 (100.0)
a
0 cells (0.0%) have expected count less than 5. The minimum expected count is 5.06.
Rainfall intensity Ate a smaller variety of foods than usual because food was not enough
Yes No Total χ² p-value
n (%) n (%) n (%)
Decreased 178 (82.00) 39 (18.00) 217 (77.23) 22.555a 0.000
No change 11 (68.80) 5 (31.20) 16 (5.69)
Increased 14 (51.90) 13 (48.10) 27 (9.61)
Undecided 10 (47.60) 11 (52.40) 21 (7.47)
Total 213 (75.80) 68 (24.20) 281 (100.0)
a
0 cells (0.0%) have expected count less than 5. The minimum expected count is 4.87.
Rainfall intensity Cut the size of meals in the past year (2014) because food was not enough
Yes No Total χ² p-value
n (%) n (%) n (%)
Decreased 165 (76.00) 52 (24.00) 217 (77.23) 20.136a 0.000
No change 11 (68.80) 5 (31.20) 16 (5.69)
Increased 13 (48.10) 14 (51.90) 27 (9.61)
Undecided 8 (38.10) 13 (61.90) 21 (7.47)
Total 197 (70.10) 84 (29.90) 281 (100.0)
a
0 cells (0.0%) have expected count less than 5. The minimum expected count is 5.78.
households consumed own-produced foods (χ² = 44.119a, The results of the relationship between rainfall
p = 0.000), the households’ meals variety (χ² = 22.555a, onset and the household’s food security are presented in
p = 0.000), and the households’ meal rations consumed Table 9.
in the year 2014 (χ² = 20.136a, p = 0.000). Therefore, the The results of this study (Table 9) indicated a signifi-
rainfall intensity was associated with the number of cant relationship between the rainfall season onset and
meals households consumed daily, the period of time the number of meals the households consumed daily
households consumed own-produced foods, and the (χ² = 31.715a, p = 0.000), the period of time the house-
households’ diet variety and rations. holds consumed own-produced foods (χ² = 33.905a,600 Mary W. Ngure et al.
Table 9: Cross-tabulation analysis of the perceived changes in the onset of the rainfall season and the household’s food security
Seasonal rainfall onset Number of meals the households consumed daily
Two Three Four Total χ² p-value
n (%) n (%) n (%) n (%)
Changed 161 (73.50) 58 (26.50) 0 (0.00) 219 (77.94) 31.715a 0.000
No change 20 (52.60) 14 (36.80) 4 (10.50) 38 (13.52)
Undecided 21 (87.50) 3 (12.50) 0 (0.00) 24 (8.54)
Total 202 (71.90) 75 (26.70) 4 (1.40) 281 (100.0)
a
0 cells (0.0%) have expected count less than 5. The minimum expected count is 6.06.
Seasonal rainfall onset Number of months in a year that households consumed own-produced foods
1 month 2 months 3 months 6 months Total χ² p-value
n (%) n (%) n (%) n (%) n (%)
Changed 100 (45.70) 85 (38.80) 34 (15.50) 0 (0.00) 219 (77.94) 33.905a 0.000
No change 4 (10.50) 16 (42.10) 17 (44.70) 1 (2.60) 38 (13.52)
Undecided 5 (20.80) 12 (50.00) 7 (29.20) 0 (0.00) 24 (8.54)
Total 109 (38.80) 113 (40.20) 58 (20.60) 1 (0.40) 281 (100.0)
a
0 cells (0.0%) have expected count less than 5. The minimum expected count is 9.14.
Seasonal rainfall onset Ate a smaller variety of foods than usual because food was not enough
Yes No Total χ² p-value
n (%) n (%) n (%)
Changed 171 (78.10) 48 (21.90) 219 (77.94) 3.403a 0.182
No change 27 (71.10) 11 (28.90) 38 (13.52)
Undecided 15 (62.50) 9 (37.50) 24 (8.54)
Total 213 (75.80) 68 (24.20) 281 (100.0)
a
0 cells (0.0%) have expected count less than 5. The minimum expected count is 9.14.
Seasonal rainfall onset Cut the size of meals in the past year (2014) because food was not enough
Yes No Total χ² p-value
n (%) n (%) n (%)
Changed 161 (73.50) 58 (26.50) 219 (77.94) 6.887a 0.032
No change 20 (52.60) 18 (47.40) 38 (13.52)
Undecided 16 (66.70) 8 (33.30) 24 (8.54)
Total 197 (70.10) 84 (29.90) 281 (100.0)
a
0 cells (0.0%) have expected count less than 5. The minimum expected count is 7.17.
p = 0.000), and the size of household meals in the year (χ² = 17.851a, p = 0.001), number of months in a year
2014 (χ² = 6.887a, p = 0.000). However, the study found that the households ate own-produced foods (χ² = 13.186a,
no statistically significant relationship between the sea- p = 0.040), the households’ meal variety (χ² = 11.100a,
sonal rainfall onset and the variety of foods consumed by p = 0.004), and the households’ meal sizes during the
the households as indicated by the chi-square statistic of year 2014 (χ² = 13.116a, p = 0.001).
χ² = 3.403a and p = 0.182 that was greater than 0.05. Results from the chi-square and cross-tabulation
The results of the relationship between the perceived analysis implied that the study community’s perceived
changes in the seasonal rainfall cessation and the house- rainfall changes and the households’ food security were
hold’s food security are provided in Table 10. significantly related. Based on these findings, the null
The study results (Table 10) indicated a significant hypothesis (H01) of no significant association between
relationship between the seasonal rainfall cessation and the perceived rainfall changes and household food security
the number of meals the households consumed daily among the study community was rejected. The study canClimate change and food security 601
Table 10: Cross-tabulation analysis of the perceived changes in the seasonal rainfall cessation and the household’s food security
Rainfall cessation Number of meals consumed daily
Two Three Four Total χ² p-value
n (%) n (%) n (%) n (%)
Changed 153 (74.30) 53 (25.70) 0 (0.00) 206 (73.31) 17.851a 0.001
No change 34 (63.00) 16 (29.60) 4 (7.40) 54 (19.22)
Undecided 15 (71.40) 6 (28.60) 0 (0.00) 21 (7.47)
Total 202 (71.90) 75 (26.70) 4 (1.40) 281 (100.0)
a
0 cells (0.0%) have expected count less than 5. The minimum expected count is 5.31.
Rainfall cessation Number of months in a year that family consumed own-produced foods
1 month 2 months 3 months 6 months Total χ² p-value
n (%) n (%) n (%) n (%) n (%)
Changed 90 (43.70) 80 (38.80) 36 (17.50) 0 (0.00) 206 (73.31) 13.186a 0.040
No change 13 (24.10) 24 (44.40) 16 (29.60) 1 (1.90) 54 (19.22)
Undecided 6 (28.60) 9 (42.90) 6 (28.60) 0 (0.00) 21 (7.47)
Total 109 (38.80) 113 (40.20) 58 (20.60) 1 (0.40) 281 (100.0)
a
0 cells (0.0%) have expected count less than 5. The minimum expected count is 6.28.
Rainfall cessation Ate a smaller variety of foods than usual because food was not enough
Yes No Total χ² p-value
n (%) n (%) n (%)
Changed 164 (79.60) 42 (20.40) 206 (73.31) 11.100a 0.004
No change 39 (72.20) 15 (27.80) 54 (19.22)
Undecided 10 (47.60) 11 (52.40) 21 (7.47)
Total 213 (75.80) 68 (24.20) 281 (100.0)
a
0 cells (0.0%) have expected count less than 5. The minimum expected count is 5.08.
Rainfall cessation Cut the size of meals in the past year (2014) because food was not enough
Yes No Total χ² p-value
n (%) n (%) n (%)
Changed 154 (74.80) 52 (25.20) 206 (73.31) 13.116a 0.001
No change 35 (64.80) 19 (35.20) 54 (19.22)
Undecided 8 (38.10) 13 (61.9) 21 (7.47)
Total 197 (70.10) 84 (29.90) 281 (100.0)
a
0 cells (0.0%) have expected count less than 5. The minimum expected count is 6.28.
therefore deduce that the community’s perceived rainfall concurred that temperatures had become unpredictable
changes were significantly related with the level of the citing that, in the past, July that was the coldest month of
households’ food security. the year had become warmer, while the month of August
that used to be warm had become the coldest month of
the year. One elderly KI opined that:
3.7 The community’s perceived temperature “Our usual crop planting times have really changed. Temperatures
changes (1984–2014) have changed a lot. We cannot tell when it will be warm or cold or
when the cold season will start or end. Sometimes it gets too hot
About 59.8% of respondents reported that local tempera- while other times it gets too cold. A day can start warm and end up
very cold. Sometimes it’s too hot that our crops dry out.”
tures were rising temperatures. The FGDs participants602 Mary W. Ngure et al.
Table 11: Cross-tabulation analysis of the perceived temperature changes and the household’s food security
Temperature changes Number of meals households consumed daily
Two Three Four Total χ² p-value
n (%) n (%) n (%) n (%)
Decreased 42 (70.00) 18 (30.00) 0 (0.00) 60 (21.35) 27.498a 0.000
No change 6 (60.00) 2 (20.00) 2 (20.00) 10 (3.56)
Increased 121 (72.00) 46 (27.40) 1 (0.60) 168 (59.79)
No response 33 (76.70) 9 (20.90) 1 (2.30) 43 (15.30)
Total 202 (71.90) 75 (26.70) 4 (1.40) 281 (100.0)
a
0 cells (0.0%) have expected count less than 5. The minimum expected count is 5.14.
Temperature changes Number of months in a year that households consumed own-produced foods
1 month 2 months 3 months 6 months Total χ² p-value
n (%) n (%) n (%) n (%) n (%)
Decreased 27 (45.00) 19 (31.70) 14 (23.30) 0 (0.00) 60 (21.35) 34.549a 0.000
No change 1 (10.00) 4 (40.00) 4 (40.00) 1 (10.00) 10 (3.56)
Increased 67 (39.90) 71 (42.30) 30 (17.90) 0 (0.00) 168 (59.79)
No response 14 (32.60) 19 (44.20) 10 (23.30) 0 (0.00) 43 (15.30)
Total 109 (38.80) 113 (40.20) 58 (20.60) 1 (0.40) 281 (100.0)
a
0 cells (0.0%) have expected count less than 5. The minimum expected count is 6.04.
Temperature changes Ate a smaller variety of foods than usual because food was not enough
Yes No Total χ² p-value
n (%) n (%) n (%)
Decreased 42 (70.00) 18 (30.00) 60 (21.35) 22.555a 0.000
No change 3 (30.00) 7 (70.00) 10 (3.56)
Increased 141 (83.90) 27 (16.10) 168 (59.79)
No response 27 (62.80) 16 (37.20) 43 (15.30)
Total 213 (75.80) 68 (24.20) 281 (100.0)
a
0 cells (0.0%) have expected count less than 5. The minimum expected count is 4.42.
Temperature changes Cut the size of meals in the past year (2014) because food was not enough
Yes No Total χ² p-value
n (%) n (%) n (%)
Decreased 42 (70.00) 18 (30.00) 60 (21.35) 21.922a 0.000
No change 3 (30.00) 7 (70.00) 10 (3.56)
Increased 131 (78.00) 37 (22.00) 168 (59.79)
No response 21 (48.80) 22 (51.20) 43 (15.30)
Total 197 (70.10) 84 (29.90) 281 (100.0)
a
0 cells (0.0%) have expected count less than 5. The minimum expected count is 4.99.
3.8 The relationship between perceived A chi-square test was conducted to test the null
temperature changes and the hypothesis (H02) of no significant relationship between
households’ food security (1984–2014) the two variables. The results of the chi-square test and
cross-tabulation between the perceived temperature changes
The following null hypothesis was tested: and the households’ food security are presented in Table 11.
The study results (Table 11) indicate that temperature
H02: There is no significant relationship between the perceived changes were significantly related with the number of
temperature changes and the household food security among households’ daily meals (χ² = 27.498a, p = 0.000), the
Kimandi-Wanyaga community in Murang’a County, Kenya. number of months in a year that the householdsClimate change and food security 603
consumed own-produced foods (χ² = 34.549a, p = 0.000), micronutrient density of diets but they improve energy
the households’ meal variety (χ² = 22.555a, p = 0.000), density and absorption of fat-soluble vitamins and plant
and the households’ meal sizes during the year 2014 carotenoids. Low consumption of micronutrients on a
(χ² = 21.922a, p = 0.000). The study results indicated given day may indicate seriously inadequate diets that
a significant relationship between temperature changes may cause micronutrients deficiency-related morbidity.
and the household’s food security. Thus, the null hypoth- From a potential score range of 0–12, the households
esis (H02) of no significant relationship between the per- mean HDDS score of 4.0036 indicated inadequate dietary
ceived temperature changes and the households’ food diversity. Low dietary diversity levels also indicate a like-
security in the study area was rejected. The study can lihood of low per capita consumption levels and caloric
therefore deduce that the community’s perceived tem- availability and hence low food access [52,53]. Recently,
perature changes were significantly related with the level it has been argued that climate change can alter the
of the households’ food security. micronutrient availability particularly among low-income
countries [54]. Micronutrient deficiency prevalence among
populations in Kenya has been reported [55]. In Ghana and
Tanzania, climate-induced food unavailability was also
4 Discussion observed among agriculture-based households [56]. In
Madagascar farming, households were reported to ration
Results of the study (Table 1) show that majority of food and use wild foods to cope with climate-induced food
household heads were males (76.2%) and middle-aged insecurity [57].
(57.3%). Studies show that male household heads have Results of the study indicated that the community
a higher probability of perceiving climate change than perceived irregularities in rainfall amount, intensity, fre-
female household heads, owing to their higher accessi- quency, and timing during the period 1984–2014 with
bility to new information. Older farmers are also more adverse impacts on their crop productivity. According
likely to perceive climate change than younger farmers to them, rainfall irregularities had interrupted their pre-
because long farming experience increases their agro- dictable traditional cropping calendars determined by
nomic superiority [49,50]. High literacy levels were observed two rainfall seasons of long rains (MAM) and short rains
among the study community since about 52.7% of respondents (OND). The perceived seasons unpredictability and rain-
had attained secondary level education. Higher education fall inadequacy delayed crop planting making farmers to
exposes farmers to new climate change insights raising the lose seeds if they dry-planted in anticipation for the rains.
likelihood of more educated farmers to perceive climate Those who planted at rainfall onset lost their crops if the
change compared to less-educated farmers [49,50]. The rains stopped earlier, fell for a short time, or stopped at
majority of the farmers (95.3%) owned less than 4.5 acres the peak of crop growth. They alleged that, as planting
of land. Smallholder farmers are defined as those owning times became highly uncertain, crops got stunted, yields
less than 2.0 hectares (equivalent to 4.94 acres) [51]. Most fell drastically, and more expenses were incurred as
of the community’s arable land was under tea crop (67.34%) weeding times increased. Their perceptions underpinned
confirming Murang’a County report [30]. the importance of rainfall in determining their food security.
Results of the study show that the community was The community’s perceptions agreed with the results of the
undergoing food availability challenges. Gaps of food chi-square test and cross-tabulation analysis involving the
availability between seasons was evident since food pro- perceived rainfall changes and their impacts on the house-
duced by most households (80%) hardly lasted to the hold’s food security. The results indicated a significant rela-
next season. Also evident was food inaccessibility among tionship between rainfall changes and the community’s
the households as manifested in financial difficulties that food security. Similar findings have been reported among
led to rationing or lowering of meal quality as some farming communities. Farmer’s perceptions on declining
households stayed hungry due to food shortage. The rainfall and its adverse impacts on food security have
HDDS results also revealed that most of the households’ been reported [13,14,58].
diets were packed with energy dense food groups such as Conversely, the community perceptions on rainfall
cereals, sugar, honey, oils, and fats and low in micronu- decline were not supported by meteorological rainfall
trient dense food groups such as fruits, meat, poultry, data. The MAKESENS test rainfall results yielded statisti-
and eggs. One KI reported that meat and poultry were cally insignificant trends (α > 0.1), indicating normal
not commonly consumed because they were expensive. annual and seasonal rainfall distribution in the study
It is noted that fats and oils do not contribute to the area during the period 1984–2014. A range of studiesYou can also read