Needs Assessment Report - CREATING ECONOMIC SECURITY FOR WOMEN THROUGH CAREERS IN AVIATION - Elevate Aviation
←
→
Page content transcription
If your browser does not render page correctly, please read the page content below
CREATING ECONOMIC SECURITY FOR WOMEN
THROUGH CAREERS IN AVIATION
May 1, 2018 – April 30, 2021

   CREATING ECONOMIC SECURITY
   FOR WOMEN THROUGH CAREERS
   IN AVIATION

  Needs
  Assessment
  Report
   May 1, 2018 – April 30, 2021
2

ACKNOWLEDGEMENTS

We would like to thank everyone who contributed their time, ideas, and expertise to Creating
Economic Security for Women Through Careers in Aviation – Elevate Aviation Needs Assessment.
Through this undertaking, there is no greater understanding on the barriers, gaps, and challenges
faced by Canadian women in aviation. The findings and recommendations presented in this report
will be instrumental to all those who truly wish to elevate women’s role in the industry.

Project partners:

•      NAV CANADA
•      Air Canada
•      WestJet
•      Jazz Aviation
•      Porter Airlines
•      North Cariboo Air
•      Canadian Owners and Pilots Association (COPA)
•      Canadian Air Traffic Control Association (CATCA)
•      Transport Canada
•      Canadian Council for Aviation & Aerospace (CCAA)
•      Carleton University
•      National Cadet & Junior Canadian Rangers Support Group, Canadian Armed Forces
•      Air Inuit
•      zag Creative

This document may be freely quoted and reproduced without permission from Elevate Aviation Ltd.
provided that the content remains the same and that the organization is acknowledged as the author.
Elevate Aviation Ltd. assumes no responsibility for its use or for the consequence of any errors or
omissions. This project has been funded by Canada’s Department for Women and Gender Equality;
however, this document does not necessarily reflect their views.
3

TABLE OF CONTENTS
 Acknowledgements ____________________________________________________ 2
 Executive Summary ____________________________________________________ 4
 Introduction __________________________________________________________ 5
 Methodology _________________________________________________________ 5
 Key Insights __________________________________________________________ 6
   Barriers to Entry __________________________________________________________ 6
   Beginning / Maintaining an Aviation Career ___________________________________ 15
 Conclusion __________________________________________________________ 22
 List of Figures _______________________________________________________ 23
 Appendix _____________________________________________________________ i
4
EXECUTIVE SUMMARY
Elevate Aviation delivered Creating Economic Security for Women through Aviation Careers
(“ESWA”), a nationwide project devoted to engaging partnerships and collaborations between
stakeholders and the public to discover and act in response to the specific obstacles that girls and
women face in fulfilling their economic potential within the aviation industry.
The Needs Assessment targeted the following objectives:
Identify factors that facilitate or inhibit female entry into the aviation profession, such as:
What is preventing women from realizing aviation as a career
What are the systemic barriers that affect women in the aviation industry
Identify problems females encounter when beginning and/or maintaining a profession in aviation,
such as:
Are confined workplaces conducive to women (e.g. flight deck, towers, etc.)
How does common language enrich or denigrate women in aviation
What are the physical/infrastructure barriers for women (e.g. bathrooms)
Identify knowledge gaps and develop strategies for collaboration to address issues of the gender
imbalance in the aviation industry
What percentage of women are in decision making roles as our project participants
What are the known/unknown gender equality issues that must be addressed
Build a plan that includes tactics related to marketing strategies, initiatives, and materials geared
to mitigate obstacles and challenges to engaging females in aviation
What are the current recruiting practices
What are the prevalent prejudices for women who are currently being promoted
Utilize project resources which can be directed towards developing and implementing feasible and
appropriate solutions including, but not limited to, implementing approaches to engage women in
the aviation industry
Key findings suggest that the largest barriers to female entry are lack of awareness and myth.
Educational institutions and caregivers are the gatekeepers to future talent pools, yet the largest gaps
in knowledge lay with them. Girls in air cadets and women already in the industry were quick to
dispel myths, such as math being a requisite skill, and are an excellent resource for future
recruitment. The optimum age to apprise girls of the opportunities available to them has proven to
be between the ages of 12-15, when they are formulating their career choices. However, there are
also many women who have just graduated from either high school or university, searching for viable
career opportunities, who are ready to begin training and merely need to be informed that they will
be welcomed to a dream career with open arms.
This project represents nationwide efforts to implement strategies that will enhance awareness and
opportunities for women in aviation, while expanding upon existing and creation of new policies,
services, decision-making processes, and programs.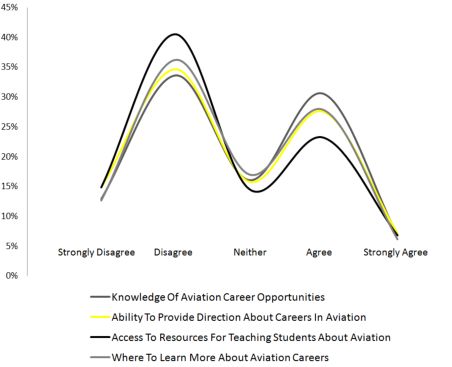
5

Canada’s Department for Women and Gender Equality commenced funding of the initiative in May
2018. A year-long participatory needs assessment was then conducted as reported here. The needs
assessment will inform discussions between stakeholders to develop activities across Canada.

INTRODUCTION
The lack of female participation in the aviation industry, particularly with regard to pivotal leadership
and executive roles has been the primary impetus to the overarching question as to what has caused
the gender imbalance phenomenon. Accordingly, systematic investigations into the contrast between
men and women in the aviation industry have been conducted to determine the underlying causes of
the imbalance, by spotlighting upon unseen or understudied issues, in addition to investigations of
the connections between specific qualities and characteristics.

For the purpose of this report, references to aviation, include aerospace and avionics as well as those
who work in the business side of the industry. In addition to our own study, pertinent literature has
also been considered and incorporated into this report, notwithstanding interdisciplinary research to
ensure a comprehensive exploration of the dilemma.

Pioneering, unbiased, and devoted partnerships were critical to the success of this project. Our
partners comprised a group of stalwarts who worked with us to synthesize the findings to provide
concise insight into the underpinnings of the gender imbalance phenomenon. They were asked to
examine their own organizations through a gendered-lens to identify obstacles within their services
that limit the ability of women to recognize their potential in aviation. Based upon the insights,
partners will be asked to commit to action in ways that will lead to more women participating in
aviation.

This project is a purposeful investigation conducted to facilitate improvements upon existing
practices and create change where needed within the industry. It is designed to provoke meaningful
thought and discussion, raise the visibility of key ideas and concepts, and offer a specific conduit of
investigation that avoids eliciting generalizations about the issue.

METHODOLOGY
There are a number of career opportunities in the aviation industry that can be filled by either men or
women, but far less women are applying for them. Women tend to hold the majority of the lower
paid jobs in the industry (flight attendants, administrative work, check-in agents). Despite previous
efforts of aviation professionals to recruit more women for higher level roles, it remains unclear why
many women do not enter the industry or their trajectory stalls at seemingly arbitrary points in their
careers.

Sampling covered over 5,000 respondents from across Canada, including young students (grades 9-
12), post secondary students, teachers and guidance counselors, air cadets, and industry
professionals, through surveys, interviews and focus groups to inform a cross-tabulation of gender
based, racial, and socio-economic information, examined against aviation specific knowledge,
perceptions, and influence to gain a better understanding of the determinants that might contribute
6

to differential treatment between sexes and to develop strategies to address paradigms and the
obstacles nested within them.

The study was designed in a naturalistic, emergent and purposeful manner. Situations were
documented as they unfold naturally in the real world, with a deliberate absence of predetermined
constraints on findings. Rigidity was avoided to facilitate response to opportunities and to follow new
paths of discovery as they surfaced.

Interviews and focus groups were established to further explore the data gathered from surveys and
to inform the socially constructed nature of reality, specifically to identify mindsets, policies, services,
decision-making processes, et cetera that present a hindrance to female participation within the
industry. During the focus groups, mindful attention to processes allowed for ongoing change to
promote situational dynamics. Interviewers were mindful of empathetic neutrality while working
with respondents to ensure understanding without judgment.

KEY INSIGHTS
The gender imbalance phenomenon is a complex issue with interdependencies and system dynamics
that necessitate a holistic perspective to gain a comprehensive understanding of the issue. Immersion
and exploration, guided by analytical principles rather than rules, both confirmed and revealed
patterns, themes, and inter-relationships posited in the hypothesis.

Barriers to Entry

Perceptions & Awareness

Outward appearance, stereotypes, and context play a pivotal role in the perception of the aviation
industry. These factors are shaped by individual motivations, emotions and cognition. It is clear
through not only our studies, but pragmatic observation that those closest to us influence our
motivations, emotions, and to a lesser extent, perhaps indirectly, that which affects cognition, with
our attitudes and norms solidifying during adolescence1.

The air cadets (“cadets”) surveyed were on average 14 years old and joined, on average, at the age of
12. 43% of them had heard about cadets through family and 37% of them through friends. The
average age a person obtains a social media account is 12 years old2, which upholds our data of only
1.7% of cadets having learned about it through social media. The average age of a parent of a child
aged 9-18 is 30-49 years old, of those parents, 78% use social media3. Therefore, it is likely that social
media campaigns creating a succession pipeline for future aviators through cadet programs would be
best geared toward parents and caregivers.

Of both male and female young students (grades 9-12) surveyed, approximately 39% were unaware
of careers in aviation. Those who did know, reported that they had learned about aviation from
school, had read about it, or had heard about it from a family member or family friend, spread almost

1
  https://faculty.cnr.ncsu.edu/nilspeterson/wp-content/uploads/sites/17/2016/12/Stevenson_etal_2016_EER.pdf
2
  https://www.cnn.com/2018/06/22/health/social-media-for-kids-parent-curve/index.html
3
  https://www.pewinternet.org/2018/03/01/social-media-use-in-2018/
7
equally across all three. Approximately 25% of both males and females had learned about it through
social media.
Females enrolled in post secondary said that they received career information from the internet,
parents/family and from teachers. 12% of females believed they were informed about careers in
aviation, stating that they learned about it from the internet, followed by school and then friends and
family.
Airplane pilot, flight attendant, and the Royal Canadian Air Force were the most commonly known
aviation jobs for post secondary females, while pilot and aerospace engineer were most common for
males. The disparity between sexes was relatively consistent for young females reporting more
awareness of careers such as flight attendant and ticket agent, while young males had heard more
about engineering and piloting jobs. Our interviews showed young females attributed their
knowledge of the careers available to school, family or the stereotypes conveyed to them by society.
When interviewed, many of the young women reported “just seeing” a pilot as a man and a flight
attendant as a young woman. Interestingly, none of them described age with the visual of the male
pilot, as they did for the flight attendant. One interviewee commented that she didn’t view being a
flight attendant or aviation in general as a long-term option because of the visual of a young flight
attendant, as she couldn’t see herself as a more mature woman in the role. It is worth noting that
visualization of the industry was a common theme for all of those interviewed.
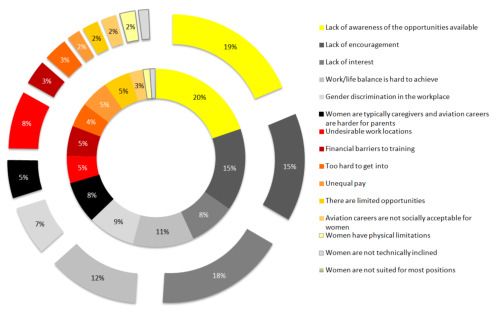
Figure 1 - Perceived Deterrents to Aviation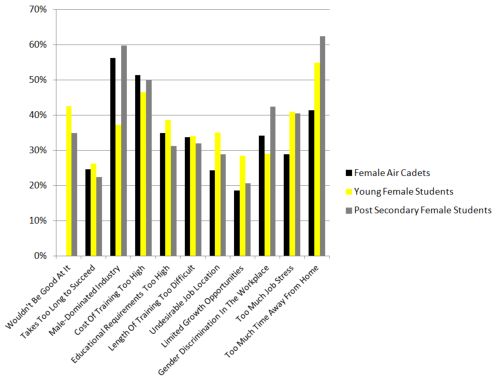
8

Post Secondary males and females agreed that the stereotypes came from society, followed by the
media and from grade school. 65% of post secondary females reported encountering gender
stereotypes in the major they were pursuing, of which 15% were deterred by the stereotypes. Of the
stereotypes, recognition was the leading factor, followed by opportunities for advancement and
unequal pay. There was a divide between those who believed gender would benefit them as far as
opportunities were concerned, in that 54% of females thought it would not and only 26% of males
felt the same. Both male and female post secondary students came in at approximately 40% wanting
to learn more about a career in aviation. 28% of females said they were interested in aviation as a
career, with travel opportunities being the number one reason, followed by financial opportunities
and feeling accomplished. Females were most interested in being a flight attendant, aerospace
engineer or working in flight crew, in contrast to males who expressed interest in aerospace engineer,
aircraft engineer or airplane pilot. Post secondary males and females agreed optimistically about job
availability, career development, growth opportunities, pension and benefits, and shared uncertainty
about being able to find the right role for themselves at approximately 50%. Females were slightly
less aware of scholarship and bursaries available and roughly 10% of them thought there were less
opportunities for all skill levels.

                    Figure 2- Belief Gender Discrimination Exists In The Aviation Workplace

As shown in Table 2, cadets showed a decreased belief in gender discrimination in the aviation
workplace, most likely because experience in the industry had disabused them of the notion,
although the belief was held at a percentage indicative of it being problematic. 50% of female cadets
believed that males don’t have to work as hard to be accepted in the industry and 57% of them
agreed there is a lack of social support for females in the industry. Only 15% of female cadets felt
they would gain acceptance into an industry they choose to work in, and nearly a third believed that
lack of support systems would be a barrier to their career.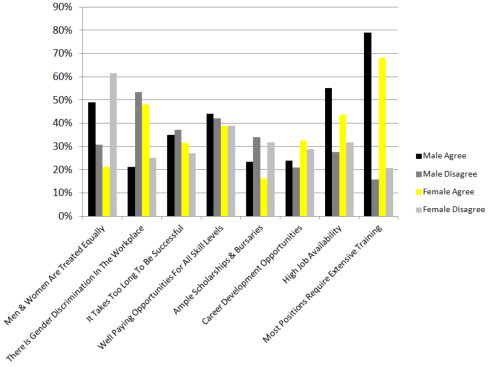
9

Both male and female cadets expressed uncertainty at an average of 17% that there is limited
opportunities for growth, equally at just over 50% that aviation is difficult to get into because of the
cost of training, and equally about the length of time it takes for career advancement or promotion at
54%. 59% of males felt there were lots of jobs available, while 51% of females felt the same. They
shared knowledge of bursary opportunities at 60%. 46% of females were unsure whether it was easy
to find the right role for themselves. 67% of males were confident they would obtain a career of their
choosing, while only 56% of females believed so.

Of the post secondary students surveyed, with an average age range of 17-25, and with the majority
of participants in their first year of study, 84% of females already had a major selected and 48%
reported they had discovered their career choice in high school. Women were shown to pursue
majors based on passion more heavily than males, though it was within the top reasons for both of
them. Males believed they were better at math and science, with less than half disagreeing that they
weren’t. Females came in with strong conviction at 72% disagreeing that males are better at it than
them. Similar ratios were found with beliefs in technical abilities; 28% of male and 20% female cadets
believed that males were more technically inclined.

                                Figure 3 - Belief Assertive Females Are Bossy

Female cadets and young students were not dissimilar in reporting top subjects as math,
English/writing and the arts. While males felt they excelled in math, science/history, and physical
education. Despite math coming in as top subjects for both sexes, males saw themselves as better at
it than females, much as both sexes had a tendency to believe males were more technically inclined.
Promisingly, over a third of males and females both felt they had believed these things in the past,
but their sentiments had changed over time, not dissimilar to perceptions about assertive females
(Table 3), where perceptions on how females lead or convey themselves prove to be optimistically
influenced by exposure to air cadet training. Which was affirmed by females cadets as they reported
the biggest benefit of joining cadets to be leadership skill development, followed by increased self
confidence. Social engineering or inability to transcend preconceived notions could explain why both
sexes continue to focus on certain subjects, as most adolescents were inclined towards what they
believed they had an aptitude for. Those beliefs rendered into vocational choices for young males as
computers and technology, followed by engineering, and young females for health care and medical,
followed by arts and communications. Recruitment campaigns that appeal to the aforementioned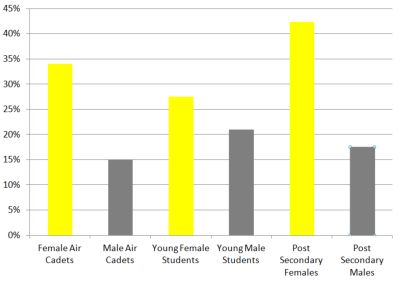
10

proclivities would likely be more successful than ones which challenged fundamental ideas of the self.
Despite a majority of young females reporting they had already decided what career they wanted to
pursue, 51% said they were interested in a career in aviation. 32% of female cadets said they planned
on pursuing a career in aviation, firstly as airplane pilots, followed by joining the Royal Canadian Air
Force. Lack of awareness as a barrier to aviation is further evinced by female cadet and non-cadet
females sharing top subjects of interest, illustrating that the difference between who pursues
aviation doesn’t lay in aptitudes.

The top factors young females and post secondary females seek in a career:

           1.   Making a positive impact upon the world/helping other people
           2.   Growth opportunities
           3.   Creativity & problem solving
           4.   Travelling, while also factoring in a work-life balance/long-term family planning
           5.   Team work and comradery
           6.   Meaningful connection between work and values
           7.   Salary

The majority of young student and post secondary females interviewed believed they could find most
of these desired conditions in a career in aviation, travelling being the most obvious one, but also
creativity through problem solving and working with new technology, financial security, and
opportunities for growth. In addition to the deterrents listed in Table 1, many of them felt that
downsides would include repetitiveness (such as having to sit for extended periods of time as they
envisioned a pilot doing) with long hours or shift work, being away from family, and working with
overtired passengers.

There is a clear need to show young females how their interests for the path they think might fulfill
them, could potentially translate much better into a lifelong passion in aviation, through not only air
cadet training, but also through other strategies, particularly as aviation itself evolves with the
participation of females applying creative talents and/or demonstrating their passion to change the
world for the better through helping people and the environment.

Systemic barriers

Professional Development in Education

Males and females employed in aviation spread evenly with the top three ways they became
interested in aviation as through a family member/family friend who worked in aviation, job posting,
or through a friend. Though all of the categories they learned of aviation were relatively the same,
save for school where almost double the number of males reported learning about it than females.
While some students change their career path during post secondary education (after learning of
more well-suited opportunities) the majority of career choices ossify in late adolescence, during high
school. Of those currently employed in aviation, males reported it as their first career choice at 44%,
while females reported it at 28%. For those who do not have a family member, friend, or happen to
stumble upon a job posting, the remaining avenues for them to learn about aviation careers have
predominantly been school, until the relatively recent advent of social media. Educators themselves
reported Facebook, Instagram and YouTube as their preferred top social media platforms.
11
We surveyed and interviewed nearly 500 teachers and guidance counselors nationally, who interact
with students in grades 4-12, with the majority of them interacting with grades 10-12. The average
age of educators was 35-44 years old, with 13-18 years of experience. For the most part they were
employed in public, non-faith based institutions.
One-on-one interviews with educators revealed that they value student career planning as integral to
their practice. Most of them actively reached out to students, developed repoir over time, and
encouraged them to select the appropriate courses in order to qualify for post-secondary
development for the path they were most well suited.
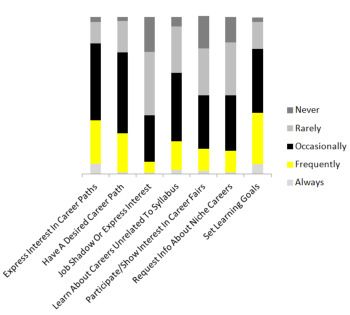
Figure 4 - Student Career Path Inquiry
Teachers and guidance counselors reported approaching students, providing handouts, and
facilitating presentations to inform them of career opportunities, and expressed an inclination to time
saving and easily presentable information, as opposed to careers where they had to reach out to
professional organizations or dig deeply for information. Some teachers pointed to ‘My Blueprint
Program’, and others to lunch n’ learns, dual-credit options, and organizations who approached the
schools in general as information sources for careers they would suggest to students.
The most common career aspirations for students were becoming a doctor, lawyer, or something else
that is well known for being prestigious and lucrative. However, youth who had spent more time
contemplating and researching the realities of pursuing the aforementioned professions had shown
greater interest in the trades over time, as they realized that some degrees are much less useful than
trade certification. Another common trend was for students to inquire regarding local industry, such
as fishing in coastal cities or energy, where oil and gas have a dominant presence. When students12
showed no definitive plans for their career, educators suggested exploring their interests by
volunteering for different organizations, and as post secondary enrollment approached, enrolling for
general courses at college, such as trades exploration programs. They also mentioned that they didn’t
view all post secondary institutions equally and there are some they would recommend above others.
Educators also stated that their schools maintain alumni networks, including a diverse group of
professionals, who serve as good role-models.
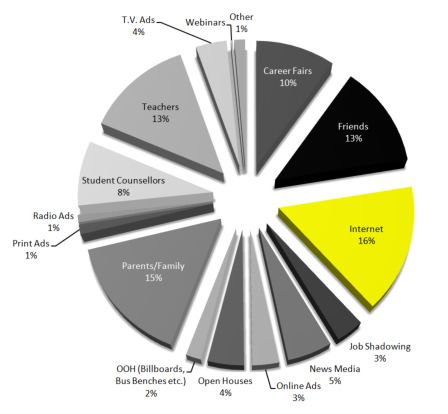
Figure 5 - How Educators Believe Students Obtain Career Information
With female educators being less informed about aviation than males, it becomes clearer why female
students aren’t learning about aviation in school as they are likely seeking out career advice, for the
most part, from female teachers. Schools provide mentorship programs and bring in professionals for
speaking engagements, however, because of the gender imbalance in aviation, it is unlikely that they
would have access to a great deal of female role models for aviation, without being connected to
organizations that have female mentorship programs or offers female speakers, such as Elevate
Aviation.
Educators shared many of the same views as their students on aptitude and skills for aviation as being
detail oriented, focused, organized, technical, and independent. Just as they shared ideas for what a13
career in aviation would be like describing it as exciting, interesting, rewarding, but also stressful and
being away from home a lot. Educators believed that students would be interested in the travel
opportunities, adventure, prestige (particularly for being a pilot), and that the salary and benefits
would be good.
Educators stated that they did suggest aviation careers to students, but when asked how much they
knew about aviation careers (Table 6), the majority disagreed that they were well-informed and had
the ability to provide direction about careers in aviation, with only 20-30% confident that they were
well-informed and knew where to find out more information.
Figure 6 - Educator Knowledge & Ability to Provide Aviation Information to Students
The gender imbalance issue was reported as important by educators. They believed the causes of it to
be:
Male dominated avenues of entry
Lack of awareness of opportunities
Lack of female role models
Possible discrimination against females
Deficiency in promotion of the industry to females14
Educators believed that field trips, speaking engagements, offering courses that appeal to females,
and raising awareness of it being a viable career option coming from female role models, would
increase female interest. They felt (as many students who were interviewed did) that there should be
more government funded programs or organizations acting as a conduit between the industry and
the schools who directly reached out to career counselors, as career counselors can offer unique
assistance for selection, application and financing processes, which parents are unlikely to do.
Recruiting practices
The aviation industry is not alone in its pursuit of female talent, virtually every other major industry in
Canada is also competing for it4, especially where demand is outstripping supply. This is exacerbated
by the talent drain caused by international contenders5. Human resources directors, VPs, managers,
and talent acquisition agents from aviation companies large and small across Canada were
interviewed to identify barriers to female participation in the industry.
All of the personnel interviewed reported recognizing the gender imbalance and that it worked both
ways, meaning that there were low numbers of males in certain roles, such as flight attendants, just
as there were low numbers for women as pilots and air traffic controllers.
Companies reported recruitment through external websites such as AVCanada, a website dedicated
to aviation job opportunities, or posting to Indeed or LinkedIn, internal websites, job fairs, aviation
programs, community colleges, universities, indigenous groups, word of mouth, air shows, and that in
recent years they looked to Elevate Aviation with its impressive network of females across Canada
and comprehensive mentorship program for recruitment.
HR personnel suggested the following solutions to ameliorate the shortage of female applicants:
Promotion, outreach, and awareness campaigns facilitated by government and industry
leaders
Acting on educational advisory boards
Career Fairs
Ensuring no artificial barriers on job postings (e.g. indicating physical demands that aren’t
actually necessary for the job6)
Training sponsorship solutions (airlines currently concerned that they will train staff who will
leave shortly thereafter for other carriers)
Sharing success stories through school visits and social media
Increasing circulation of trade publications
Hands-on experiences (such as NAV Canada summer camps and Elevate’s cross-country tours,
and the Elevate Aviation Learning Centre)
Advertisement of aviation lifestyle (e.g. promoting specific and unique benefits to females)
Raising awareness of scholarships opportunities
Differentiation strategies (e.g. appealing to Canadian women’s roots7)
4
https://www.pwc.com/gx/en/about/diversity/iwd/iwd-female-talent-report-web.pdf
5
https://simpleflying.com/china-is-a-driving-factor-behind-the-worlds-pilot-shortage/
6
https://www.hirefortalent.ca/images/pdf/tools/4.3_How-to-Write-an-Inclusive-Job-Posting_EN.pdf
7
https://apex.aero/2016/10/19/brand-apart-asia-airlines-capitalize-product-differentiation15
Beginning / Maintaining an Aviation Career
Industry employed males and females viewed barriers to entry relatively the same, save for
perception of female interest in aviation (Table 7), in which case males belief that females aren’t
interested may also serve as a barrier as they might initially neglect to convey opportunities to them
for this reason. Females came in at 77% that they knew nothing/a little about aviation before
beginning their career, while 64% of males said the same. Pursuit of passion was the primary impetus
for both males and females for entering the field. The second reason for females was “falling into it
by chance”, while the second reason for males was “opportunity to use my technical skills”. They
agreed about education requirements, length of training, cost of training, degree of difficulty in
advancement, the length of time required away from home, desirability of job locations, job stress,
opportunities for growth, and that there were excellent benefits/pension plans.
Figure 7 - Beliefs of Why Women Are A Minority
Male Beliefs
Female Beliefs
Currently employed males and females learned of career opportunities relatively the same, except for
females learning slightly more from internal job boards, where it was a tie for that and external
postings for men.16
No disparities between sexes were reported for onboarding procedures and companies exhibited
thoughtful training and orientation approaches, both for welcoming an employee to the company
generally as well as preparing them for a specific position.
Workplace environment
With respect to perception of women in the industry there was a wide range of replies from HR
personnel (a female dominated field), that gave the impression of a chilly-climate such as considering
females “underdogs”, “having to work harder to prove themselves”, “skepticism at first that goes
away after they prove themselves”, older males treating them “like daughters”, possible “stigma
around pregnancy”, and “being seen as weak”. HR personnel also observed males socializing (or
bonding/team building) together outside work hours in male dominated activities such as playing
hockey, where female coworkers might feel excluded. In comparison to the testimonials from HR,
surveys show that 20% of males feel females need to work harder than they do to be promoted
(same as with corporate culture acceptance), while 70% of females believed the same. Optimistically,
women were also reported to be perceived by employers as bringing unique and valuable skill sets
and managers noticed that when there was a relatively equal mix of both genders, work
environments improved. For the most part (85% on average) industry employees had no preference
for which sex they worked with, but those who did, were women preferring men at 14.3% followed
by other females at 2%, and males preferring females at 7% and other males at 4%.
Figure 8 - Disparities In Male & Female Perceptions17
The chilly-climate will need to be tackled through not only gender bias training, but also by providing
females with coping strategies8 such as promoting self-efficacy and highlighting motivational features
to them while progress is being made, which will also help to mitigate negative perceptions (both
inside and outside the industry) concomitantly.
Figure 9 - My Workplace Takes Bullying & Harassment Seriously
Figure 10 - My Workplace Has A Clear Policy For Intimidation & Harassment
8
https://www.researchgate.net/publication/259921330_The_experience_of_women_in_male-
dominated_occupations_A_constructivist_grounded_theory_inquiry18
The findings of male and female views on workplace harassment (Tables 9 and 10) substantiate
aforementioned claims of negative perceptions and experiences by illustrating lack of awareness
respectively. Thankfully the margins are undauntingly narrow, and increasing awareness of the
policies (such as circulating updates or reminders through companywide newsletters) would likely
improve them quickly.
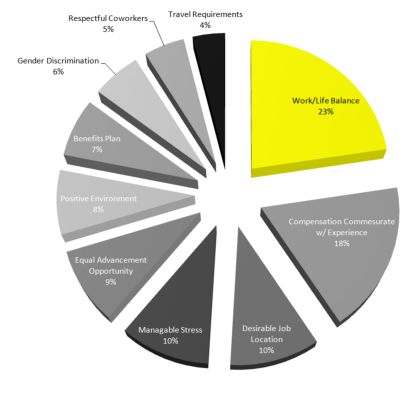
Figure 11 - Room For Improvement (Dissatisfactions of Women In Aviation)
HR personnel felt key strategies for ameliorating women’s dissatisfaction with work/life balance
would include:
Flex schedules
Casual positions
Increased regional flying for those who have children (so they can be home more)
Compensation being commensurate with experience is indicative of females feeling undervalued,
however a multivariate analysis9 is necessary to determine whether there is actually a pay gap related
9
https://www.cambridge.org/core/books/multivariable-analysis/DBE7816A781AEF53108FD721199B4AC919
to sexism. A true gender pay gap would comprise of all other things being equal for a male and a
female such as seniority, experience, certification etc and the female still being paid less than the
male. 33% of females reported being part of a union, while 42% of males reported being part of one.
However, 50% of the females had been employed in the industry 0-12 years, the majority of them
holding roles as administrator, flight attendant, and flight crew. Whereas the majority of men had
been employed 3-20+ years and held roles as pilot, flight service specialist, tower air traffic controller,
and aircraft engineer.
Physical/Infrastructure
An inclusive and safe working environment benefits the entire workforce. For male-dominated
industries this means having a physical working environment, including uniforms and safety
equipment that is gender encompassing and meets the needs of a diverse workforce.
Figure 12 - Workplace Physical Facilities Accommodating Gender
Our findings regarding adequate facilities such as separate restrooms in the workplace indicated no
remarkable problems exist for females. Though the small amount of uncertainty could indicate room
for innovation to go above and beyond standards. Common language was not found to denigrate
women in aviation.
Women in Technical, Leadership and Board Roles
The aviation industry has demonstrated a strong commitment to diversity for well over the past
decade. All of our partners support numerous advocacy groups for diversity and inclusion in aviation.
In 2019 NAV Canada10, Air Canada, Boeing Canada, Jazz Aviation, and Vancouver Airport Authority
were named as Canada’s Best Diversity Employers11. Larger carriers such as WestJet and Air Canada
have pledged to the Catalyst Accord 2022: Accelerating the Advancement of Women, where they will
10
https://content.eluta.ca/top-employer-nav-canada
11
https://www.canadastop100.com/diversity/20
accelerate the advancement of women by increasing the number of women in executive roles to 30%
or greater by 202212. “The Sky’s No Limit – Girls Fly Too!” facilitated by Canadian Council for
Aerospace & Aviation welcomes over 15,000 participants, has won several international awards, and
set three world precedents as the largest single outreach of its kind13. These examples are only a
handful of the affirmative action campaigns and initiatives that the aviation industry has both
supported and lead to create momentous change. However, the numbers of female participation are
still unacceptably low and there is a clear need to do even more.
Technical Roles
Focus group participants affirmed statistics that lack of
awareness outside the industry is the leading cause for
the gender imbalance. Female pilots, engineers, air “The puzzle. Being in the trenches and
traffic controllers and the like had generally received coming out of it like, wow, we did it.” –
unique hands-on experiences such as discovery flights14 Engineer
or had a father who was an aircraft engineer and
brought them to the job site, which ignited a passion for
aviation within them. The majority of them agreed that
educational institutions had failed to convey the multitude of the opportunities available to them and
that there needs to be much more work done in this regard through government and industry funded
organizations that have the ability to reach out to educational institutions on a more individual level.
Funding for flight training was a reoccurring theme for reasons including incongruities province by
province and that it is not recognized the same way university education is, as far as taking out
student loans are concerned.
Those who had experienced sexism on the job
“I love looking outside at all the lights I’ve developed coping mechanisms like being “able to play
lined up.” – ATC with the boys” and persevered, as their “love” for the
job far outweighed any negative experiences. For those
who found their work environment to be unbearable
because of sexism, they chose to change employers, instead of occupations. Putting negative
experiences back on the employer, by attributing the problem to mismanagement, affecting organic
progression for their female successors.
Many of the female focus group participants had started in things like cargo and worked their way up
through flight ops to dispatch or had similar steps (often about three steps from being in their ideal
position). Having learned about the opportunities later in life, many of the participants had also
begun a career in aviation as their second or third career. Those who had pursued things like air
traffic control but failed to qualify for a license reported being offered other opportunities, which
they found fulfilling. Participants agreed that the industry had changed over time and now
demonstrated a strong desire to “keep their people”. Recognition of personal strengths and
achievements fostered loyalty for them.
12
https://www.catalyst.org/solution/catalyst-accord-2022-accelerating-the-advancement-of-women/
13
http://www.avaerocouncil.ca/events/sky%E2%80%99s-no-limit-%E2%80%93-girls-fly-too
14
An introductory flight on an aircraft where one is able to pilot the plane21
They felt resilience, determination, confidence, gratitude, adaptability, troubleshooting, and being
solution oriented were the requisite skills for their jobs.
As pay is often based on flight time, some female pilots felt they had to sacrifice it to be home with
their children, so it is worth exploring how this could be ameliorated. Some of them also felt it was
difficult to juggle shift work with child care, but others had found ways to solve this problem and
were happy with unorthodox work hours for reasons such as “never having to go to Costco on a
Saturday”. Having to relocate to undesirable locations was also an issue for some, but not an
overarching theme. It would be worthwhile to explore creative options in this regard, as this
sentiment also surfaced as a deterrent to young females for the industry.
Leadership & Board Roles
Teara Fraser, CEO of Iskwew Air15, the first Canadian “Am I losing progression? Am I losing pay?
Indigenous female to launch an airline, began her career How do I find a way not to do that?
as a commercial pilot. She then built an aerial survey Nobody is going to do it for us, we just
operation and established the Aviation Leadership have to figure it out.” – Senior Exec
Foundation. She holds a Master of Arts in Leadership
degree from Royal Roads University and is a Certified
Executive Coach. Female focus group participants unanimously agreed that leadership training and
development is the number one path to executive and c-suite positions.
Women are facing increased difficulty reconciling roles; child care and work/life balance are major
factors in women’s pursuit of executive roles as they feel they have to sacrifice one for the other.
Focus group participants believed many of the jobs could be accomplished via telecommuting, cutting
out commute time, expenses associated with having to physically attend the workplace, and enabling
them to be more efficient. Telecommuting also saves employers overhead and other resources.
Females who did rise through the ranks had mentors to
elucidate the big picture and guide them. Mentorship is
“We need to be teaching each other that a proven key to leadership training and development.
there is a leader in every chair.” – Senior Supporting women in their development also entails
ATC creating clear and transparent career tracks to avoid
“career labyrinths”. Recognition and inclusive
workplaces that align with core values tackle the “sticky
floor” and help women rise from low-paying, low-mobility positions such as clerical and
administrative positions.
Many of the females interviewed felt they needed to take more risk and stated that they had the
impression of old boys’ clubs, or difficulty working up nerve to ask for mentorship. Illustrating a need
for the institutionalization of proactive mentorship programs which help females to strategically
navigate organizational politics and muster up the confidence to speak up when it’s important to do
so, particularly at pivotal decision points16.
15
https://www.cbc.ca/news/canada/british-columbia/canada-s-1st-female-founded-indigenous-airline-launches-on-
international-women-s-day-1.5049422
16
https://www.forbes.com/sites/margiewarrell/2017/06/24/women-mentoring/#7cae663622db22
Supporting females also entails supporting critics of initiatives designed to further their careers in
helping them to understand that it isn’t a matter of tokenism or an attack on meritocracy. Female
empowerment is certainly a benefit to enabling women secure traditionally male dominated
positions for a variety of reasons, but an added benefit proven by studies shows that firms with
female leaders have increased sales revenues and certain dimensions of market performance17.
CONCLUSION
Aviation and women share two profound things; they are both inextricably linked to people’s lives
and their futures are unwritten. When the average person thinks of aviation they think of an airplane
and a pilot, however aviation touches every part of our lives and is essential to the success of the
mining industry, fisheries, surveying, national defense, emergency services, tourism, global trades
and more. It employs not only trades people, but lawyers, accountants, marketing professionals and
virtually every career you can think of. Annually it contributes nearly $25 billion to the GDP and
employs an estimated 190,000 people18 directly.
Aviation has had a long history, yet in many ways, is still in its infancy. Future generations may look at
Tesla’s Roadstar crossing the orbit of mars19 as simply as we do flying a kite now. Flying vehicles have
been prophesized countless times in science fiction and currently Uber is working toward
transforming the world through aerial ridesharing planned for 202320. As concern for the well being
of our planet and our curiosity for what exists beyond it grows, we will continue to look to aviation
for answers.
A community benefits by sharing the responsibility for guiding a girl toward a career that will suite
her unique talents, fuel her passion, and give fulfillment, while also ensuring economic prosperity.
The outcome of the needs assessment has demonstrated that aviation is often overlooked as a career
choice because of myths that can be dispelled and lack of awareness that can be remediated by
educating teachers, guidance counsellors, and caregivers. A wide range of factors influence a female’s
career choice, with some factors being more significant than others, such as the age ideas are
presented, where they come from, and how they are presented. Girls enrolled in high school and
women who have recently graduated, hold great promise in mitigating the industry-wide looming
labour shortage. Women in the industry and those enrolled in air cadets, are excellent role models
that can share a world that was previously unknown to those seeking career direction. The industry
will need 55,000 new workers by 202521, accordingly time is of the essence to ensure synchronization
of women’s availability with the gap in the labour pool, as they will guarantee a talent pipeline for the
industry.
With the shared vision of its partners, Elevate Aviation will continue to invest and expand upon its
existing programs and undertake new ventures to crystallize the path for Canadian women to achieve
their dreams of flying, so that Canadian women can in turn make salient contributions to the future
of the aviation industry and the Canadian economy.
17
https://journals.sagepub.com/doi/10.1177/0149206316628643
18
https://aiac.ca/industry-statistics/
19
https://www.space.com/42337-spacex-tesla-roadster-starman-beyond-mars.html
20
https://www.uber.com/ca/en/elevate/
21
CCAA Labour Market Information Report, Aviation and Aerospace Industries March 201823 LIST OF FIGURES Figure 1 - Perceived Deterrents to Aviation ............................................................................................. 7 Figure 2- Belief Gender Discrimination Exists In The Aviation Workplace ............................................... 8 Figure 3 - Belief Assertive Females Are Bossy .......................................................................................... 9 Figure 4 - Student Career Path Inquiry ................................................................................................... 11 Figure 5 - How Educators Believe Students Obtain Career Information ................................................ 12 Figure 6 - Educator Knowledge & Ability to Provide Aviation Information to Students ........................ 13 Figure 7 - Beliefs of Why Women Are A Minority ................................................................................. 15 Figure 8 - Disparities In Male & Female Perceptions ............................................................................. 16 Figure 9 - My Workplace Takes Bullying & Harassment Seriously ........................................................ 17 Figure 10 - My Workplace Has A Clear Policy For Intimidation & Harassment ...................................... 17 Figure 11 - Room For Improvement (Dissatisfactions of Women In Aviation) ...................................... 18 Figure 12 - Workplace Physical Facilities Accommodating Gender ....................................................... 19
i

            APPENDIX

            Air Cadet Surveys – 2,441 total responses

            Age Range with gender breakdown

                                             AGE                                                                 GENDER
            =====================================================================                          ===================

TOTAL            12          13           14           15            16            17             18         Male           Female
---------     ---------   ---------    ---------    ---------     ---------     ---------      ---------    ---------       ---------

  2441            256         391          412           399          329            260           217         1424              769
100.0%         100.0%      100.0%       100.0%        100.0%       100.0%         100.0%        100.0%       100.0%           100.0%
 87.5%          89.8%       91.6%        88.3%         86.2%        86.3%          87.7%         82.5%        88.4%            85.8%
 12.5%          10.2%        8.4%        11.7%         13.8%        13.7%          12.3%         17.5%        11.6%            14.2%

            Geographic Region

                                           REGION
            =====================================================================

                                                                                Net          Nunavut
                BC           AB       MB/SK        Ontario      Quebec        Atlantic      NWT/Yukon
              ---------   ---------   ---------    ---------    ---------     ---------       ---------

                  339         262         191          849          370           158                 18
               100.0%      100.0%      100.0%       100.0%       100.0%        100.0%            100.0%
                99.4%       99.2%      100.0%        99.8%        30.8%         98.1%             88.9%
                 0.6%        0.8%                     0.2%        69.2%          1.9%             11.1%
ii
Position Held
AGE GENDER
===================================================================== ===================
TOTAL 12 13 14 15 16 17 18 Male Female
--------- --------- --------- --------- --------- --------- --------- --------- --------- ---------
Total Answering 2151 248 379 383 380 314 246 196 1355 742
100.0% 100.0% 100.0% 100.0% 100.0% 100.0% 100.0% 100.0% 100.0% 100.0%
Air Cadet (AC) 12.4% 52.0% 16.6% 12.5% 4.2% 1.3% 0.8% 2.0% 13.4% 10.9%
Leading Air Cadet 15.0% 47.2% 33.8% 9.9% 6.3% 3.2% 1.2% 0.5% 14.5% 16.0%
(LAC)
Corporal (CPL) 17.6% 0.4% 48.0% 34.5% 11.8% 3.8% 0.4% 2.6% 19.2% 15.4%
Flight Corporal (FCPL) 16.5% 1.6% 41.8% 35.5% 9.9% 7.3% 2.0% 16.1% 16.6%
Sergeant (SGT) 14.8% 0.4% 0.8% 40.8% 37.9% 11.8% 5.6% 15.1% 14.4%
Flight Sergeant (FSGT) 11.9% 0.3% 1.3% 36.0% 43.1% 15.3% 10.6% 13.7%
Warrant Officer Second 8.1% 8.0% 27.6% 41.3% 8.0% 8.6%
Class (WO2)
Warrant Officer First 3.7% 0.3% 7.7% 30.6% 3.2% 4.3%
Class (WO1)
No Answer 290 8 12 29 19 15 14 21 69 27iii
Ethnic Background
AGE
=====================================================================
TOTAL 12 13 14 15 16 17 18
--------- --------- --------- --------- --------- --------- --------- ---------
Total Answering 2211 253 383 398 393 320 251 207
100.0% 100.0% 100.0% 100.0% 100.0% 100.0% 100.0% 100.0%
African 3.4% 2.4% 3.4% 3.3% 2.5% 2.8% 4.4% 5.3%
British 15.1% 13.4% 12.8% 11.8% 14.5% 18.4% 19.1% 17.9%
Canadian/French Canadian 50.3% 57.7% 48.6% 48.0% 48.9% 50.9% 48.2% 53.1%
Central/South American or 4.7% 4.3% 5.7% 4.5% 4.3% 4.1% 3.6% 6.3%
Caribbean
East or Southeast Asian 23.1% 22.1% 23.5% 22.6% 22.6% 24.1% 24.7% 21.7%
Indigenous/Aboriginal/First 3.3% 3.6% 3.9% 1.8% 2.0% 4.1% 3.6% 5.3%
Nations/Métis
South Asian 9.7% 9.1% 11.5% 11.3% 11.2% 8.8% 8.4% 4.8%
Southern or Eastern 8.7% 10.3% 9.1% 6.8% 8.7% 8.8% 11.6% 6.8%
European
West Asian or Middle 2.3% 2.8% 1.0% 1.8% 2.8% 1.9% 3.6% 3.4%
Eastern
Western European 8.7% 7.9% 10.2% 7.3% 6.9% 8.8% 11.6% 9.7%
Prefer Not to Answer 1.9% 0.4% 1.3% 1.8% 2.0% 2.2% 1.6% 4.8%
Other 2.3% 4.0% 1.3% 3.8% 2.3% 1.6% 1.2% 1.4%
No Answer 230 3 8 14 6 9 9 10iv
Young Student Surveys and Interviews – 859 total responses (only survey response data captured in
tables)
Grade of Student
GRADE GENDER
=================================== =================
TOTAL Grade 9 Grade 10 Grade 11 Grade 12 Male Female
-------- -------- -------- -------- -------- -------- --------
(A) (B) (C) (D) (E) (F) (G)
Total Answering 846 203 193 225 225 425 419
100.0% 100.0% 100.0% 100.0% 100.0% 100.0% 100.0%
Grade 9 24.0% 100.0% 23.3% 24.6%
Grade 10 22.8% 100.0% 21.9% 23.6%
Grade 11 26.6% 100.0% 28.9% 24.3%
Grade 12 26.6% 100.0% 25.9% 27.4%
Geographic Region
REGION
==================================================================
Net Nunavut/
BC AB MB/SK Ontario Quebec Atlantic NWT/Yukon
-------- -------- -------- -------- -------- ---------- ----------
(H) (I) (J) (K) (L) (M) (N)
102 68 337 141 60 2
100.0% 100.0% 100.0% 100.0% 100.0% 100.0% 100.0%
27.9% 19.6% 23.5% 20.2% 31.2% 26.7% 50.0%
22.8% 24.5% 23.5% 24.3% 19.1% 20.0%
25.7% 26.5% 25.0% 24.9% 29.8% 31.7% 50.0%
23.5% 29.4% 27.9% 30.6% 19.9% 21.7%v
Ethnic Background
GRADE
===================================
TOTAL Grade 9 Grade 10 Grade 11 Grade 12
-------- -------- -------- -------- --------
(A) (B) (C) (D) (E)
Total Answering 845 203 193 225 224
100.0% 100.0% 100.0% 100.0% 100.0%
Caucasian/White 39.3% 41.9% 34.2% 43.1% 37.5%
Canadian/French Canadian 36.4% 34.5% 37.3% 40.0% 33.9%
East or Southeast Asian 10.9% 9.9% 11.9% 6.7% 15.2%
British 10.8% 12.8% 7.8% 11.1% 11.2%
South Asian 5.4% 3.9% 7.3% 5.8% 4.9%
Western European 4.7% 4.4% 3.1% 6.2% 4.9%
Indigenous/Aboriginal/First 4.4% 4.9% 4.7% 2.7% 5.4%
Nations/Métis
Southern or Eastern European 4.0% 2.0% 5.2% 3.6% 5.4%
African 3.8% 4.4% 2.1% 4.0% 4.5%
Central/South American or 3.1% 4.9% 2.6% 1.3% 3.6%
Caribbean
West Asian or Middle Eastern 1.5% 1.0% 1.6% 1.8% 1.8%
Prefer Not to Answer 1.7% 1.5% 2.1% 1.3% 1.8%
Other 1.3% 1.0% 0.5% 2.2% 1.3%
No Answer 1 - - - 1vi
Post Secondary Student Surveys and Interviews – 1,140 (only survey response data captured in tables)
Main Area of Study
AGE GENDER
========================== =================
TOTALvii
Ethnic Background
AGE GENDER
========================== =================
TOTALviii Teacher/Guidance Counselor Surveys & Interviews - 432 total responses (only survey response data captured in figures) Age Range Gender Identity
ix

Geographic Region
x

Subjects Taught Most Often
xi

Industry Professionals Group Surveys and Focus Groups - 1,428 (only survey response data captured in
tables)

      Age Breakdown

                                                            AGE
                                   =====================================================

                      TOTAL        18–24        25–34       35–44       45–54        55–64         65+
                      --------     --------     --------    --------    --------     --------     --------
                             (A)          (B)         (C)         (D)          (E)          (F)         (G)

        Total            1360           98         350         329         339          200            43
        Answering      100.0%      100.0%       100.0%      100.0%      100.0%       100.0%       100.0%
        Male            48.2%       42.9%        39.7%       42.9%       49.6%        66.0%        76.7%
        Female          51.5%       57.1%        60.0%       56.5%       50.1%        34.0%        23.3%
        Other            0.3%                     0.3%        0.6%        0.3%
        No Answer           8              1         1           2           2                -          1
xii
Ethnic Background
AGE GENDER
================================================ ==============
===== ===
TOTAL 18–24 25–34 35–44 45–54 55–64 65+ Male Female
-------- -------- -------- -------- -------- -------- -------- -------- --------
(A) (B) (C) (D) (E) (F) (G) (H) (I)
Total Answering 1351 96 346 329 339 197 43 649 696
100.0% 100.0% 100.0% 100.0% 100.0% 100.0% 100.0% 100.0% 100.0%
Canadian/French 48.8% 39.6% 48.8% 46.5% 51.0% 51.8% 53.5% 50.2% 47.6%
Canadian
Caucasian/White 44.3% 38.5% 50.6% 49.8% 42.8% 32.5% 32.6% 42.7% 46.1%
British 16.1% 15.6% 14.2% 11.6% 17.4% 20.3% 37.2% 19.0% 13.5%
Western European 7.0% 7.3% 6.6% 7.3% 6.5% 8.6% 4.7% 8.0% 6.2%
Southern or Eastern 6.8% 7.3% 8.4% 4.9% 5.9% 9.1% 4.7% 6.8% 6.8%
European
East or Southeast 5.0% 17.7% 4.6% 5.2% 3.5% 2.5% 2.3% 4.9% 5.2%
Asian
South Asian 3.8% 4.2% 6.9% 4.9% 1.8% 0.5% 3.7% 3.9%
Central/South 3.3% 4.2% 4.9% 3.3% 3.2% 1.0% 2.9% 3.7%
American or
Caribbean
Indigenous/Aborigin 2.4% 1.0% 3.8% 2.1% 2.1% 2.0% 2.3% 2.6% 2.3%
al/First Nations/Métis
Prefer Not to Answer 2.0% 1.0% 0.9% 1.8% 2.9% 3.0% 2.3% 1.8% 2.0%
African 1.9% 5.2% 2.6% 2.7% 0.3% 1.0% 1.8% 1.9%
West Asian or 1.4% 2.1% 1.7% 2.1% 0.9% 0.5% 1.2% 1.6%
Middle Eastern
Other (please 2.0% 2.1% 2.9% 0.3% 2.7% 1.5% 4.7% 1.4% 2.4%
specify)
No Answer 17 3 5 2 2 3 1 7 4xiii
Level of Education
AGE GENDER
================================================= ===============
==== ==
TOTAL 18–24 25–34 35–44 45–54 55–64 65+ Male Female
-------- -------- -------- -------- -------- -------- -------- -------- --------
(A) (B) (C) (D) (E) (F) (G) (H) (I)
Total 1330 96 342 327 327 194 43 636 688
Answering 100.0% 100.0% 100.0% 100.0% 100.0% 100.0% 100.0% 100.0% 100.0%
GED 1.1% 3.1% 1.2% 0.3% 1.2% 1.0% 2.3% 1.4% 0.9%
High School 12.3% 18.8% 10.2% 11.9% 9.5% 13.9% 30.2% 12.7% 11.6%
Graduate
Some 45.0% 55.2% 43.6% 45.6% 43.4% 46.9% 30.2% 47.0% 43.2%
College
Bachelor's 32.0% 20.8% 40.1% 33.3% 34.6% 21.6% 11.6% 28.1% 35.8%
Degree
Master's 9.6% 2.1% 5.0% 8.9% 11.3% 16.5% 25.6% 10.7% 8.6%
Degree
No Answer 38 3 9 4 14 6 1 20 12
Length of Time in Industry
AGE GENDER
===================================================== =================
TOTAL 18–24 25–34 35–44 45–54 55–64 65+ Male Female
-------- -------- -------- -------- -------- -------- -------- -------- --------
(A) (B) (C) (D) (E) (F) (G) (H) (I)
Total 1314 94 341 323 322 192 42 623 685
Answering 100.0% 100.0% 100.0% 100.0% 100.0% 100.0% 100.0% 100.0% 100.0%xiv
Position Held
AGE GENDER
===================================================== =================
TOTAL 18–24 25–34 35–44 45–54 55–64 65+ Male Female
-------- -------- -------- -------- -------- -------- -------- -------- --------
(A) (B) (C) (D) (E) (F) (G) (H) (I)
Total 1321 94 340 324 326 195 42 630 685
Answering 100.0% 100.0% 100.0% 100.0% 100.0% 100.0% 100.0% 100.0% 100.0%
Administrator 9.6% 6.4% 9.4% 8.0% 9.2% 12.8% 19.0% 6.8% 12.3%
Airplane Pilot 7.7% 16.0% 13.5% 7.7% 3.7% 1.5% 2.4% 12.5% 3.4%
Flight 5.6% 8.5% 4.4% 6.2% 6.1% 5.6% 8.4% 3.1%
Service
Specialist
Tower Air 5.1% 1.1% 3.2% 7.4% 8.0% 2.6% 7.3% 3.1%
Traffic
Controller
Airline Flight 4.8% 12.8% 8.5% 3.7% 2.5% 0.5% 2.4% 1.6% 7.7%
Attendant
Aircraft 4.2% 3.2% 4.1% 3.4% 3.7% 6.2% 9.5% 7.1% 1.5%
Engineer
Maintenance 3.9% 8.5% 5.0% 3.1% 2.8% 3.1% 4.8% 4.9% 3.1%
Technician
(Mechanic)
Airport 3.5% 3.2% 3.5% 6.2% 2.5% 1.5% 3.8% 3.2%
Operations
Flight Crew 3.3% 6.4% 5.9% 1.2% 3.4% 1.5% 2.2% 4.4%
Business 2.4% 3.2% 2.8% 2.8% 1.0% 2.4% 1.1% 3.6%
Aviation
Aerospace 2.3% 1.5% 2.5% 2.8% 3.1% 7.1% 2.1% 2.6%
Engineer
Centre Air 1.4% 1.8% 2.5% 1.2% 0.8% 1.9%
Traffic
Controller
Helicopter 0.8% 1.1% 0.9% 0.3% 1.2% 0.5% 2.4% 1.1% 0.6%
Pilot
Airline Ticket 0.8% 0.9% 0.3% 1.8% 1.5%
Agent
Ground 0.7% 5.3% 0.6% 0.3% 0.3% 1.3% 0.1%
Crew
Security 0.5% 1.1% 0.3% 0.9% 0.3% 0.5% 0.6% 0.3%
Airport 0.1% 0.5% 0.2%
Baggage
Handler
Canadian 0.1% 0.3% 0.2%
Forces
Other 43.1% 26.6% 33.2% 43.5% 47.5% 59.0% 50.0% 37.9% 47.7%
(please
specify)
No Answer 47 5 11 7 15 5 2 26 15You can also read