Monmouth Real Estate Investment Corporation - NYSE: MNR September 2021 Investor Presentation

Page created by Seth Marshall
 
CONTINUE READING
Monmouth Real Estate Investment Corporation - NYSE: MNR September 2021 Investor Presentation
Monmouth Real Estate
Investment Corporation
  A Public REIT Since 1968

     September 2021
  Investor Presentation

       NYSE: MNR
Monmouth Real Estate Investment Corporation - NYSE: MNR September 2021 Investor Presentation
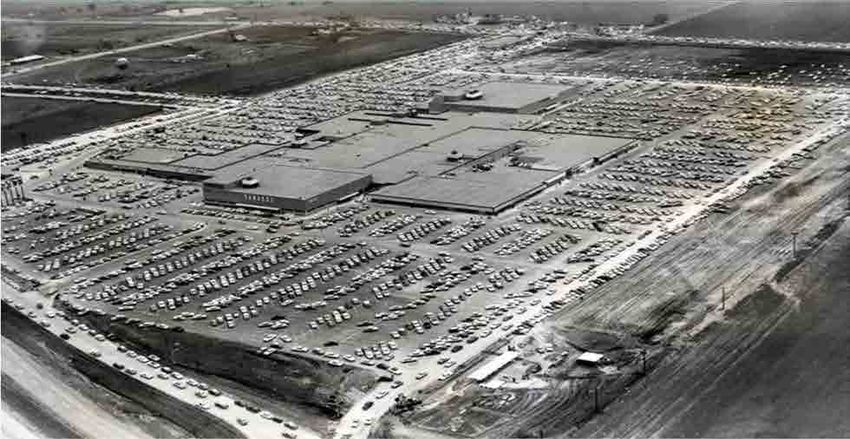
This presentation may contain forward‐looking statements within the meaning of Section 27A of the Securities Act of 1933, as
amended, Section 21E of the Securities Exchange Act of 1934, as amended. Forward‐looking statements provide Monmouth Real
Estate Investment Corporation’s current expectations or forecasts of future events. Forward‐looking statements include statements
about Monmouth’s expectations, beliefs, intentions, plans, objectives, goals, strategies, future events, performance and underlying
assumptions and other statements that are not historical facts. You can identify forward‐looking statements by their use of
forward‐looking words, such as “may,” “will,” “anticipate,” “expect,” “believe,” “intend,” “plan,” “should,” “seek,” or comparable
terms, or the negative use of those words, but the absence of these words does not necessarily mean that a statement is not
forward‐looking. The forward‐looking statements are based on Monmouth’s beliefs, assumptions and expectations of its future
performance, taking into account all information currently available to it. Forward‐looking statements are not predictions of future
events. These beliefs, assumptions and expectations can change as a result of many possible events or factors, not all of which are
known to Monmouth. Some of these factors are described under the headings “Risk Factors” and “Management’s Discussion and
Analysis of Financial Condition and Results of Operations” as included in Monmouth’s Annual Report on Form 10‐K for the fiscal year
ended September 30, 2020, its Quarterly Reports on Form 10‐Q for the quarterly periods ended June 30, 2021, March 31,2021, and
December 31, 2020, and its other periodic reports filed with the Securities and Exchange Commission, which are accessible on SEC’s
Electronic Data Gathering, Analysis and Retrieval website, or “EDGAR” at www.sec.gov. These factors should not be construed as
exhaustive and should be read in conjunction with other cautionary statements that are included in this presentation and in
Monmouth’s SEC filings. These and other risks, uncertainties and factors could cause Monmouth’s actual results to differ materially
from those included in any forward‐looking statements it makes. Any forward‐looking statement speaks only as of the date on
which it is made. New risks and uncertainties arise over time, and it is not possible for Monmouth to predict those events or how they
may affect it. Except as required by law, Monmouth is not obligated to, and does not intend to, update or revise any forward‐looking
statements, whether as a result of new information, future events or otherwise. You should not place undue reliance on these
forward‐looking statements, as events described or implied in such statements may not occur.

This presentation may include references to “FFO” and “AFFO”, which are non‐GAAP financial measures. A reconciliation of “FFO”
and “AFFO” to the most comparable GAAP financial measures is included in our most recent Quarterly Report on Form 10‐Q and/or
our Supplemental Information package as of June 30, 2021, furnished to shareholders on Form 8‐K, and is available on our website
at www.mreic.reit.

                                                                                                                                         2
Monmouth Real Estate Investment Corporation - NYSE: MNR September 2021 Investor Presentation
COVID‐19 Global Pandemic
The future effects of the evolving impact of COVID‐19 are uncertain, however at this time we
believe that the fallout from COVID‐19 will not have a material adverse effect on our financial
condition.
Monmouth went into the global pandemic very well positioned with a strong balance sheet, a
high‐quality tenant roster, nearly full occupancy, and a well‐covered dividend. Our resilient rent
collection results during these challenging times highlights the mission‐critical nature of our
assets and underscores the essential need for our tenants’ operations. In addition, because our
weighted average lease maturity is 7.1 years and our weighted average fixed‐rate mortgage
debt maturity is 11.1 years, we expect our income streams to remain resilient for years to come.

Tenant Rent Collections and Occupancy During
COVID‐19 Pandemic
 Rent collections average 99.9% Throughout
 Occupancy over 99.9% Throughout

                                                                                                     3
Monmouth Real Estate Investment Corporation - NYSE: MNR September 2021 Investor Presentation
Select Properties

        Dallas MSA    Indianapolis MSA

                     Phoenix MSA

     Atlanta MSA     Savannah MSA        4
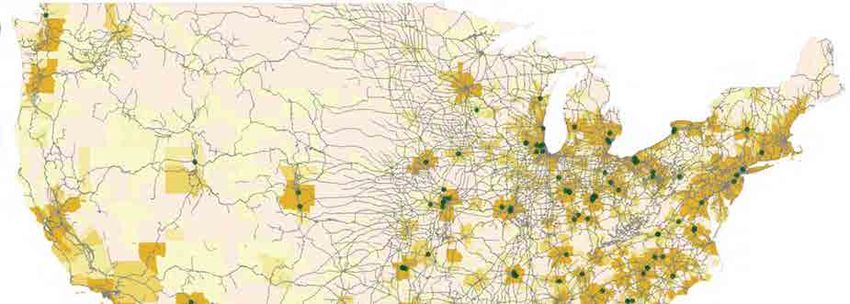
Monmouth Real Estate Investment Corporation - NYSE: MNR September 2021 Investor Presentation
Company Overview
    Single tenant, net‐leased Industrial REIT specializing in well‐located,
     modern properties subject to long‐term leases primarily to investment
     grade tenants or their subsidiaries
    Property portfolio contains 24.9 million square feet, consisting of 122
     properties with 99.7% occupancy
    Geographically diversified portfolio across 32 states with a focus on major
     seaports, major intermodal ports, and major airports
    Quality roster of investment grade tenants
          Approximately 83% of rental revenue is from investment grade
             tenants or their subsidiaries, including Amazon, Beam Suntory,        Indianapolis MSA
             Coca‐Cola, FedEx, Home Depot, International Paper, Magna,
             National Oilwell, Raytheon Technologies, Shaw Industries,
             Sherwin‐Williams, Siemens, Toyota, UPS and other high‐quality
             companies
    Strong recent growth
          Monmouth successfully grew GLA by approximately 60% during
             the past five years
          In fiscal 2020, we closed on five properties with approximately 1.2
             million square feet for $175.1 million
          Thus far in fiscal 2021, closed on four properties totaling 1.6
                                                                                   Memphis MSA
             million square feet for $258.4 million
          Current acquisition pipeline includes four highly‐automated
             properties containing approximately 1.4 million square feet with a
             total purchase price of $148.9 million
                  • All four properties are leased long‐term to investment
                     grade tenants
    Conservative capital structure
          27.1% Net Debt to Total Market Capitalization
          6.0x Net Debt/Adjusted EBITDA
          2.1x Fixed Charge Coverage
          11.1 years Weighted Average Fixed Rate Mortgage Debt Maturity           Daytona Beach MSA
Source: MNR 10‐Q and subsequent press releases
                                                                                                       5
Monmouth Real Estate Investment Corporation - NYSE: MNR September 2021 Investor Presentation
Portfolio Overview                                                                        Consistent Results
    122 properties geographically diversified across 32 states, totaling                                  Occupancy
     approximately 24.9 million square feet of GLA
    Highest occupancy rate in the Industrial REIT sector at 99.7%                      99.6%                99.6%                           99.7%
                                                                             100.0%               99.3%                          99.4%
    Currently in our sixth consecutive year with above 98.9% occupancy                                                98.9%
                                                                              99.0%
    Most modern industrial property portfolio with a weighted average
                                                                              98.0%
     building age of 10.1 years
           FedEx portfolio weighted average building age is 9.4 years        97.0%
    Average building size is approximately 204,500 square feet               96.0%
    Weighted average lease maturity is 7.1 years                             95.0%
    Weighted average rent per square foot is $6.60                           94.0%
    Ample expansion capability with a land to building ratio of 5.4:1        93.0%
    FedEx portfolio land to building ratio is 6.4:1                          92.0%
    Simple business model                                                    91.0%
           No off‐balance sheet joint ventures
                                                                              90.0%
           No in‐house development division                                           FY 2016    FY 2017    FY 2018   FY 2019   FY 2020    Current
           No significant amount of non‐income producing land
           To serve the digital economy
                                                                                                  Tenant Retention
                                                                                      100.0%                                                  100.0%
                                                                            100.0%                92.0%
                                                                             90.0%                                                 87.0%
                                                                             80.0%                                      76.0%
                                                                                                            69.0%
                                                                             70.0%
                                                                             60.0%
                                                                             50.0%
                                                                             40.0%
                                                                             30.0%
                                                                             20.0%
                                                                             10.0%
                                                                              0.0%
                                                                                      FY 2016    FY 2017     FY 2018   FY 2019    FY 2020     FY2021
                       Charlotte MSA

Source: MNR 10‐Q and subsequent press releases                                                                                                         6
Monmouth Real Estate Investment Corporation - NYSE: MNR September 2021 Investor Presentation
Portfolio Growth
                                                                                       Total GLA

                                              30.0
                                                                                                                             25.2
Total Square Feet (in Millions)

                                              26.0                                                                 23.4
                                                                                                        22.3
                                                                                            21.2
                                              22.0
                                                                             18.8
                                              18.0                16.0
                                                        13.9
                                              14.0

                                              10.0

                                               6.0
                                                      FY 2015    FY 2016    FY 2017        FY 2018     FY2019     FY2020    FY2021E

                                                                            Total Real Estate Assets
   Total Real Estate Assets ($ in Billions)

                                                                                                                              $2.333
                                               $2.4
                                                                                                                   $2.044
                                               $2.0                                                      $1.867
                                                                                             $1.720
                                               $1.6                           $1.432
                                                                   $1.158
                                               $1.2    $0.941
                                               $0.8

                                               $0.4
                                                       FY 2015    FY 2016    FY 2017        FY 2018     FY2019     FY2020     FY2021E

      Source: MNR 10‐Q and subsequent press releases                                                                                    7
Monmouth Real Estate Investment Corporation - NYSE: MNR September 2021 Investor Presentation
Capital Structure
                                                   $3.5

                                                   $3.0
     Total Market Capitalization ($ in Billions)

                                                   $2.5

                                                   $2.0

                                                   $1.5

                                                   $1.0

                                                   $0.5

                                                   $0.0
                                                          FY 2015   FY 2016      FY 2017      FY 2018            FY 2019   FY 2020   Q3 2021
                                                                              Common Equity   Preferred Equity     Debt

Source: MNR 10‐Q and subsequent press releases                                                                                                 8
Monmouth Real Estate Investment Corporation - NYSE: MNR September 2021 Investor Presentation
Financial Highlights
                                                                                                      Gross Revenue
                        Gross Revenue has grown at an average annual rate of 17% over the past five years
                                                                                                                                                                  + 5%                           +6%
                                                                                                                                   + 14%
                          $200
                                                                                                     + 23%
                                                                         + 20%
                          $150
                                          + 23%
       $ in Millions

                          $100

                           $50

                               $0
                                       2015                        2016                        2017                       2018                        2019                        2020               2021 annualized

                                                                   Adjusted Funds from Operations per Share
                        AFFO per share has grown at an average annual rate of 7% over the past five years
                                                                                                       + 14%                           ‐ 2%
                                                                            + 9%                                                                                         ‐ 8%                        0%
                                              + 23%
                       $0.80

                       $0.60

                       $0.40

                       $0.20

                       $0.00
                                    2015                         2016                         2017                         2018                          2019                         2020                 2021 annualized
The AFFO per share remains unchanged primarily due to an increase in Preferred Dividend expense as a result of an increase in preferred shares outstanding, as well as a decrease in dividend income, partially offset by an increase in Net
Operating Income (NOI).

Source: MNR 10‐Q and subsequent press releases
                                                                                                                                                                                                                                               9
Monmouth Real Estate Investment Corporation - NYSE: MNR September 2021 Investor Presentation
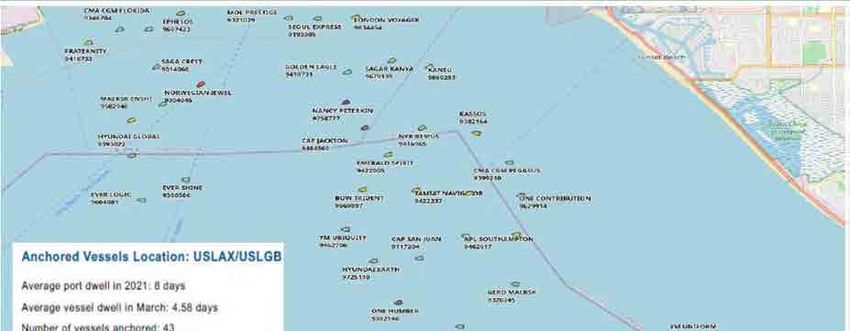
Ecommerce Trends and MNR’s Portfolio
    Monmouth was early in anticipating consumer spending’s shift from traditional stores to internet sales.
    The entire retail industry continues to migrate from brick and mortar stores to omni‐channel platforms.
     This has led to significant demand for large, modern industrial distribution centers.
    U.S. ecommerce sales are expected to grow to $933 billion in 2021, representing a 17.9% increase from 2020 and 15.3% of total
     U.S. retail sales.
    Today, Monmouth’s vast FedEx and Amazon holdings represent an integral part of the growing ecommerce ecosystem.

                                                                   ECommerce Sales

                                                                                                                CAGR: 17%
                       $1,000
                        $900
                        $800
                        $700
       $ in Billions

                        $600
                        $500
                        $400
                        $300
                        $200
                        $100
                          $‐
                                2011             2012    2013   2014   2015   2016   2017   2018   2019      2020      2021E
                                                                                                                                 10
Source: U.S. Census Bureau & eMarketer & eMarketer.com
Inventories‐to‐Sales Ratio, Retailers
       Supply chains need to be more resilient in a Post‐Pandemic World. Inventory levels are projected to increase substantially.
        This will drive greater industrial space demand.

          1.80

          1.75

          1.70

          1.65

          1.60

          1.55

          1.50

          1.45

          1.40

          1.35

          1.30
                        '92   '94   '96   '98   '00    '02    '04     '06    '08     '10    '12     '14    '16     '18    '20

Source: U.S. Census Bureau                                                                                                            11
Triple Digit Demographic Shifts
        Metropolitan areas with the greatest daily net population exodus and gain (Pre‐COVID Trends)

Source: Bloomberg analysis of U.S. Census data                                                         12
Strategic Locations
                         Monmouth’s Property Portfolio with U.S. Population Density and U.S. Railroads

                                  Population Density (#/sq. mi.)
                                              1.74 – 37.60    70.60 – 112.60    207.00 – 2,872.94   MREIC Current Properties
                                             37.60 – 70.60    112.60 – 207.00   U.S Railroads       MREIC Properties Under Contract   13
Source: S&P Global Market Intelligence as of 8/31/21
Over 70% of the U.S. population lives east of the Mississippi River

                                                                      14
Supply Chain Bottle Neck on West Coast
               USLAX/USLGB anchored vessels

                                              15
Supply Chain Tightness
                   Port congestions and a shortage of containers have pushed up shipping costs

                                             US: The cost of shipping a container from…

Source: Oxford Economics/ Freightos Baltic Index                                                  16
Expanded Panama Canal Changes the Balance
    Since 2008, shipping container volumes on East Coast ports have increased dramatically by 46.8%.
     West Coast ports have seen some growth as well, albeit at a much slower rate of 18.4%.
    The Post‐Pandemic environment will likely accelerate this trend further.

                               60.0%

                                       56.5%
                                                       54.0%
                               50.0%                                        52.4%
                                                                                                        51.1%
                                                                                                                48.9%
                                                                                     47.6%
                                                               46.0%
                               40.0%           43.5%
         Share of total TEUs

                               30.0%

                               20.0%

                               10.0%

                                0.0%
                                           2008            2014                  2016                       2018
                                                           West Coast     East Coast
                                                                                                                        17
Source: JLL Research
Portfolio Markets & Panama Canal Expansion
       Monmouth’s acquisition pipeline currently comprises four new build‐to‐suit industrial properties containing approximately 1.4 million square feet with an
        aggregate purchase price of $148.9 million. All four highly‐automated properties are leased to investment grade tenants or their subsidiaries.
       Over 70% of the U.S. population lives east of the Mississippi River.
       Following nine years of construction costing $5.4 billion, the Panama Canal expansion project opened on June 26, 2016.
       North American ports have been spending billions of dollars in order to accommodate these larger ships,
                       These ships have more than twice the cargo capacity of the older ships.
                       The expanded Panama Canal allows larger vessels an approximate 29 days shorter transit time from the Atlantic to the Pacific oceans.
                       Container traffic has been rapidly shifting to the East Coast ports.

                      Eastern Coastal
                      East Coast Inland

                      Gulf coast & Mississippi valley
                                                                                          Existing Properties
                      Non‐impacted markets
                                                                                         Acquisitions Under Contract

Source: MNR 10‐Q, subsequent press releases, Parsons Brinckerhoff Panama Canal Expansion Study, June 2012; Panama Canal Authority, Canal Expansion Programs – Components Report April 2012, Washington Post: “Modernization of the
Panama Canal”; January 2013
                                                                                                                                                                                                                                     18
High Quality Tenant Base
                                 Largest Percentage of Investment Grade Tenants in the REIT Sector

    Approximately 83% of rental revenue is from investment grade tenants or subsidiaries
         Higher investment grade tenant base than any other REIT
    Rental roster includes Amazon, Beam Suntory, Coca‐Cola, FedEx, Home Depot, International Paper, Keurig Dr
     Pepper, Magna, Milwaukee Tool, National Oilwell, Raytheon Technologies, Shaw Industries, Sherwin‐Williams,
     Siemens, Snap‐on, Toyota , ULTA, UPS and other high quality companies
    Monmouth began investing in properties leased to FedEx in 1994
         Recent acquisitions include five properties consisting of an additional 1.3 million square feet leased to FedEx
         Sixteen FedEx expansion projects completed since Fiscal 2014, increasing the rent and lease terms of these
           facilities, with several parking expansion projects currently underway
Source: MNR 10‐Q and subsequent press releases
                                                                                                                            19
FedEx’s average U.S. daily package volume
       Driven by Ground home deliveries, FedEx’s average daily package volume is now at all‐time
        record levels

                         18
                         16
                         14
                         12
                         10
           in Millions

                         8
                         6
                         4
                         2
                         0
                              FY 2018   FY 2019            FY 2020              FY 2021

                                           Ground       Express

Source: The Wall Street Journal                                                                     20
Top 10 Airlines by Operating Revenue
                    FedeEx was the world’s largest air carrier in the quarter that ended on September 30, 2020, up from fifth
                     place a year earlier, as the COVID‐19 crisis boosted cargo revenue and decimated passenger services.

                                                                           Third Quarter 2020 vs. Third Quarter 2019

                          $14
                                                                                            $12.9
                                                            $11.9                                                                                    $11.4
                          $12                                                $11.1
Revenue U.S. $ Billions

                                       $9.7
                          $10
                                $8.9                                                                       $8.6
                          $8
                                              $6.2
                                                                                                                         $5.4                                       $5.6
                          $6
                                                                                                                                       $4.8
                                                     $3.9
                          $4                                        $3.2             $3.1       $3.1              $3.0          $2.8          $2.5           $2.5
                                                                                                                                                                           $1.8
                          $2

                          $0
                                 FedEx          China       American Lufthansa              Delta Air   Air France‐      Air China      China        United         Southwest
                                 (U.S.)       Southern       Airlines (Germany)              Lines         KLM            (China)      Eastern       Airlines        Airlines
                                               (China)        (U.S.)                         (U.S.)      (France)                      (China)        (U.S.)          (U.S.)

                                                                                        2019        2020

                                                                                                                                                                                  21
High Quality Tenants
                               Annual Rent by Tenant                                                                Square Footage by Tenant

                         Total Annual Rent: $164.0 million                                                     Total Square Footage: 24.9 million

                                                 Remaining Tenants,
                                                      23.9%
                                                                                                                              Remaining
     B.Braun Medical,                                                                                                       Tenants, 32.1%
           1.4%                                                                                                                                 FedEx Ground,
  International Paper,                                                                                                                              42.0%
         1.6%
                                                                           FedEx Ground, 52.2%
      ULTA, 1.7%

  Milwaukee Tool, 1.9%
                                                                                                 Jim Beam Brands,
                                                                                                       2.4%
  Shaw Industries, 2.2%
                                                                                                  ULTA, 2.7%
                   Home Depot, 4.0%

                                                                                                 Home Depot,                                            FedEx Express,
                                                                                                    3.3%                                                    4.7%

                                Amazon, 6.5%                                                             Shaw Industries,                       Amazon, 6.0%
                                                                                                              3.3%
                                                                                                                              Milwaukee Tool,
                                                     FedEx Express, 4.6%
                                                                                                                                   3.5%

                    FDX and its subsidiaries represent                                                          FDX and its subsidiaries represent
                         56.8% of Annual Rent                                                                       46.7% of Square Footage
Source: MNR 10‐Q and subsequent press releases                                                                                                                           22
Land – to – Building Ratios
 Monmouth’s properties contain ample land in order to accommodate future expansion projects
 Our FedEx properties contain even more land in order to accommodate their significant parking requirements
 Numerous expansion projects are currently underway

              8

                                                               6:1
              6
                                       5:1

                                                                                      4:1
              4

              2

              0

                         Total Monmouth Portfolio        FedEx Properties       Non‐FedEx Properties
                                                                                                               23
Geographic Focus
   Our 24.9 million square foot portfolio is well diversified across 32 states
   We have high concentrations in several of the most business friendly states

                                Annual Rent by State                                                                      Square Footage by State
                       Total Annual Rent: $164.0 million                                                         Total Square Footage: 24.9 million

                                                                                                                                                     Ohio, 9.5%
                                                         Georgia, 9.8%

                                                                                                                                                                  Georgia, 9.2%
                                                                         Florida, 9.8%
                                                                                                                          Remaining States,
                                                                                                                              32.9%
                            Remaining States,
                                33.4%
                                                                                                                                                                        Florida, 8.9%
                                                                                  Ohio, 9.7%

                                                                                                                                                                   Indiana, 7.9%

                                                                           Texas, 8.4%

     Michigan, 3.4%                                                                               Tennessee, 4.6%

                                                                                                                                                                            Texas, 7.2%
                                                                                  Indiana, 6.8%       Mississippi, 4.6%
   New Jersey, 3.6%
                                                                                                                      North Carolina,
                    Illinois, 3.8%     North Carolina,                                                                     4.9%                                   Kentucky, 5.2%
                                                                South Carolina,                                                               South Carolina,
                                            5.3%                     6.0%                                                                          5.1%

Source: MNR 10‐Q and subsequent press releases                                                                                                                                            24
Summary Portfolio Metrics
        Highest occupancy rate
        Strongest Tenants
        Longest lease terms
        Youngest portfolio in the Industrial REIT sector with a weighted average building age of 10.1 years
                                                         101.0%
                                                                   99.7%
                                                         100.0%
                                                          99.0%            98.3%
               Current                                    98.0%
                                                                                    97.9%
                                                                                             97.5%
                                                                                                       97.2%
                                                          97.0%                                                 96.8%    96.6%
              Occupancy                                   96.0%                                                                              Highest
                Rate                                      95.0%                                                                   94.5%       occupancy rate
                                                          94.0%
                                                                                                                                              in the sector
                                                          93.0%
                                                          92.0%
                                                          91.0%
                                                                  MNR       EGP     DRE     TRNO      PLD      STAG       FR      PSB

                                                         60.0%
                                                                                                                                 54.0%
                                                         50.0%                                                          48.2%
         Rent Roll (%                                                                                40.7%     42.1%
                                                         40.0%                              36.5%
        next 3 years by                                                    30.4%
                                                                                   34.1%

                                                         30.0%                                                                               Limited near
        base revenues)                                            19.9%                                                                       term rent roll
                                                         20.0%

                                                         10.0%

                                                          0.0%
                                                                  MNR      DRE     STAG     TRNO      FR       PLD      EGP      PSB

Source: S&P Global Market Intelligence as of 8/31/2021
                                                                                                                                                               25
Fiscal 2020 & 2021 Acquisitions
    Monmouth has completed over $1.5 billion in acquisitions and more than doubled portfolio GLA over the past seven years.
    In fiscal 2020, Monmouth acquired five properties containing approximately 1.2 million square feet for $175.1 million, all are net‐leased
     to investment grade tenants or their subsidiaries.
    Thus far in fiscal 2021, Monmouth acquired four properties containing approximately 1.6 million square feet for $258.4 million.
    Monmouth’s acquisition pipeline currently contains approximately 1.4 million square feet consisting of four new build‐to‐suit
     properties, all of which are net‐leased to investment grade tenants or their subsidiaries, with an aggregate purchase price of $148.9
     million.

                                                                                      Fiscal 2021 Acquisitions
                                                                          Columbus,           Atlanta,    Burlington,    Knoxville,
                              MSAs:
                                                                             OH                 GA            VT            TN

                              Tenant:

                              Credit Rating: (S&P/Moody’s)                 BBB/Baa2            A/A2       BBB/Baa2      BBB/Baa2

                              Year Built:                                    2020              2020          2021          2021

                              Size (sf):                                    500,268           657,518       143,972      259,053

                              Acres:                                         100.0             130.23        43.40         42.57

                              Purchase Price:                             $73,304,000       $95,935,000   $54,789,000   $34,411,000

                              Price/SF:                                     $146.53           $145.90      $380.55       $132.83

                              Lease Maturity:                               9/30/35          11/30/2040    5/31/2036     5/31/2036

                              Total Annualized Rental Revenue for properties purchased in
                              fiscal 2021:                                                  $15,239,000

Source: MNR 10‐Q and subsequent press releases
                                                                                                                                                 26
Select Acquisitions
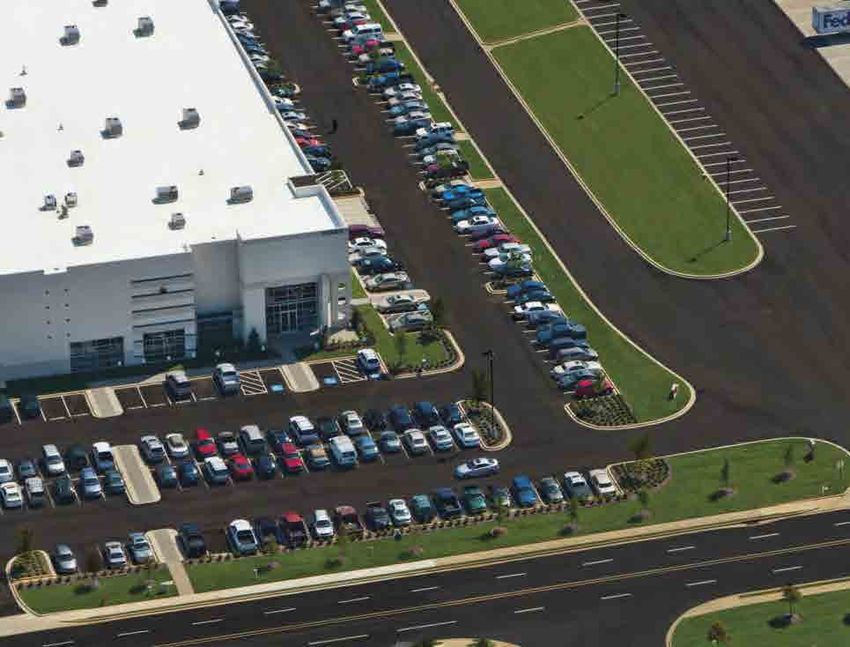
                                FedEx Ground – Orlando, FL MSA – 311,000 sf

       This photo illustrates the strong demand for our locations, and how integral they are to the Ecommerce ecosystem.
        Situated on the I‐4 corridor between Tampa and Orlando, Walmart recently constructed two large ecommerce fulfillment
                               centers (one on each side of our FedEx facility) totaling 2.35 million square feet.
Source: MNR 10‐Q and subsequent press releases                                                                                 27
The Changing of The Guard
  The Big Town Mall was for many years the largest mall in Texas, and today…

                                                         Before

Source: MNR                                                                     28
The Changing of The Guard
 This large 65 acre parcel situated six miles east of downtown Dallas is now the site of Monmouth’s new 352,000 sf FedEx facility.

                                                             After

Source: MNR                                                                                                                           29
Acquisition Pipeline
  Large highly‐automated acquisition pipeline comprising
   approximately 1.4 million square feet with a purchase price of
   $148.9 million
         100% is leased to investment grade tenants
         Leases commence throughout fiscal 2021 and 2022
         Acquisitions included in the pipeline have a weighted
           average lease maturity of 13.1 years
  Nine expansion projects completed within the last five years with
   a total cost of $25.3 million
  These expansions resulted in extending the weighted average
   lease terms by approximately 11 years and produced
   approximately 10% unlevered annual returns on cost from
   increased rents
  Several parking expansion projects are currently under
   construction
                                                                                                  Built‐to‐Suit Infrastructure Installation (material and handling equipment is owned by tenant)

 Built‐to‐Suit Infrastructure Installation (material and handling equipment is owned by tenant)
                                                                                                                          Salt Lake City MSA
Source: MNR 10‐Q and subsequent press releases                                                                                                                                                     30
Lease Expirations Are Well Dispersed
                                      Strong embedded rent growth potential.                                            Monmouth historically averages approximately 90%
                                      Weighted average lease maturity currently at 7.1 years.                            annual tenant retention. Achieved 100% tenant
                                      Weighted average rent per occupied square foot of $6.60.                           retention in fiscal 2021.
                                      National average rent psf for industrial real estate                              Fiscal 2021 leases increased by 6% on a GAAP basis.
                                       currently is $7.03 and trending higher.                                           Monmouth’s properties contain additional land and
                                                                                                                          excess parking.
                                                                                                                          Expiring square footage (‘000’s)
                                                                                                                          Average rent per occupied square foot of expiring square footage is shown above each
                                                                                                                          bar
                                  3,000 sq. ft.
Expiring Square Footage (000’s)

                                                                              $4.98
                                  2,500 sq. ft.                                               $5.56

                                                             $5.70                                     $5.46                                     $8.85
                                  2,000 sq. ft.                       $6.25                                     $5.79
                                                                                      $6.24
                                                                                                                                                                       $6.00
                                  1,500 sq. ft.
                                                                                                                                      $7.99
                                                     $5.28                                                                 $7.70
                                                                                                                                                            $8.52
                                  1,000 sq. ft.                                                                                                                                   $9.74
                                                                                                                                                                                                        $8.30
                                      500 sq. ft.                                                                                                                                            $12.94

                                        0 sq. ft.
                                                     2022    2023     2024    2025    2026    2027     2028     2029       2030       2031       2032       2033       2034       2035       2036       2041
                                                                                                                    Fiscal Year

                                               GLA    4.3%     8.5%    7.6%   10.5%    7.0%    9.6%      8.7%     7.3%       4.4%      4.9%        8.6%        4.2%      6.3%       3.4%       1.6%      2.6%

                                               ABR    3.4%     7.4%    7.2%    7.9%    6.6%     8.1%     7.2%     6.5%       5.2%       5.9%       11.5%       5.4%      5.7%       5.1%       3.2%      3.3%

Source: MNR 10‐Q and subsequent press releases, GLA: Gross Leasable Area, ABR: Annual Base Rent

                                                                                                                                                                                                                 31
Favorable US Industrial Fundamentals
 Current economic indicators are very favorable for the US industrial real estate sector and Monmouth’s modern portfolio due to:
        Rampant growth in Ecommerce which has accelerated further due to the COVID‐19 Pandemic
        Increased inventory stocking due to the COVID‐19 Pandemic
        Manufacturing growth due to supply chains shifting back to the U.S.
        Over nine consecutive years of positive net absorption
        Continued benefits from the recently completed Panama Canal expansion

               US Industrial Construction (000’s)                                                         US Industrial Occupancy
     500,000                                                                      476,100         100%
                                                                                                                                       95.5%
     400,000
                                                                                                   95%
      300,000
     200,000                                                                                       90%
      100,000
                0                                                                                  85%
                 2006         2008        2011         2013         2016   2018   2021                2006 2009 2012 2015 2018 2019 2021

                                                                            US Industrial Cap Rates
                                                               9%

                                                               7%

                                                               5%                                               3.5%

                                                               3%
                                                                    2006     2009        2012   2015     2018   2021
Source: CBRE Research, Green Street, and Cushman & Wakefield
                                                                                                                                               32
Conservative Balance Sheet
   Conservative capital structure
                                                                                                                                              Total Market Capitalization (1)
          27.1% Net Debt to total market capitalization
          6.0x Net Debt/Adjusted EBITDA                                                                           Total Shares Outstanding (6/30/21)      98,302,207

          2.1x Fixed Charge Coverage                                                                              Stock Price (6/30/21)                       $18.72
          91.2% fixed rate debt, weighted average interest rate of 3.8%                                                                                                          Preferred,
                                                                                                                   Equity Market Capitalization             $1,840.2
   Limited debt maturities each year through 2025                                                                                                                                   16%
   83.9% of debt consists of modest LTV asset level mortgage financing
   Weighted average mortgage maturity of 11.1 years, representing one of the                                      Mortgage Notes Payable                      849.0
    longest debt maturity schedules in the REIT sector                                                                                                                                             Equity,
                                                                                                                   Loans Payable                                165.0                               54%
   $474.3 million in potential liquidity                                                                                                                                   Debt, 30%
          $148.4 million in REIT marketable securities (approximately 5.9% of                                     Total Debt                               $1,014.0

            gross assets)                                                                                          Total Preferred Stock                       549.6
          $135.0 million available on our $225.0 million unsecured revolving                                      Total Market Capitalization              $3,403.8
            line of credit, plus an additional $100.0 million potentially available
            on an accordion feature
          $90.9 million in cash                                                                                                                         Debt Maturities
   In October 2018, we completed our first Common Stock offering since 2014,
    with the sale of 9.2 million shares generating gross proceeds of $138 million
                                                                                                                     $600
                                                                                                                                           Loans Payable                                              52.4%
                                                                                                                                           Mortgages
                                                                                                                     $500

                                                                                      Total Debt ($ in Millions)
                                                                                                                     $400

                                                                                                                     $300

                                                                                                                     $200                                                    16.7%
                                                                                                                                                                                           14.7%

                                                                                                                     $100                         8.0%
                                                                                                                                                                6.6%
                                                                                                                                    1.6%
                                                                                                                        $0
                                         Mobile, AL                                                                                2021           2022          2023          2024         2025    Thereafter

(1) All dollar amounts except stock price are in millions                                                                                                  % of Total Debt Outstanding
Source: MNR 10‐Q and subsequent press releases                                                                                                                                                               33
Long Term Reliable Cash Dividends
   Monmouth is now in its 30th consecutive year of having maintained or increased its dividend, representing one of the
    best track records in the entire REIT sector.
   On January 14, 2021, Monmouth increased its dividend by 5.9% to $0.18 per quarter($0.72 per year), making our third
    dividend increase in 5 years. These 3 dividend increases total 20%.
   Current AFFO dividend payout ratio is 90.0%.
   Monmouth was one of the only REITs that maintained its dividend throughout the Great Recession.
   100% cash dividends since inception.
   Best rent collection and occupancy results during the COVID‐19 Pandemic in the Industrial Property sector.

                                                                                   Dividends Per Share
     $0.80
                                                                                                                                                                                      $0.71
                                                                                                                                                                 $0.68 $0.68 $0.68
     $0.70
                                                                                                                                                  $0.64 $0.64
                                                                 $0.60 $0.60 $0.60 $0.60 $0.60 $0.60 $0.60 $0.60 $0.60 $0.60
                       $0.57 $0.58 $0.58 $0.58 $0.58 $0.58 $0.58
     $0.60

     $0.50

     $0.40

     $0.30

     $0.20

     $0.10

          $‐

                                                                                                                                                                               2020

                                                                                                                                                                                      2021
                                                2002

                                                                                                                                    2014
                                                                                                                      2012
                                 2000

                                                                                   2007

                                                                                                                                                          2017
                                         2001

                                                                            2006

                                                                                          2008

                                                                                                 2009

                                                                                                        2010

                                                                                                                                                   2016

                                                                                                                                                                 2018

                                                                                                                                                                        2019
                                                       2003
                        1999

                                                              2004

                                                                     2005

                                                                                                               2011

                                                                                                                             2013

Source: S&P Global Market Intelligence
                                                                                                                                           2015                                           34
Calendar year 2020 Industrial REIT Sector Total Return Performance
             Monmouth was the best performing Industrial REIT last year.
             The Industrial REIT sector was the best performing sector last year.
             The broad REIT market (MSCI RMZ Index) total return was negative 8.75% last year.

          30.0%
                              26.2%
          25.0%

          20.0%
                                            16.3%
          15.0%
                                                    11.8%

          10.0%                                              8.5%
                                                                         5.5%
            5.0%                                                                      2.7%
                                                                                                  2.2%

            0.0%
                               MNR          DRE     PLD     TRNO         EGP         STAG         FR     MSCI REIT Index   PSB
           ‐5.0%

          ‐10.0%                                                                                             ‐8.8%

          ‐15.0%

          ‐20.0%                                                                                                           ‐17.4%

Source: Citadel Securities as of 12/24/20
                                                                                                                                    35
Peer Analysis
                                      Dividend Yield                                                Total Debt/Total Market Capitalization
    4.0%         3.8%                                                                           35.0%
                             3.4%                                                                        29.8%
     3.5%                                                                                       30.0%
     3.0%                               2.7%                                                    25.0%             23.8%
     2.5%
                                                   2.0%                                         20.0%                     18.9%
                                                                2.0%    1.9%    1.9%                                              17.3%   16.7%
    2.0%                                                                                1.9%                                                      15.6%
                                                                                                15.0%
     1.5%
                                                                                                10.0%                                                      9.0%
     1.0%
     0.5%                                                                                        5.0%
                                                                                                                                                                   0.0%
    0.0%                                                                                         0.0%
                MNR        STAG        PSB        TRNO          EGP     DRE     FR      PLD              MNR     STAG     FR      DRE     EGP     PLD     TRNO     PSB

                                2021E FFO Multiple                                                               2021E FFO Payout Ratio
     45.0x                                                                                      100.0%
                   40.2x                                                                                 88.9%
     40.0x                                                                                       90.0%            81.9%
     35.0x                    33.1x                                                              80.0%                    71.4%
                                         30.7x     30.6x
     30.0x                                                      28.8x                            70.0%                            62.0%   61.3%   60.4%   59.5%
                                                                                                 60.0%                                                            55.6%
     25.0x                                                              23.4x   22.6x
                                                                                        20.8x    50.0%
     20.0x
                                                                                                 40.0%
     15.0x
                                                                                                 30.0%
     10.0x                                                                                       20.0%
      5.0x                                                                                       10.0%
      0.0x                                                                                        0.0%
                 TRNO        PLD        EGP        DRE           FR     MNR     PSB     STAG             MNR     TRNO     STAG    PLD     EGP     PSB     DRE     FR
Source: S&P Global Market Intelligence as of 8/31/2021
NOTE: MNR peers include DRE, EGP, FR, PLD, PSB, STAG and TRNO
                                                                                                                                                                          36
Long Term Performance
 Monmouth is one of the top performing REITs
 Slide utilizes a 15 year period to illustrate long term performance including during the Global Financial Crisis

                                                                                                                    15Year
                                                                                               MNR                                Peer Group                          RMS
    600
    500                                                                                                                                                                                                                                                 484.80%
    400
    300
                                                                                                                                                                                                                                                        249.43%
    200                                                                                                                                                                                                                                                 174.53%
    100
        0
   ‐100
   ‐200
            8/31/2006

                          8/31/2007

                                         8/31/2008

                                                          8/31/2009

                                                                      8/31/2010

                                                                                   8/31/2011

                                                                                                     8/31/2012

                                                                                                                      8/31/2013

                                                                                                                                       8/31/2014

                                                                                                                                                          8/31/2015

                                                                                                                                                                       8/31/2016

                                                                                                                                                                                          8/31/2017

                                                                                                                                                                                                      8/31/2018

                                                                                                                                                                                                                         8/31/2019

                                                                                                                                                                                                                                     8/31/2020
                                                                                                                 Dividend Yield
     4.0%                 3.8%
                                                         3.4%
     3.5%
     3.0%                                                                         2.7%
     2.5%
                                                                                                                   2.0%                            2.0%                            1.9%                           1.9%                           1.9%
     2.0%
     1.5%
     1.0%
     0.5%
     0.0%
                         MNR                         STAG                         PSB                             TRNO                             EGP                             DRE                            FR                             PLD
Source: S&P Global Market Intelligence as of 8/31/2021
                                                                                                                                                                                                                                                             37
ESG‐ Environmental
                                           Environmental
 Location: Monmouth’s property portfolio is
  strategically located adjacent to major seaports,
  international air freight terminals, major highways,
  and inter‐modal transportation hubs. This minimizes
  distance traveled for goods flowing through
  traditional and online networks and reduces the
  negative carbon and environmental impacts from
  truck traffic, pollution, and highway congestion.
 Sustainability: Our properties incorporate numerous
  environmentally‐friendly features, such as Solar
  Energy, LEED certification, heat reflective energy
  efficient roofing systems, and energy efficient
  lighting. Our tenants are committed to creating and
  improving healthy, sustainable communities, reducing
  waste and emissions, maintaining green workspaces,      Headquarters: Monmouth’s Headquarters,
  minimizing their carbon footprint, and conserving      Bell Works in Holmdel, New Jersey includes
  resources.                                             60,000 square feet of amorphous silicon
 High Productivity: Our consistently high‐productive    photovoltaic glass panels. These panels
  use of space, with a real estate portfolio known to    generate free, clean solar energy throughout
  possess very low historic vacancy rates and maximum    the day and offsets approximately 60 tons of
  throughput, represents a very efficient and            annual CO2 emissions.
  environmentally sustainable business model.                                                           38
ESG‐ Social & Governance
                                                                 Social
 Diversity in Management Team: Monmouth’s key functions are approximately 50% diverse based on gender, race, or ethnicity.
 Competitive Compensation, Work‐Life Balance: Our employees are compensated without regard to gender, race or ethnicity, and routinely
  recognized for outstanding performance. Employees are offered great flexibility to meet personal and family needs.
 Ethics and Integrity: We adhere to a robust Code of Business Conduct and Ethics which extends to our suppliers and vendors, as applicable.
  We afford all employees meaningful whistleblower protections. All claims will be investigated and addressed without fear of reprisal.
 Community: Monmouth supports its Named Executive Officers and all other employees serving on non‐profit boards and engaging in
  charitable activities in the greater community.
 Partnership: Working with our major tenants, our buildings have been utilized to bring urgently needed medical supplies, food, clothing, and
  other aid to areas throughout the world that have been stricken by natural disasters.

                                                              Governance
 Independent Board: 9 out of 13 Board Members (69%) are independent.
 Diversity of Board: Our board currently includes two women and the age of our board members ranges from 32 years of age to 87 years of
  age. The Governance Committee mandates that at least one candidate representing a diversity of gender, race, ethnicity, age, and/or sexual
  orientation be included in each pool of candidates from which a Board nominee is chosen.
 Plurality Plus Voting for Election of Directors: A nominee who does not receive a majority of the votes cast in his or her uncontested
  election must offer to resign as a director.
 Annual Board Self‐Evaluation: Our directors engage in annual individual performance evaluations.
 Named Executive Officer (NEO) Stock Ownership: Effective October 1, 2017, our Named Executive Officers are subject to Stock Ownership
  Guidelines recommending 2x their base salary.
 Director Stock Ownership: Effective September 12,2017, our Independent Directors are subject to Stock Ownership Guidelines
  recommending 3x their annual cash fee.
 Insider Ownership: Our insider ownership reflects approximately 6% of all shares outstanding, resulting in a strong alignment of ownership
  with fellow shareholders.
 Clawback Policy: Effective October 1, 2017, performance‐based compensation to a Named Executive Officer may be recouped if the NEO
  engaged in fraud or willful misconduct contributing to the need for a material restatement of financial results.
 Annual Say‐on‐Pay: Non‐binding votes on executive compensation are held annually.

                                                                                                                                                 39
Key Investment Highlights

      Best‐in‐Class Single Tenant Net‐Lease Industrial Portfolio

     Geographically Diversified with a High Quality Tenant Base

      Demonstrated Portfolio, Earnings, and Dividend Growth

                     Conservative Balance Sheet

    Experienced & Aligned Management Team with 6% Ownership

                  Well Positioned for Future Growth

                                                                   40
2020 Annual report is available on our website. Please contact our IR department if you would like
                                     to receive a hard copy.
                 Monmouth Real Estate Investment Corporation
               Learn more at: www.mreic.reit/interlockingfragility
You can also read