Modeling Space-Based Intelligence, Surveillance, and Reconnaissance (ISR) in Combat Simulations - DEVCOM DAC-TR-2022-005 March 2022 - DTIC
←
→
Page content transcription
If your browser does not render page correctly, please read the page content below
DEVCOM
 DEVCOMDAC-TR-2022-XXX
 DAC-TR-2022-005
 January
 March 2022

Modeling Space-Based Intelligence,
Surveillance, and Reconnaissance (ISR) in
Combat Simulations

by John Mazz

DISTRIBUTION STATEMENT A. Approved for public release: distribution unlimited.
DISCLAIMER

The findings in this report are not to be construed as an official Department of the Army
position unless so specified by other official documentation.

 WARNING

Information and data contained in this document are based on the input available at the
time of preparation.

 TRADE NAMES

The use of trade names in this report does not constitute an official endorsement or
approval of the use of such commercial hardware or software. The report may not be
cited for purposes of advertisement.
DEVCOM DAC-TR-2022-005
 January 2022

Modeling Space-Based Intelligence,
Surveillance, and Reconnaissance (ISR) in
Combat Simulations

by John Mazz
DEVCOM Analysis Center

DISTRIBUTION STATEMENT A. Approved for public release: distribution unlimited.
Form Approved
REPORT DOCUMENTATION PAGE OMB No. 0704-0188
Public reporting burden for this collection of information is estimated to average 1 hour per response, including the time for reviewing instructions, searching
existing data sources, gathering and maintaining the data needed, and completing and reviewing this collection of information. Send comments regarding this
burden estimate or any other aspect of this collection of information, including suggestions for reducing this burden to Department of Defense, Washington
Headquarters Services, Directorate for Information Operations and Reports (0704-0188), 1215 Jefferson Davis Highway, Suite 1204, Arlington, VA 22202-
4302. Respondents should be aware that notwithstanding any other provision of law, no person shall be subject to any penalty for failing to comply with a
collection of information if it does not display a currently valid OMB control number. PLEASE DO NOT RETURN YOUR FORM TO THE ABOVE ADDRESS.
1. REPORT DATE 2. REPORT TYPE 3. DATES COVERED (From - To)
January 2022 Technical Report 1/2020–10/2021
4. TITLE AND SUBTITLE 5a. CONTRACT NUMBER
Modeling Space-Based Intelligence, Surveillance, and Reconnaissance (ISR) in
Combat Simulations 5b. GRANT NUMBER

 5c. PROGRAM ELEMENT NUMBER

6. AUTHOR(S) 5d. PROJECT NUMBER
John Mazz
 5e. TASK NUMBER

 5f. WORK UNIT NUMBER

7. PERFORMING ORGANIZATION NAME(S) AND ADDRESS(ES) 8. PERFORMING ORGANIZATION REPORT
Director NUMBER
DEVCOM Analysis Center
6896 Mauchly Street DEVCOM DAC-TR-2022-005
Aberdeen Proving Ground, MD

9. SPONSORING / MONITORING AGENCY NAME(S) AND ADDRESS(ES) 10. SPONSOR/MONITOR’S ACRONYM(S)

 11. SPONSOR/MONITOR’S REPORT
 NUMBER(S)
12. DISTRIBUTION / AVAILABILITY STATEMENT
DISTRIBUTION STATEMENT A. Approved for public release: distribution unlimited.

13. SUPPLEMENTARY NOTES

14. ABSTRACT
To support future Multi-Domain Operations analyses, the DEVCOM Analysis Center (DAC) is exploring ways to represent the
contribution of space-based Intelligence, Surveillance, and Reconnaissance assets in the Army’s combat simulations. DAC is
using the Framework for Capability-based Tactical Analysis Libraries and Simulations (FRACTALS) as a test-bed for
methodology development. As a start, the Simplified General Perturbations 4 algorithm for predicting the orbital path of
satellites has been incorporated into FRACTALS. This report focuses on imagery products available from commercial satellite
constellations with resolutions of 1 m or less. Methods of predicting resolution as a function of sensor characteristics, slant
range (including curvature of Earth), and viewing angle are presented. Examples of what can be perceived at various
resolutions are also discussed.
15. SUBJECT TERMS
Space-based, ISR, NIIRS, Satellite, Cloud Cover, Resolution

16. SECURITY CLASSIFICATION OF: 17. LIMITATION 18. NUMBER 19a. NAME OF RESPONSIBLE PERSON
 OF ABSTRACT OF PAGES John Mazz
a. REPORT b. ABSTRACT c. THIS PAGE UU 29 19b. TELEPHONE NUMBER
UNCLASSIFIED UNCLASSIFIED UNCLASSIFIED (include area code)
 410-278-6617
 Standard Form 298 (Rev. 8-98)
 Prescribed by ANSI Std. Z39.18
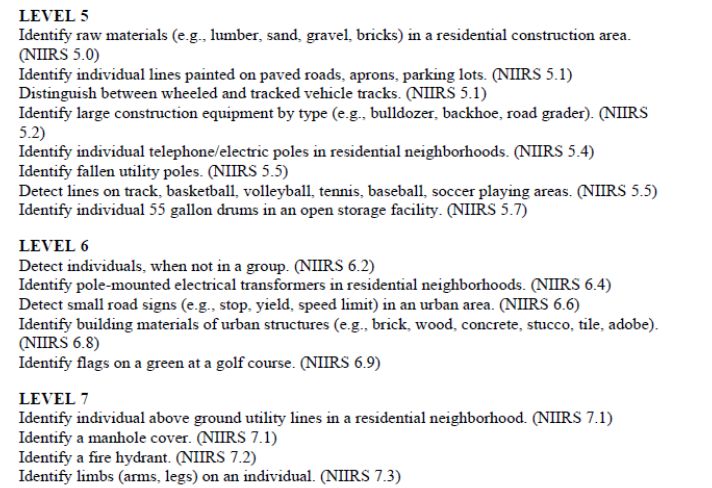
Table of Contents
List of Figures ................................................................................................................ iv
List of Tables ................................................................................................................. v
Acknowledgements ........................................................................................................ vi

1. INTRODUCTION ...................................................................................................... 1

2. METHODOLOGY COMPONENTS ........................................................................... 2
 2.1 Satellite Positioning ....................................................................................... 2
 2.2 Global Coverage and Collection Methods...................................................... 2
 2.3 Satellite Constellations................................................................................... 4
 2.4 Resolution Examples ..................................................................................... 5
 2.5 Satellite Earth Geometry ................................................................................ 7
 2.6 National Imagery Interpretability Rating Scale ............................................... 9
 2.7 Potential Methodology Approaches ............................................................. 13
 2.8 Partial Cloud Cover ...................................................................................... 13

3. CONCLUSION........................................................................................................ 16

4. REFERENCES ....................................................................................................... 17

 – List of Acronyms .................................................................................... A-1

 – Distribution List ...................................................................................... B-2

 iii
List of Figures
Figure 1. Example of TLE data .................................................................................... 2
Figure 2. Pléiades 1A and 1B combined corridor of visibility for the same day (±30°) . 3
Figure 3. Pléiades single-pass collection scenarios .................................................... 4
Figure 4. Resolution/GSD example from Maxar .......................................................... 6
Figure 5. Maxar WordView-3 example intelligence product ......................................... 7
Figure 6. Satellite earth geometry (from Pléiades Imagery User’s Guide) ................... 8
Figure 7. NIIRS task example (civil NIIRS: cultural criteria) ...................................... 10
Figure 8. Cumulative distribution of possible NIIRS values when NIIRS 6.0 is
 predicted ................................................................................................... 12
Figure 9. Cloud-free and cloud-blocked LOSs on the first pass over the NAI ............ 14
Figure 10. Cloud-free and cloud-blocked LOSs on a pass over the NAI 16 min after
 Figure 9 ..................................................................................................... 15

 iv
List of Tables
Table 1. Commercial Satellite Constellation Information as of 4 January 2022 .......... 5
Table 2. Nominal GSD Associate with NIIRS Level .................................................. 10

 v
Acknowledgements

The U.S. Army Combat Capabilities Development Command (DEVCOM) Analysis
Center recognizes the following individuals for their contributions to this report:

Brian Hairfield, DEVCOM Analysis Center

Eric Harclerode, DEVCOM Analysis Center

 vi

1. INTRODUCTION
During the 2021 Modeling and Simulation (M&S) Gap Forum, space intelligence,
surveillance, and reconnaissance (ISR) modeling was identified as a current/near-future
modeling gap. The U.S. Army Combat Capabilities Development Command
(DEVCOM) Analysis Center (DAC) submitted an Army M&S Enterprise Capability Gap
white paper (Harclerode, 2021) describing a course of action to help fill this gap. The
Army Modeling and Simulation Office has funded DAC to develop methodologies for
representing performance of commercial, national, and military space and low-earth-
orbit assets and their impact on joint operations with a test implementation within the
Framework for Capability-based Tactical Analysis Libraries and Simulations
(FRACTALS).

FRACTALS is a DAC-developed simulation framework that provides the generic
architectural “building blocks” to model, simulate, and assess performance of ISR
systems in tactical-level missions and tasks. FRACTALS serves as a test-bed for the
various ISR performance methodologies developed at DAC to be incorporated into
Force on Force simulations via methodology documentation and/or data. FRACTALS
also serves as an analytical tool within DAC to execute performance analysis
comparisons of ISR systems in tactical settings.

This effort will require some level of representation of satellite vehicles (altitude,
trajectory, and kinematics), sensor payloads (electro-optical [EO], IR, synthetic aperture
radar, and signals intelligence), networks, control systems, ground stations (timeline,
communications, processing, exploitation, and dissemination), end users, and the
processes and behaviors that connect them. This report describes some of the
groundwork that DAC has performed to support this effort with a focus on visible-band
camera imagery.

 1
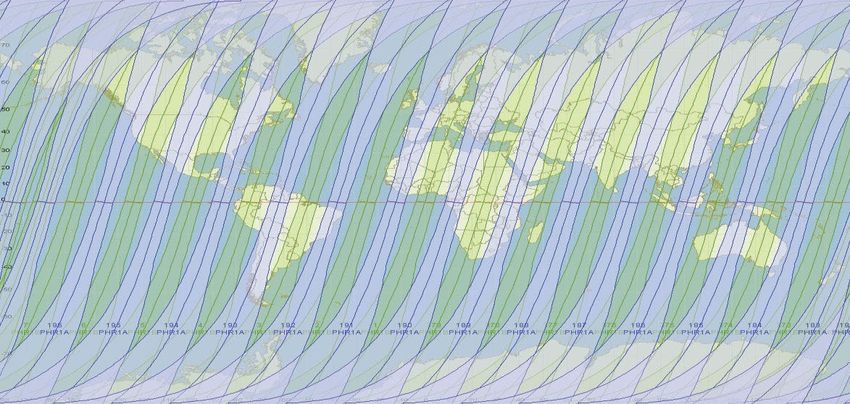
2. METHODOLOGY COMPONENTS
2.1 Satellite Positioning

FRACTALS represents the orbital location of satellites through use of the Simplified
General Perturbations 4 (SGP4) algorithm and the Two-Line Element (TLE) Set. The
TLE Set contains the orbital characteristics of a satellite at a single moment in time, and
the SPG4 algorithm will extrapolate the satellite’s orbital location at a specific time in the
future using the TLE set. Errors in orbital location will increase as the length of time
between the TLE set and the extrapolation increases. Up-to-date TLE sets for
commercial satellites can be obtained from websites such as www.n2yo.com. An
example of a TLE set extracted from Revisiting Spacetrack Report #3: Rev 2 (Vallado et
al., 2006) is presented in Figure 1.

 Figure 1. Example of TLE data

With the SGP4 algorithm and TLE sets, FRACTALS can predict the timing, duration,
and resolution for satellite coverage of an area of interest on the ground.

2.2 Global Coverage and Collection Methods

Coverage and revisit rate (how much of the earth you can see and how often) are two
defining features of satellite constellations. Figure 2, extracted from the Pléiades
Imagery User Guide (ASTRIUM, 2012), shows the global coverage available from two
satellites. Using both satellites with view angles within ±30°, the revisit rate is 1.3 days
or better above 40° latitude and 1.7 days at the equator. With view angles within ±45°,
daily revisits are possible. A nadir view has a view angle of 0° and is looking straight
down.

 2
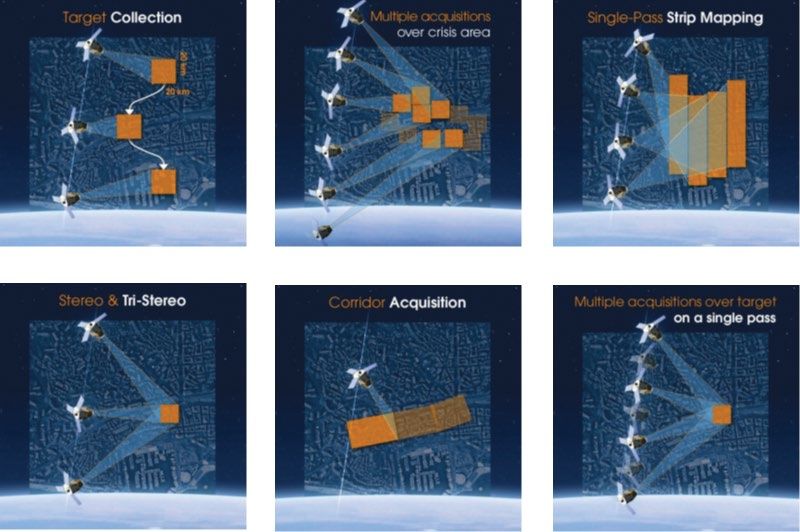
Figure 2. Pléiades 1A and 1B combined corridor of visibility for the same day (±30°)

There are various schemes for collecting satellite imagery. Figure 3 (also extracted
from Pléiades Imagery User Guide) presents six single-pass collection scenarios
available from the Pléiades satellite vendor.

 1. Target Collection: typically 20 target locations within 1000- × 1000-km area
 2. Multiple Acquisitions over a Crisis Area: typically 10 images over a 100- ×
 200-km area
 3. Single Pass Strip Mapping: up to five contiguous strips of 150 km each
 4. Stereo and Tri-Stereo: for 3D applications
 5. Corridor Acquisition: follow linear features such as borders, coastlines, rivers,
 roads, railways, and pipelines
 6. Multiple Acquisitions over a Single Target: up to 25 images over the same area
 for persistent surveillance mode to calculate speed and direction of moving
 targets

 3
Figure 3. Pléiades single-pass collection scenarios

2.3 Satellite Constellations

There are many commercial satellite operators in the business of providing, processing,
and analyzing imagery. Most vendors operate (or have access to) one or two satellites,
while a few vendors operate large constellations of satellites. With larger constellations
there can be multiple revisits to an area each day. Some vendors have goals to grow
their constellations to achieve a revisit rate of every 15 to 20 min.

To be useful for ISR applications, satellite imagery should have a resolution of 1 m or
less. This means that an image pixel projected on the ground should cover no more
than 1 m on a side. This resolution is sometimes referred to as Ground Sampling
Distance (GSD). Table 1 presents characteristics for the large commercial
constellations with sufficient resolution to perform ISR missions, where CE90 is the
circular error at the 90th percentile and NIIRS is the National Imagery Interpretability
Rating Scale. Some of the constellations will expand in 2022, as noted in the number of
satellites column in Table 1.

 4
Table 1. Commercial Satellite Constellation Information as of 4 January 2022

 Constellation No. of Altitude Nadir GSD NIIRS Swath Geolocation
 Name Satellites (km) (m) (km) Accuracy
 BlackSky 13 + 400‒500 0.8‒1.0 4.1‒3.8 6.6
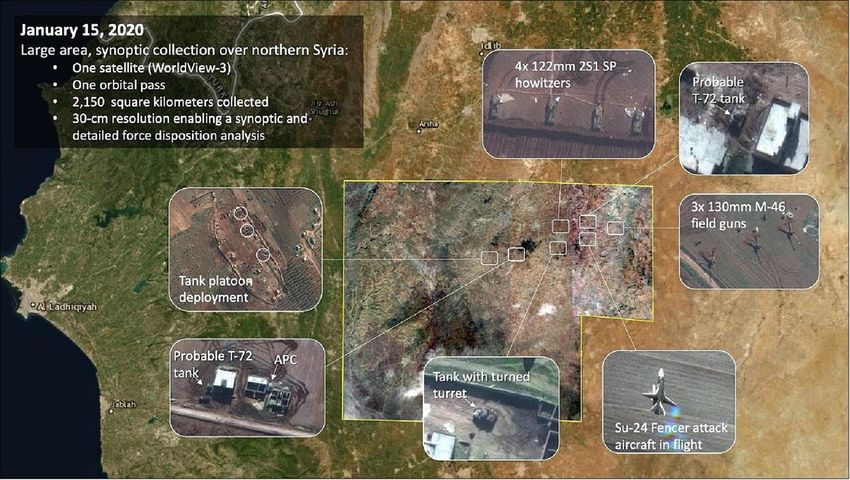
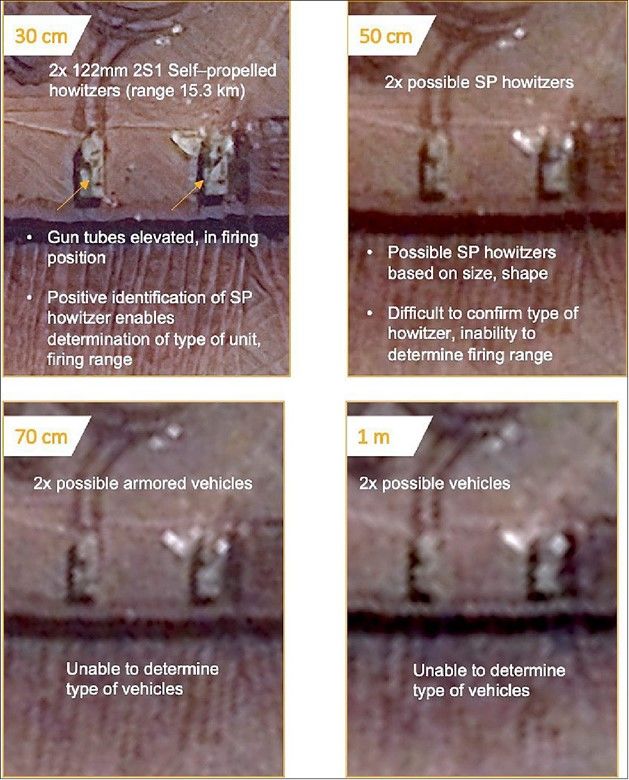
Figure 4. Resolution/GSD example from Maxar

In Figure 5 (EO Portal, 2022), Maxar presents a sample intelligence product available
from WorldView-3 30-cm resolution imagery. Various military equipment is identified in
this image collected over northern Syria.

 6
Figure 5. Maxar WordView-3 example intelligence product

2.5 Satellite Earth Geometry

To get accurate estimates of slant range (SR) and GSD, the curvature of the earth must
be considered. Figure 6 presents the Satellite Earth Observation Geometry, where hsat
is satellite altitude, RE is radius of the earth (6367.45 km), and α is viewing angle off
nadir (looking straight down). The equation for the incidence angle β is given in
Figure 6. When calculating GSD, β must be used, not α.

 7
Figure 6. Satellite earth geometry (from Pléiades Imagery User’s Guide)

SR is the green line in Figure 6 and can be determined by the Law of Cosines and the
Quadratic Equation.

 Law of Cosines
 2 = 2 + ( + ℎ )2 − 2 ( + ℎ ) ( )
 2 − 2( + ℎ ) ( ) + ( + ℎ )2 − 2 = 0

 Quadratic Equation
 = 1
 = −2( + ℎ ) ( )
 = ( + ℎ )2 − 2

 8
Two solutions to the quadratic equation follow. The shorter one (SR) touches the earth,
and the longer one (SRlonger) passes through the earth.

 − − √ 2 − 4
 =
 2

 − + √ 2 − 4
 =
 2

When the term under the square root sign becomes negative, the slant path misses the
earth entirely and the camera images atmosphere (earth limb) or space. The largest
viewing angle for which the slant path still touches the earth (term under square root in
the quadratic equation equals zero) is given by the following equation.

 = −1 � �
 + ℎ

GSD is the distance that one image pixel subtends on the ground, and IFOV is the
instantaneous field of view.

 ( )
 ( ) = ( ) 1000
 ( )
 ℎ( )
 ( ) =
 ℎ( )
 ℎ
 = −1 ��1 + � ( )�

 ℎ ( ) = ( ) ( ) 1000
 = � ℎ

The GSDvert calculated by NV-IPM uses α rather than β in the GSDvert equation (flat
earth assumption). This is not an issue for low altitudes, but could be an issue for
calculating NIIRS for satellites. (For Pléiades at a 695-km altitude, it is a difference of
4 cm in GSDvert for α = 30° and an underestimation of the SR by 15 km.) It is possible
to compensate for this with the Override Output feature in NV-IPM.

2.6 National Imagery Interpretability Rating Scale

NIIRS directly relates image quality to interpretation tasks that can be performed. NIIRS
is a 10-point scale, with 0 providing no useful information and 9 providing great detail.
GSD is a major component affecting the NIIRS ratings; however, sensor blur and noise
characteristics also play a role. Table 2 presents an approximate relationship between

 9
NIIRS and GSD. Figure 7 presents an excerpt from the Civil NIIRS Cultural Criteria
task table for NIIRS levels 5, 6, and 7 ([IRARS], 1996), equating to GSDs ranging from
0.20 to 1.2.

 Table 2. Nominal GSD Associate with NIIRS Level

 GSD
 NIIRS Rating
 (meters)
 0 NA
 1 >9.0
 2 4.5‒9.0
 3 2.5‒4.5
 4 1.2‒2.5
 5 0.75‒1.2
 6 0.40‒0.75
 7 0.20‒0.40
 8 0.10‒0.20
 9
NIIRS values are assigned to imaging systems, imagery, and imagery products by a
panel of trained image analysts; however, this can be an expensive and time-
consuming process. The General Image Quality Equation (GIQE) was developed as a
means to estimate NIIRS values for an imaging system.

The GIQE is modeled in NV-IPM as follows:

 = − 10 ( ∗ 100/2.54) + 10 ( ) − 0.656 − 0.344 /
 = 10.751 ( ℎ ) 10.251 ( )
 =
 =
 = ℎ
 =
 =
 ≥ 0.9, = 3.32 = 1.559
 < 0.9, = 3.16 = 2.817
NV-IPM can be used to calculate NIIRS, GSD, RER, H, G, and SNR. For the most part,
RER, H, and G do not vary much with range, Cn2, or altitude, and can be modeled as
constants in FRACTALS. However, GSD and SNR will need to be modeled explicitly.
GSD can be modeled as previously described in Section 2.5, Satellite Earth Geometry.

For NIIRS of thermal imagery in NV-IPM, SNR is a function of ∆T (difference in
temperature between the target and background) and atmospheric transmission. For
simplicity, FRACTALS can be provided with the SNR0 generated by NV-IPM when ∆T =
1 and atmospheric transmission is set to 1.0/km. SNR as a function of SR can be
generated as follows:

 ( ) = 0 ∗ ∆ ∗ ( )

For NIIRS of visible imagery in NV-IPM, SNR is a function of light level (LL), contrast,
atmospheric transmission, and sky over ground (SOG) ratio. For simplicity, FRACTALS
can be provided with the SNR0 for each light level generated by NV-IPM when target
contrast ( ) is 0.25, atmospheric transmission is set to 1.0/km, and SOG = 1 and
SNR as a function of SR and LL can be generated as follows:

 | | 1
 ( , ) = 0 ( ) ∗ ∗
 0.25 1
 1 + � − 1�
 ( )

 11
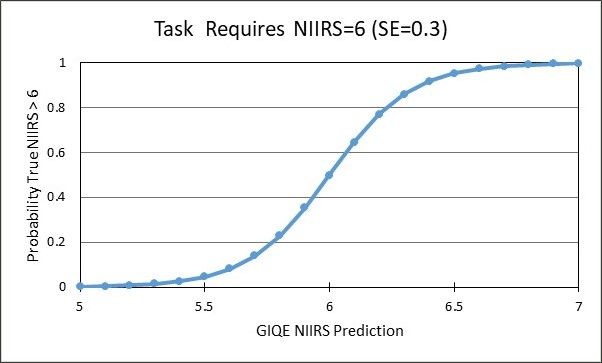
The following is a short description of work in progress to explore the possibility of
assessing a probability of accomplishing an NIIRS task (PANT).

 • There are uncertainties in the GIQE prediction. The standard errors (SEs) in the
 fit of the GIQE to the validation data sets are 0.3 for visual imagery and 0.38 for
 thermal imagery. Could the SE be used to assign a PANT? Figure 8 shows the
 cumulative distribution of possible NIIRS values when an NIIRS value of 6.0 is
 predicted by the GIQE (SE = 0.3). From Figure 8 it can be seen that the 95%
 confidence interval for the prediction is 6.0 ± 0.5 or (5.5, 6.5). Of course, this
 would imply that there is only a 0.5 probability of performing an NIIRS 6.0 task, a
 0.65 probability (1.0–0.35) of performing an NIIRS 5.9 task, and a 0.95
 probability (1.0–0.05) of performing an NIIRS 5.5 task when the GIQE predicts an
 NIIRS of 6.0.
 • Since it is unlikely that all image analysts will agree, there could also be some
 uncertainty in the NIIRS level assigned to a specific task. In Figure 7, an NIIRS
 of 5.5 was assigned to the task of identifying fallen utility poles. Was that derived
 from five image analysts assigning an NIIRS of 5.0 and five image analysts
 assigning an NIIRS of 6.0? This would give an average of 5.5 and a standard
 error of 0.167. DAC currently lacks a source for the SE associated with the
 historical NIIRS level task assignments.
 • Ideally, PANT estimates should take into account both sources of uncertainty
 (GIQE prediction error and NIIRS-level task assignment variability); thus, this
 PANT effort remains a work in progress.

 Figure 8. Cumulative distribution of possible NIIRS values when NIIRS 6.0 is predicted

 12
2.7 Potential Methodology Approaches

Per Satellite Approach:

 1. Determine the NIIRS and GSD required to perform the desired space-based ISR
 task. If the task does not have a predefined NIIRS value, surrogate the NIIRS
 value from a task perceived to be of similar difficulty. Due to the subjective
 nature of surrogation, it is best performed by a group rather than an individual. A
 simpler approach would be to select a GSD at which all desired spaced-based
 ISR tasks can be performed and skip the NIIRS approach.
 2. Determine the off-nadir viewing angle required to view a named area of interest
 (NAI) on the satellite's current pass.
 3. Calculate the NIIRS and GSD for the off-nadir viewing angle. Is NIIRS greater
 than or GSD less than what is required? If so, the desired space-based ISR
 tasks can be performed.

Window of Opportunity Approach:

 1. The satellite or constellation of satellites can only perform the task when the off-
 nadir viewing angle required to view the NAI is within ±X° (based on NIIRS or
 GSD required to perform the desired space-based ISR task).
 2. Using the predicted orbital paths for the constellation of satellites, what are the
 windows of opportunities to view the NAI?
 3. Execute missions in FRACTALS during these windows of opportunity. A second
 satellite pass may be required to perform the battle damage assessment.
 4. Cloud cover may negate a window of opportunity.

2.8 Partial Cloud Cover

Visible- and thermal-band satellite cameras cannot penetrate overcast cloud cover
conditions; however, these cameras can see through gaps in the cloud cover.

In the 1970s and 1980s, research was conducted in predicting the probability of cloud-
free line of sight (PCFLOS), the recurrence of CFLOS and the persistence of CFLOS.
PCFLOS is a function of the percent cloud cover reported and the view angle of the
LOS path; however, PCFLOS is relatively insensitive to the range of view angles
relevant to satellite imagery. Empirically, 50% cloud cover yields a PCFLOS of about
0.75, indicating that human observers tend to overestimate the reported cloud cover.

If a satellite has CFLOS to an NAI at time t0 and the next satellite has CFLOS to the NAI
20 min later at time t20, LOS is said to have recurred. If CFLOS exists during the entire
time between t0 and t20, LOS is said to have persisted over the 20 min. For the

 13
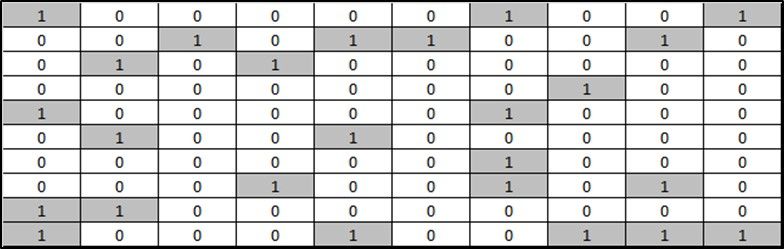
commercial satellite constellations, LOS recurrence is the relevant metric.
Mathematically, this could be represented by a bivariate Bernoulli distribution relating
the occurrence of CFLOS at a specific location at two different points in time.

The cloud maps in Figures 9 and 10 give an example of how recurrence could be
modeled.

 1. Place a grid over the NAI and let each grid cell represent 1 × 1 km for a total NAI
 of 10 × 10 km.
 2. Assume 50% cloud cover, which yields PCFLOS = 0.75.
 3. Randomly assess each cell against the 0.75. If the random number is
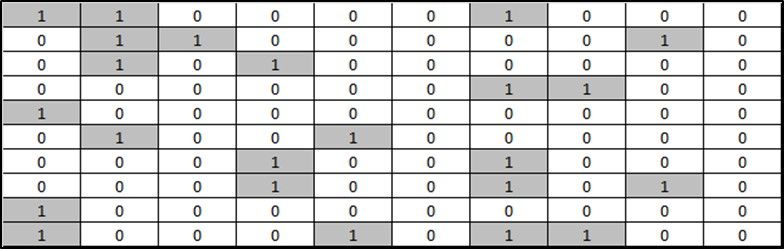
Figure 10. Cloud-free and cloud-blocked LOSs on a pass over the NAI 16 min after Figure 9

Some cells are cloud-blocked on both satellite passes, but could have CFLOS on a
subsequent satellite pass.

 15
3. CONCLUSION
The Army Modeling and Simulation Office has funded a DAC effort to develop
methodologies for representing the performance of commercial, national, and military
space and low-earth-orbit assets and their impact on joint operations with a test
implementation within the FRACTALS simulation framework.

Visible-band camera imagery providing 1-m or better resolution was the focus of the
methodology components discussed. Current commercial satellite constellations that
meet this resolution requirement were identified. FRACTALS has implemented the
SGP4 algorithm to represent the orbital paths of the satellites. Methods for calculating
NIIRS and GSD were presented. A method for representing the effect of partial cloud
cover was also addressed.

 16
4. REFERENCES
ASTRIUM (an EADS Company). (2012, October). Pléiades Imagery User Guide, v2.0.

EO Portal Directory. (2022). WorldView legion constellation.
 https://directory.eoportal.org/web/eoportal/satellite-missions/v-w-x-y-z/worldview-
 legion

Harclerode, Eric. (2021, June 9). Sensors: space ISR modeling and simulation gap ID
 no. S.4 Army M&S enterprise capability gap white paper. U.S. Army Combat
 Capabilities Development Command Analysis Center.

[IRARS] Imagery Resolution Assessments and Reporting Standards (IRARS)
 Committee. (1996, March). Civil NIIRS reference guide appendix II: additional
 NIIRS criteria. https://fas.org/irp/imint/niirs_c/app2.htm

Vallado, David, Crawford, Paul, Hujsak, Richard, & Kelso, T.S. (2006). Revisiting
 Spacetrack Report #3: Rev2. American Institute of Aeronautics and
 Astronautics Report No.: AIAA 2006-6753-Rev2.

 17
– List of Acronyms

 A-1
3D three-dimensional
CE90 circular error 90%
CFLOS cloud-free line of sight
DAC DEVCOM Analysis Center
DEVCOM U.S. Army Combat Capabilities Development Command
EO electro-optical
FRACTALS Framework for Capability-based Tactical Analysis Libraries and
 Simulations
G additional noise gain
GIQE General Image Quality Equation
GSD Ground Sampling Distance
H edge overshoot
IFOV Instantaneous Field of View
IR infrared
ISR intelligence, surveillance, reconnaissance
LL light level
LOS line of sight
M&S Modeling and Simulation
NAI named area of interest
NIIRS National Imagery Interpretability Rating Scale
NV-IPM Night Vision – Integrated Performance Model
PANT probability of accomplishing an NIIRS task
PCFLOS probability of cloud-free line of sight
RE radius of earth
RER relative edge response
SE standard error
SGP4 Simplified General Perturbations 4
SNR signal to noise ratio
SOG sky over ground
SP self-propelled
SR slant range
TLE Two-Line Element

 A-1
– Distribution List

 B-2
ORGANIZATION

DEVCOM Army Research Laboratory
FCDD-RLD-DCI/Tech Library
2800 Powder Mill Rd.
Adelphi, MD 20783

Defense Technical Information Center
ATTN: DTIC-O
8725 John J. Kingman Rd.
Fort Belvoir, VA 22060-6218

DEVCOM Analysis Center
FCDD-DAE-I/John P. Mazz
6896 Mauchly St.
Aberdeen Proving Ground, MD 21005-5071

U.S. Army Center for Army Analysis
ATTN: CPT Larraine G. Dunwoody
6001 Goethals Road
Fort Belvoir, VA 22060-5230

 B-3
You can also read