Radiofrequency Exposure Levels from Mobile Phone Base Stations in Outdoor Environments and an Underground Shopping Mall in Japan
←
→
Page content transcription
If your browser does not render page correctly, please read the page content below
International Journal of
               Environmental Research
               and Public Health

Article
Radiofrequency Exposure Levels from Mobile Phone Base
Stations in Outdoor Environments and an Underground
Shopping Mall in Japan
Teruo Onishi * , Miwa Ikuyo, Kazuhiro Tobita, Sen Liu, Masao Taki and Soichi Watanabe

                                           National Institute of Information and Communications Technology, Tokyo 184-8795, Japan;
                                           m_ikuyo@nict.go.jp (M.I.); ka_tobita@nict.go.jp (K.T.); liusen@nict.go.jp (S.L.); m_taki@nict.go.jp (M.T.);
                                           wata@nict.go.jp (S.W.)
                                           * Correspondence: t_onishi@nict.go.jp

                                           Abstract: Recent progress in wireless technologies has made human exposure to electromagnetic
                                           fields (EMFs) increasingly complex. The situation can increase public concerns related to possible
                                           health effects due to EMF exposure. Monitoring EMF exposure levels and characterizing them are
                                           indispensable for risk communications of human exposure to EMFs. From this background, a project
                                           on the acquisition, accumulation, and applications of EMF exposure monitoring data in Japan was
                                           started in 2019. One of the objectives of this project is to obtain a comprehensive picture of EMF
                                           exposure in actual daily lives. In 2019 and 2020, we measured the electric field (E-field) strength from
                                 mainly mobile phone base stations in the same areas as those in measurements conducted in 2006

                                           and 2007 by the Ministry of Internal Affairs and Communications (MIC), Japan, and compared the
Citation: Onishi, T.; Ikuyo, M.;
                                           data to investigate the time-course of the EMF environment. The number of measured points was
Tobita, K.; Liu, S.; Taki, M.; Watanabe,
                                           100 (10 × 10 grids) in an area of 1 km × 1 km in two urban and two suburban areas, and that in
S. Radiofrequency Exposure Levels
                                           an underground shopping mall was 158. This large-scale study is the first in Japan. As a result, we
from Mobile Phone Base Stations in
Outdoor Environments and an
                                           found that the measured E-field strengths tended to be higher in 2019 and 2020 than those in 2006
Underground Shopping Mall in               and 2007, especially in the mall. However, the median ratios to the Japanese radio wave protection
Japan. Int. J. Environ. Res. Public        guideline values for urban areas and malls are lower than −40 dB.
Health 2021, 18, 8068. https://
doi.org/10.3390/ijerph18158068             Keywords: EMF exposure levels; monitoring; mobile base stations; outdoor environment; underground
                                           shopping mall; Japan
Academic Editors: Valentina Hartwig
and Giuseppe Acri

Received: 30 June 2021                     1. Introduction
Accepted: 26 July 2021
                                                 Owing to the practical application of the fifth-generation mobile communication sys-
Published: 30 July 2021
                                           tem (5G), whose commercial services were launched in Japan in 2020, the Internet of Things
                                           (IoT), wireless power transfer (WPT), etc., are increasing the opportunities for exposure to
Publisher’s Note: MDPI stays neutral
                                           electromagnetic fields (EMFs) in a wide range of frequencies from low- to high-frequency
with regard to jurisdictional claims in
published maps and institutional affil-
                                           bands over various wireless devices. Data are insufficient to actually evaluate the levels of
iations.
                                           exposure from various EMF sources and to grasp the transition of wireless technologies in
                                           an individual’s various activities in daily life. Research on exposure level monitoring has
                                           already been conducted mainly in Europe and other countries [1–20]. In some countries,
                                           the exposure levels from mobile phone base stations and broadcasting transmission towers
                                           have been monitored and disclosed [1–8]. In 2012, a comparative international analysis of
Copyright: © 2021 by the authors.
                                           radiofrequency (RF) exposure surveys was reported, which included measurement results
Licensee MDPI, Basel, Switzerland.
                                           in 23 countries between 2000 and 2010 [1]. The paper mainly reported exposure levels
This article is an open access article
                                           from Global System for Mobile Communications (GSM) and Wideband Code Division
distributed under the terms and
conditions of the Creative Commons
                                           Multiple Access (WCDMA) base stations. Joseph et al. also reported their measurement
Attribution (CC BY) license (https://
                                           results in three European countries (Belgium, The Netherlands, and Sweden) [2]. Kim
creativecommons.org/licenses/by/           et al. reported exposure levels from mobile base stations and broadcast towers in Korea [3].
4.0/).                                     Joseph et al. also evaluated exposure levels for Long-Term Evolution (LTE), which is the

Int. J. Environ. Res. Public Health 2021, 18, 8068. https://doi.org/10.3390/ijerph18158068                         https://www.mdpi.com/journal/ijerph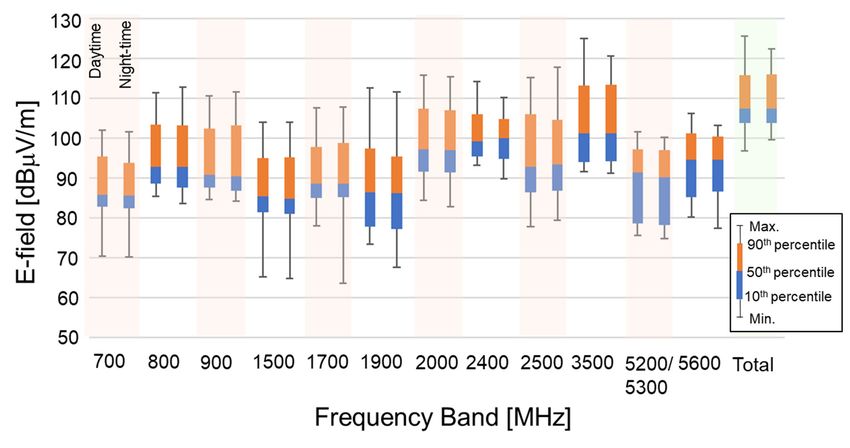
Int. J. Environ. Res. Public Health 2021, 18, 8068                                                                             2 of 10

                                        fourth-generation mobile communication system (4G) [9]. Since a large area cannot be
                                        covered by fixed measurements, car mounted measurement methods were studied [10,11].
                                        The disadvantage of this method is that the accuracy is less than that of a fixed measure-
                                        ment. Joseph et al. introduced an exposure assessment using drones [12]. It provides
                                        three-dimensional measurements at locations that are difficult to access. Another exposure
                                        measurement method is the use of a portable device that enables the measurement of
                                        the electric field (E-field) around the human body. Since the above measurements cannot
                                        constantly monitor an individual’s exposure, it is useful for us to use a portable device,
                                        especially for an epidemiological study. Sagar et al. reported the results of their measure-
                                        ments using portable devices conducted in Switzerland, Ethiopia, Nepal, South Africa,
                                        Australia, and the United States of America [13]. Another important point is to investigate
                                        the actual EMF level in the vicinity of a mobile phone, because they are usually used close
                                        to the head and the body. Thus, exposure levels from mobile phones were also evaluated
                                        in other countries [14–16]. Since it is difficult to evaluate exposure levels anywhere and
                                        anytime, some techniques to extrapolate and estimate using measurement or simulation
                                        data are proposed and studied [17–21]. The artificial neural network is a potential candi-
                                        date to improve prediction accuracy. Recently, 5G services have been introduced in some
                                        countries. Measurement methods for exposure levels from 5G base stations and mobile
                                        phones have been studied [4–7,16]. Such research, however, has not been performed so far
                                        in Japan.
                                             With the above as background, since 2019, we have been conducting research to
                                        mainly quantitatively determine the actual state of exposure to EMFs in daily life and to
                                        examine the appropriate manner of risk communication.
                                             In this paper, we report the results of E-field measurements related to mobile phone
                                        base stations, which are one of the main sources of exposure in a general environment,
                                        in outdoor environments and an underground shopping mall in Japan in 2019 and 2020.
                                        The measurements were conducted in the same areas as those in measurements carried
                                        out by the Ministry of Internal Affairs and Communications (MIC), Japan, in 2006 and
                                        2007 [22,23]. Although the present measurement conditions are not precisely the same as
                                        those in the previous measurements, it is useful to investigate the time-course of the EMF
                                        environment. A survey of time-courses in some countries before 2010 was reported in [1].
                                        A critical point of our study is that it shows recent comparison results in the same areas of
                                        both outdoor and indoor environments.

                                        2. Materials and Methods
                                              In 2006, the E-field strength was measured at 100 points (10 × 10 grids) in an area of
                                        1 km × 1 km in two urban and two suburban areas [22]. In addition, similar measurements
                                        were conducted at 158 points in an underground shopping mall in 2007 [23]. In this study,
                                        E-field strength measurements in the same areas (Urban areas—A and B and Suburban
                                        areas—A and B) and the same underground shopping mall as described in the previous
                                        reports [22,23] were conducted using a spectrum analyzer (SA) with a three-axis isotropic
                                        E-field probe (SRM-3006, Narda S.T.S. GmbH) in 2019 and 2020. Either the E-field, magnetic
                                        field, or incident power density can be used for RF exposure assessment. We selected
                                        the E-field so that the obtained results could be directly compared with past results. The
                                        measurements in the mall were conducted during the daytime (9:00–16:30) and night-time
                                        (17:00–22:30), similar to the previous measurements, whereas the measurements in the
                                        outdoor environment were carried out from 8:30 to 17:30. Note that the shopping mall
                                        is directly connected to one of Japan’s major stations and is usually crowded day and
                                        night. However, there were slightly fewer people than usual due to COVID-19 when the
                                        measurements were performed. The frequency bands we mainly measured for E-field
                                        strengths are 700, 800, 900, 1500, 1700, 2000, 2500, and 3500 MHz, which were allocated
                                        for mobile phone systems in Japan at that time. Measurements were also carried out in
                                        the industrial, scientific, and medical (ISM) bands used for wireless local area network
                                        (LAN) and 1900 MHz band used for personal handy-phone system (PHS). Note that 5G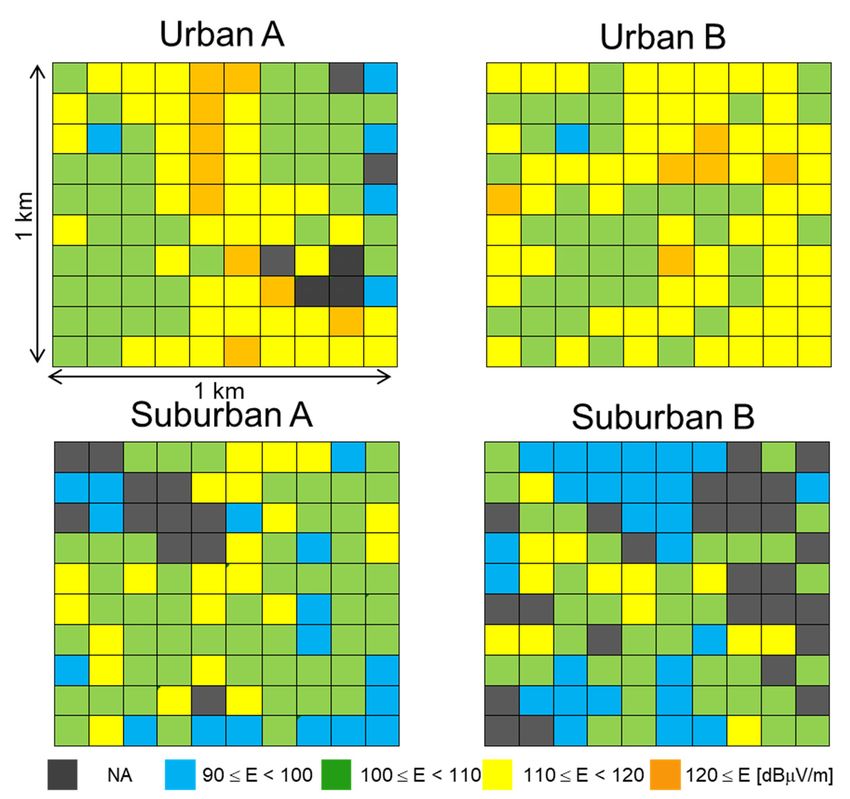
Int. J. Environ. Res. Public Health 2021, 18, 8068                                                                                  3 of 10

                                        was not considered for the measurements in 2019 and 2020 because 5G services were not
                                        available yet in Japan at the time when the outdoor measurements were conducted, and
                                        5G services were not available in the mall in 2020. The resolution bandwidth (RBW) and
                                        video bandwidth (VBW) of the spectrum analyzer were set to 1 MHz [24] and 100 kHz,
                                        respectively. From the viewpoint of radio wave protection, an average E-field strength over
                                        6 min is required instead of an instantaneous value [25]. It was reported that the E-field
                                        strength averaged over 1 min only varied within 0.5 dB from that over 6 min [26]. Similar
                                        results were obtained by our measurements as shown in Table 1. Therefore, 1 min was
                                        used to obtain the average E-field strength to reduce measurement time. First, the probe
                                        was swept in the vertical direction between 10 and 200 cm at 10 cm intervals above the
                                        ground or floor at each measurement point to determine the height at which the E-field
                                        strength was maximum according to [27,28]. The probe was fixed to a probe holder made
                                        of fiber reinforced plastics (FRPs) and connected to the SA with a dedicated cable, so as to
                                        reduce the effect of the human body (i.e., the operator) during measurements. Then, the
                                        E-field strength was measured, and the average over 1 min at the height was obtained. The
                                        square root of the sum of the squares of the measured field strengths (Eint ) was calculated
                                        by Equation (1) [29] to obtain the field strengths for each desired frequency band. ∆f is
                                        a frequency resolution (Hz), and f 1 and f 1 + (n − 1) × ∆f are the lowest and highest
                                        frequencies in a desired frequency bandwidth, respectively.
                                                                           v
                                                                                           n −1
                                                                                   ∆f
                                                                           u
                                                                                           ∑ (E( f1 + k∆ f ))2
                                                                           u
                                                                   Eint   =t                                                           (1)
                                                                               1.0552RBW   k =0

                                        Table 1. Maximum deviations of E-field strength averaged over 1 min from that averaged over 6 min.

                                           Frequency Range [MHz]                700                  1500                   2100
                                           Maximum deviation [dB]               0.5                   0.6                    0.5

                                        3. Results
                                             Examples of the measurement results in the outdoor environments and the under-
                                        ground shopping mall are shown in Figures 1 and 2 as a color map, respectively. The total
                                        E-field strength is shown as the effective value obtained by integrating (the square root of
                                        the sum of squares) them all over the desired frequency bands. The NA (black) indicates
                                        that the measurement was not possible because the area was private land, a forest, or
                                        another type. The E-field strength in the urban areas including the mall tends to be larger
                                        than that in the suburban areas.
                                             Figure 3 shows the maximum; the 90th, 50th (median), and 10th percentiles; and the
                                        minimum E-field strengths for each frequency band in the outdoor environments. As
                                        described in Section 2, measurements at frequency bands for 5G were not carried out
                                        because 5G services were not yet available in 2019. The total median E-field strengths in the
                                        urban areas were about 7 dB larger than those in the suburban areas, as shown in Figure 1.
                                        The E-field strengths in the urban areas also tended to be larger than those in the suburban
                                        areas in the individual frequency bands. In particular, the regional differences between the
                                        urban and suburban areas were remarkable except for the 800, 900, and 2000 MHz bands.
                                        The E-field strengths in the suburban areas were about 20 dB smaller than those in the
                                        urban areas in the 3500 MHz band. Furthermore, the E-field strengths in the 700 MHz band
                                        were about 10 to 20 dB lower than those in the other mobile phone bands. Since these two
                                        frequency bands have been allocated recently, it seems that the installation of base station
                                        equipment for these bands is in progress. It is also obvious that the E-field strengths in the
                                        1900 and 2400 MHz bands were lower as well.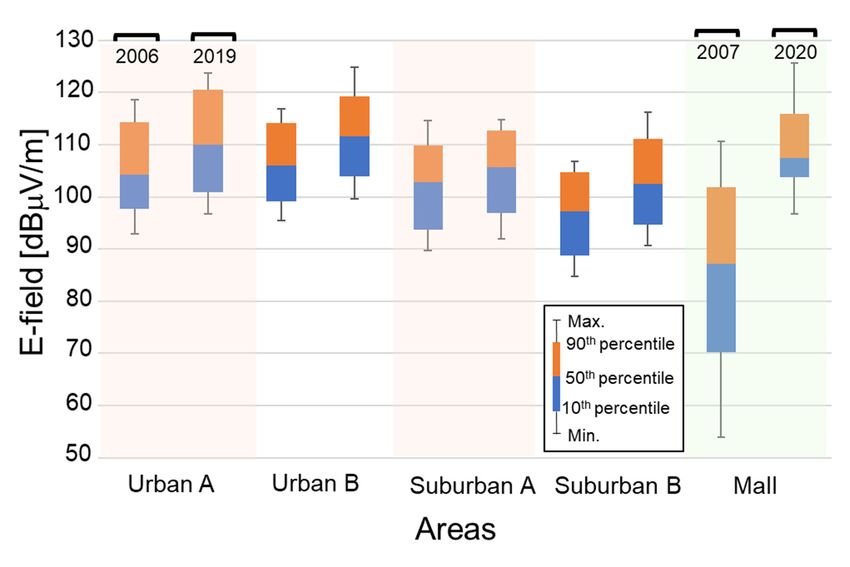
Int.
 Int. J.J.Environ.
          Environ. Res.
                   Res.Public
                        PublicHealth
                              Health2021,
                                     2021,18,
                                           18,x8068
                                                FOR PEER REVIEW                                                                      44 of
                                                                                                                                        of 10
                                                                                                                                           10

                                    Figure1.
                                    Figure   E-fieldstrength
                                           1.E-field strengthin
                                                              inall
                                                                allfrequency
                                                                    frequency bands
                                                                              bands in
                                                                                     in the
                                                                                         the outdoor
                                                                                             outdoor environments.
                                                                                                     environments.

                                    Figure
                                    Figure 2.
                                           2. E-field
                                              E-field strength
                                                      strength in
                                                                in all
                                                                   all frequency
                                                                        frequency bands
                                                                                  bands in
                                                                                        in the
                                                                                           the underground
                                                                                               underground shopping mall.

                                          Figure34shows
                                          Figure     also shows    the E-fieldthe
                                                             the maximum;        strength   distribution
                                                                                    90th, 50th  (median),inand
                                                                                                             each  frequency
                                                                                                                10th           band
                                                                                                                      percentiles;   in the
                                                                                                                                   and   the
                                     mall. It is clear that the differences   in E-field  strength between    daytime   and
                                    minimum E-field strengths for each frequency band in the outdoor environments. As de-   night-time   are
                                     marginal.    The  E-field strengths  in  the  2000  and  3500 MHz   bands    are larger
                                    scribed in Section 2, measurements at frequency bands for 5G were not carried out becausethan  those  in
                                     other bands.   For   example,  about  5  and   10 dB  smaller median    values  were observed
                                    5G services were not yet available in 2019. The total median E-field strengths in the urban       in the
                                     800 and
                                    areas  were900about
                                                    MHz7bands     thanthan
                                                            dB larger  in the   2000inand
                                                                             those      the3500  MHz areas,
                                                                                             suburban  bands,as respectively. The median
                                                                                                                  shown in Figure    1. The
                                     E-field  strength   in the 2400  MHz     ISM    band  is the same  as  that  in the 2000
                                    E-field strengths in the urban areas also tended to be larger than those in the suburban   MHz    band,
                                     whereas the median E-field strengths in the 5000 MHz ISM bands are 5–9 dB smaller than
                                    areas in the individual frequency bands. In particular, the regional differences between
                                     in the 2000 and 2400 MHz bands. One of the reasons may be that the antennas of wireless
                                    the urban and suburban areas were remarkable except for the 800, 900, and 2000 MHz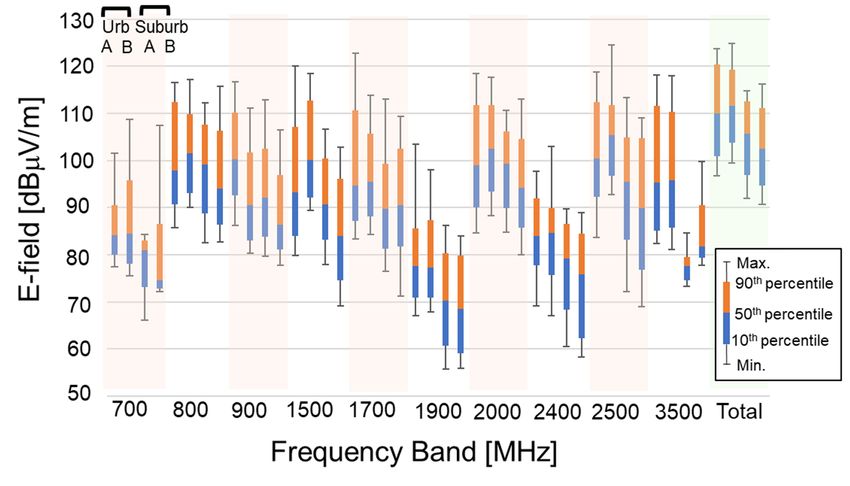
Int. J. Environ. Res. Public Health 2021, 18, x FOR PEER REVIEW 5 of 10
bands. The E-field strengths in the suburban areas were about 20 dB smaller than those
Int. J. Environ. Res. Public Health 2021, 18, 8068
in the urban areas in the 3500 MHz band. Furthermore, the E-field strengths in the5 700 of 10
MHz band were about 10 to 20 dB lower than those in the other mobile phone bands. Since
these two frequency bands have been allocated recently, it seems that the installation of
base
LANstation equipment
equipment (access for these
point; AP)bands is in progress.
are densely located onItthe
is also obvious
ceiling, that
and the the E-field
wireless LAN
strengths in the 1900 and 2400 MHz bands were lower as well.
is frequently used by passers-by and people in coffee shops, restaurant, and stores.
Figure 3. Statistical distribution of E-field strength in each frequency band and total frequency bands
in the outdoor environments.
Figure 4 also shows the E-field strength distribution in each frequency band in the
mall. It is clear that the differences in E-field strength between daytime and night-time are
marginal. The E-field strengths in the 2000 and 3500 MHz bands are larger than those in
other bands. For example, about 5 and 10 dB smaller median values were observed in the
800 and 900 MHz bands than in the 2000 and 3500 MHz bands, respectively. The median
E-field strength in the 2400 MHz ISM band is the same as that in the 2000 MHz band,
whereas the median E-field strengths in the 5000 MHz ISM bands are 5–9 dB smaller than
in the 2000 and 2400 MHz bands. One of the reasons may be that the antennas of wireless
LAN
Figureequipment
3. Statistical(access point;
distribution AP) are
of E-field densely
strength located
in each on the
frequency ceiling,
band and
and total the wireless
frequency bands
Figure 3. Statistical distribution of E-field strength in each frequency band and total frequency bands
LAN
in theis frequently
outdoor used
environments.
in the outdoor environments.
by passers-by and people in coffee shops, restaurant, and stores.
Figure 4 also shows the E-field strength distribution in each frequency band in the
mall. It is clear that the differences in E-field strength between daytime and night-time are
marginal. The E-field strengths in the 2000 and 3500 MHz bands are larger than those in
other bands. For example, about 5 and 10 dB smaller median values were observed in the
800 and 900 MHz bands than in the 2000 and 3500 MHz bands, respectively. The median
E-field strength in the 2400 MHz ISM band is the same as that in the 2000 MHz band,
whereas the median E-field strengths in the 5000 MHz ISM bands are 5–9 dB smaller than
in the 2000 and 2400 MHz bands. One of the reasons may be that the antennas of wireless
LAN equipment (access point; AP) are densely located on the ceiling, and the wireless
LAN is frequently used by passers-by and people in coffee shops, restaurant, and stores.
Statisticaldistribution
Figure4.4.Statistical
Figure distributionof
ofE-field
E-fieldstrength
strengthin
ineach
eachfrequency
frequencyband
bandand
andtotal
totalfrequency
frequencybands
bands
inthe
in themall.
mall.
4. Discussion
4.1. Exposure Levels Compared with Limits
Measurement results were compared with limits in general environments in the radio
wave protection guidelines in Japan, as shown in Table 2. The E-field strength in the radio
wave protection guidelines is proportional to the square root of the frequency in between
300 MHz and 1.5 GHz and is constant at 61.4 V/m (155.76 dBµV/m) at frequencies above
1.5 GHz [25]. The minimum E-field strength in the guidelines at the target frequency of
this measurement is 44.1 V/m (152.89 dBµV/m). Therefore, the ratio to the guideline value
in each frequency band and the sum of squares were calculated. A measurement of 0 dB
Figure
means4.the
Statistical distribution
same level as the of E-fieldAs
limits. strength
showninineach frequency
Table band and total
2, the maximum frequency
ratios in the bands
urban
in the mall.
areas and the mall are about 10 times higher than those in the suburban areas; however,
they were lower than −20 dB from the level of the Japanese guidelines. If we focus on the
median value, the ratio is approximately on the order of the −40 dB from the limit.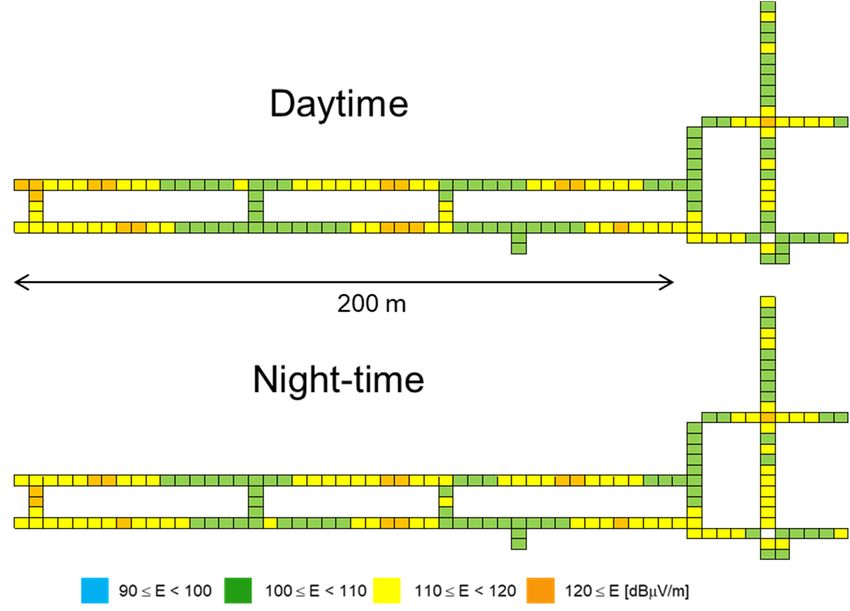
Int. J. Environ. Res. Public Health 2021, 18, 8068                                                                                  6 of 10

                                        Table 2. Ratio of E-field strength to values in the Japanese guidelines.

                                                                                              Ratio [dB]
                                               Item                                                                     Mall     Mall
                                                          Urban-A       Urban-B      Suburban-A       Suburban-B
                                                                                                                       (Day)    (Night)
                                           Maximum          −29.2           −28.1         −38.2            −36.8       −30.1     −33.1
                                            Median          −42.9           −41.4         −47.3            −50.4       −48.0     −48.2

                                        4.2. Comparison of Present Data with Previous Data
                                              The measurement results in 2019 and 2020 were compared with those in 2006 and 2007.
                                        The numbers of mobile phone base stations in Japan were about 475,000 (excluding femto-
                                        cell base stations) in 2020 and 140,000 in 2006 [30]. This means that the current number
                                        of the base stations is about 3.4 times more. Table 3 summarizes the downlink frequency
                                        bands of mobile phone base stations and the generations of mobile phone systems. Note
                                        that the PHS and mobile phone systems operating in the 2500 and 3500 MHz bands use
                                        the time division duplex (TDD). In 2006, the second-generation (2G) and third-generation
                                        (3G) mobile phone systems and PHS were the only systems in operation. The available
                                        frequency bands at that time for measurements were the 800, 1500, 1700, and 2000 MHz
                                        bands [22,23]. On the other hand, it can be seen that the total bandwidth increased 3.1-fold,
                                        and frequencies higher than the 2000 MHz band were newly used at the time we conducted
                                        the measurement. Other important conditions, such the transmission power and antenna
                                        gain of the base station, which are directly related to the E-field strength, are unknown
                                        because these are not disclosed as far as we know.

                                        Table 3. Frequency and bandwidth of mobile phone systems except for 5G.

                                                                             2006/2007                              2019/2020
                                          Frequency Band
                                              (MHz)             Bandwidth                                  Bandwidth
                                                                                     Generation                             Generation
                                                                  (MHz)                                      (MHz)
                                                  700                 -                     -                  30              4G
                                                  800                44                  2G/3G                 30            3G/4G
                                                  900                 -                     -                  15              4G
                                                 1500                27                    2G                 35               4G
                                                 1700                20                    3G                 75               4G
                                                 1900               32.6                  PHS                  31          PHS/TD-LTE
                                                 2000                60                    3G                 60             3G/4G
                                                 2500                 -                     -                 100             BWA
                                                 3500                 -                     -                 200              4G
                                                 Total              183.6                   -                 576               -

                                              To compare the past and present results, the ratio of the maximum to the time-averaged
                                        E-field strengths was evaluated at each frequency band because the past measurements
                                        were not conducted based on time-averaged values but on the maximum hold. Table 4
                                        summarizes the ratios in the outdoor environments and the underground mall. The ratios
                                        are almost the same even though the environments were different. The comparison was
                                        performed using the E-field strengths obtained by dividing the E-field strengths in 2006
                                        and 2007 with the ratios. Figure 5 shows the statistical distribution of E-field strengths
                                        in all frequency bands in both areas in 2019 and 2020 compared with those in 2006 and
                                        2007. It is validated with statistical significances by the t-test (p < 0.001) that the E-field
                                        strengths in the outdoor environment are increased. It is also clear that the median E-
                                        field strengths in the mall increased from 2007 to 2020 at the ratio of 20.3 dB. Note that
                                        similar tendencies are obtained even though only frequency bands allocated in the past
                                        are considered. It is presumed that the increase in E-field strength may be related to the
                                        increase in the number of base stations in 2020, which is 3.4 times more, as well as the
                                        frequency bands. In addition, E-field strengths in the mall are compared point by point
field strengths in all frequency bands in both areas in 2019 and 2020 compared with those
in 2006 and 2007. It is validated with statistical significances by the t-test (p < 0.001) that
the E-field strengths in the outdoor environment are increased. It is also clear that the
median E-field strengths in the mall increased from 2007 to 2020 at the ratio of 20.3 dB.
Note that similar tendencies are obtained even though only frequency bands allocated in
Int. J. Environ. Res. Public Health 2021, 18, 8068 7 of 10
the past are considered. It is presumed that the increase in E-field strength may be related
to the increase in the number of base stations in 2020, which is 3.4 times more, as well as
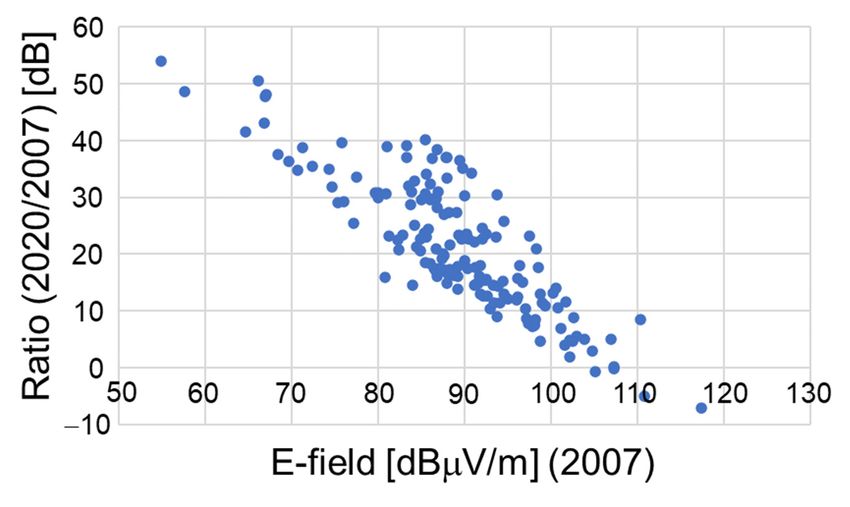
the frequency bands. In addition, E-field strengths in the mall are compared point by point
asasshown
shownininFigure
Figure6.6.The
Theinteresting
interestingobservation
observationisisthat
thatthe
theratio
ratioincreased
increasedas
asthe
theE-field
E-field
strengths in 2007 decreased.
strengths in 2007 decreased.
Table
Table4.4.Ratio
Ratioof
ofthe
themaximum
maximumE-field
E-fieldstrength
strengthto
tothe
the time-averaged
time-averaged E-field
E-field strength.
strength.
Ratio [dB] in Each Frequency Band
Ratio [dB] in Each Frequency Band
Location
Location 800 [MHz] 1500 1700 2100
800 [MHz] 1500 1700 2100
Outdoor environments 7.0 8.0 8.4 8.1
Outdoor environments 7.0 8.0 8.4 8.1
Underground mall 7.5 8.2 9.4 8.3
Underground mall 7.5 8.2 9.4 8.3
Int. J. Environ. Res. Public Health 2021, 18, x FOR PEER REVIEW 8 of 10
Figure 5. E-field strength distributions in all frequency bands.
Figure 5. E-field strength distributions in all frequency bands.
Figure 6. Ratio of E-field strengths in 2020 to those in 2007 point by point in all frequency bands.
Figure 6. Ratio of E-field strengths in 2020 to those in 2007 point by point in all frequency bands.
4.3. Comparison with Other Countries
4.3. Comparison with Other
A comparative Countries
international analysis among 23 countries was performed by Rowley
and A
Joyner in 2012 international
comparative [1], which included
analysis part
among of the Japanesewas
23 countries results. The data
performed for the
by Rowley
analysis were measured between 2000 and 2010 depending on countries. The average
and Joyner in 2012 [1], which included part of the Japanese results. The data for the anal-
power
ysis density
were was 0.0567
measured µW/cm
between 20002and
, which
2010isdepending
equal to 113.3
on dBµV/m
countries.for
Theover 21 countries.
average power
Additionally,
density time-course
was 0.0567 μW/cmresults
2 among
, which fivetocountries
is equal were analyzed,
113.3 dBμV/m which
for over 21 showed
countries. that
Addi-
tionally, time-course results among five countries were analyzed, which showed that ex-
posure levels were not markedly different. Our estimated E-field strengths in outdoor en-
vironments reported in 2006 [21], as shown in Figure 5, are approximately 10 dB smaller
than those reported in [1]. This tendency is similar to that described in [1]. However, ourInt. J. Environ. Res. Public Health 2021, 18, 8068 8 of 10
exposure levels were not markedly different. Our estimated E-field strengths in outdoor
environments reported in 2006 [21], as shown in Figure 5, are approximately 10 dB smaller
than those reported in [1]. This tendency is similar to that described in [1]. However, our
results indicate that E-field strengths in 2019 and 2020 increased compared with the past
results, contrary to [1]. Ofcom, UK, reported its measurement results using the SRM-3006
equipment [6], which is the same equipment used in our study. Measurements were
carried out including the 5G base stations in 22 locations across England, Scotland, Wales,
and Northern Ireland. The highest exposure level in measurements including the 5G
system was approximately 1.5% (−18.2 dB) of the reference level of the International
Commission on Non-Ionizing Radiation Protection (ICNIRP). Since the highest level for
only 5G is 0.039% (−34.1 dB), other systems, i.e., 2G, 3G, and 4G mobile base stations,
are the predominant radiation sources in the measurements. The exposure levels in the
22 locations were between 0.04% (−34 dB) and 1.5% (−18.2 dB). Our results in the outdoor
environments were −29.2 dB and −28.1 dB in the urban areas A and B and −38.2 dB and
−36.8 dB in the suburban areas A and B, respectively, as shown in Table 2. The values we
obtained in outdoor environments are slightly smaller than those in the UK.
5. Conclusions
The results of E-field strength measurements in mobile phone base stations, which are
one of the main sources of EMF exposure in the general environment, namely in outdoor
environments and an underground shopping mall in Japan in 2019 and 2020, have been
presented. The measurements were conducted in the same areas as those conducted by
MIC, Japan, in 2006 and 2007.
As a result, we found that the total median E-field strengths in the urban areas are
about 7 dB larger than those in the suburban areas. The E-field strengths in the urban areas
also tend to be larger than those in the suburban areas in individual frequency bands. For
the shopping mall, it is clear that the differences in E-field strengths between daytime and
night-time are marginal. The E-field strengths in the 2000 and 3500 MHz bands are larger
than those in other bands. The E-field strengths in the 2400 MHz ISM band are the same as
those in the 2000 MHz band, whereas the median E-field strengths in the 5000 MHz ISM
bands are 5–9 dB smaller.
The measured results were compared with the Japanese radio wave protection guide-
lines. As a result, we found amounts lower than the limits by −20 dB. If the median E-field
strength is focused on, the ratio is approximately on the order of −40 dB with respect to
the limit. Compared with the previous data in 2006 and 2007, it is clear that the E-field
strengths in both outdoor environments and the mall increased, especially in the mall,
whose ratio of the E-field strength in 2007 to that in 2020 is 20.3 dB. Although the present
measurement conditions are not precisely the same as those in the previous measurements,
it is useful to investigate the time-course of EMFs in various environments. Additionally,
the E-field strengths we obtained in outdoor environments are slightly smaller than those
in another country.
Since our measurements were carried out before the start of 5G commercial service, the
exposure level at the frequency band used in 5G was not included. However, measurements
of exposure levels for 5G and new radio waves used will be continued. Due to the limited
time and space of the measurements in this study, exposure level data under various
conditions of daily life will be accumulated in the future.
Author Contributions: Conceptualization, T.O. and M.T.; Measurement, M.I., K.T. and S.L.; Data
analysis, T.O. and M.I.; writing—original draft preparation, T.O.; supervision, S.W. All authors have
read and agreed to the published version of the manuscript.
Funding: This work was supported by the Ministry of Internal Affairs and Communications
(JPMI10001), Japan.
Institutional Review Board Statement: Not applicable.
Informed Consent Statement: Not applicable.Int. J. Environ. Res. Public Health 2021, 18, 8068 9 of 10
Acknowledgments: The authors would like to thank T. Shiota, K. Gotoh, K. Fujii, and K. Wake at
NICT for their kind help and fruitful discussions.
Conflicts of Interest: The authors declare no conflict of interest.
References
1. Rowley, J.T.; Joyner, K.H. Comparative international analysis of radiofrequency exposure surveys of mobile communication radio
base stations. J. Expo. Sci. Environ. Epidemiol. 2012, 22, 304–315. [CrossRef] [PubMed]
2. Joseph, W.; Verloock, L.; Goeminne, F.; Vermeeren, G. Assessment of RF exposures from emerging wireless communication
technologies in different environments. Health Phys. 2012, 102, 161–172. [CrossRef] [PubMed]
3. Kim, B.C.; Kim, W.-K.; Lee, G.T.; Choi, H.-D.; Kim, N.; Pack, J.-K. Evaluation of Radiofrequency exposure levels from multiple
wireless installations in population dense areas in Korea. Bioelectromagnetics 2014, 35, 603–606. [CrossRef] [PubMed]
4. ANFR (Agence Nationale des Fréquences). Assessment of the Exposure of the General Public to 5G Electromagnetic Waves, Part
2: First Measurement Results on 5G Pilots in the 3400–3800 MHz Band, France. 2020. Available online: https://www.anfr.fr/
fileadmin/mediatheque/documents/5G/20200410-ANFR-rapport-mesures-pilotes-5G-EN.pdf (accessed on 21 July 2021).
5. Gledhill, M. “Exposures to Radiofrequency Fields near 5G Cellsites,” Prepared for Ministry of Health, New Zealand. 2020.
Available online: https://www.health.govt.nz/publication/exposures-radiofrequency-fields-near-5g-cellsites (accessed on
21 July 2021).
6. Ofcom (Office of Communications). Electromagnetic Field (EMF) Measurements near 5G Mobile Phone Base Stations, UK. 2020.
Available online: https://www.ofcom.org.uk/__data/assets/pdf_file/0015/190005/emf-test-summary.pdf (accessed on 21 July
2021).
7. Selmaoui, B.; Mazet, P.; Petit, P.-B.; Kim, K.; Choi, D.; de Seze, R. Exposure of South Korean population to 5G mobile phone
networks (3.4–3.8 GHz). Bioelectromagnetics 2021, 42, 407–414. [CrossRef] [PubMed]
8. ITU-T K.83. Monitoring of Electromagnetic Field Levels. June 2020. Available online: https://www.itu.int/rec/T-REC-K.83-202
006-I/en (accessed on 21 July 2021).
9. Joseph, W.; Verloock, L.; Goeminne, F.; Vermeeren, G.; Martens, L. In situ LTE exposure of the general public: Characterization
and extrapolation. Bioelectromagnetics 2012, 33, 466–475. [CrossRef] [PubMed]
10. Estenberg, J.; Augustsson, T. Extensive frequency selective measurements of radiofrequency fields in outdoor environments
performed with a novel mobile monitoring system. Bioelectromagnetics 2014, 35, 227–230. [CrossRef] [PubMed]
11. Aerts, S.; Joseph, W.; Maslanyj, M.; Addison, D.; Mee, T.; Colussi, L.; Kamer, J.; Bolte, J. Prediction of RF-EMF exposure levels in
large outdoor areas through car-mounted measurements on the enveloping roads. Environ. Int. 2016, 94, 482–488. [CrossRef]
[PubMed]
12. Joseph, W.; Aerts, S.; Vandenbossche, M.; Thielens, A.; Martens, L. Drone based measurement system for radiofrequency exposure
assessment. Bioelectromagnetics 2016, 37, 195–199. [CrossRef] [PubMed]
13. Sagar, S.; Adem, S.M.; Struchen, B.; Loughran, S.P.; Brunjes, M.E.; Arangua, L.; Dalvie, M.A.; Croft, R.J.; Jerrett, M.; Moskowitz,
J.M.; et al. Comparison of radiofrequency electromagnetic field exposure levels in different everyday microenvironments in an
international context. Environ. Int. 2018, 114, 297–306. [CrossRef] [PubMed]
14. Iyare, R.N.; Volskiy, V.; Vandenbosch, G.A.E. Study of the electromagnetic exposure from mobile phones in a city like environment:
The case study of Leuven, Belgium. Environ. Res. 2019, 175, 402–413. [CrossRef] [PubMed]
15. Mazloum, T.; Aerts, S.; Joseph, W.; Wiart, J. RF-EMF exposure induced by mobile phones operating in LTE small cells in two
different urban cities. Ann. Telecommun. 2019, 74, 35–42. [CrossRef]
16. Lee, A.-K.; Jeon, S.-B.; Choi, H.-D. EMF levels in 5G new radio environment in Seoul, Korea. IEEE Access 2021, 9, 19716–19722.
[CrossRef]
17. Aerts, S.; Deschrijver, D.; Joseph, W.; Verloock, L.; Goeminne, F.; Martens, L.; Dhaene, T. Exposure assessment of mobile phone
base station raditation in an outdoor environment using sequential surrogate modeling. Bioelectromagnetics 2013, 34, 300–311.
[CrossRef]
18. Burgi, A.; Scanferla, D.; Lehmann, H. Time averaged transmitter power and exposure to electromagnetic fields from mobile
phone base stations. Int. J. Environ. Res. Public Health 2014, 11, 8025–8037. [CrossRef]
19. Mossetti, S.; de Bartolo, D.; Veronese, I.; Cantone, M.C.; Cosenza, C.; Nava, E. Extrapolation techniques evaluating 24 h of average
electromagnetic field emitted by radio base station installations: Spectrum analyzer measurements of LTE and UMTS signals.
Radiat. Prot. Dosim. 2017, 173, 43–48. [CrossRef] [PubMed]
20. Aerts, S.; Wiart, J.; Martens, L.; Joseph, W. Assessment of long-term spatio-temporal radiofrequency electromagnetic field
exposure. Environ. Res. 2018, 161, 136–143. [CrossRef] [PubMed]
21. Wang, S.; Wiart, J. Sensor-aided EMF exposure assessments in an urban environment using artificial neural networks. Int. J.
Environ. Res. Public Health 2020, 17, 3052. [CrossRef] [PubMed]
22. The Minister of Internal Affairs and Communications in Japan. Report of Electric Field Measurement with Respect to Wireless
Mobile Base Stations under Normal Radio Propagation Environment. January 2007. Available online: https://www.tele.soumu.
go.jp/resource/j/ele/body/report/pdf/18-1.pdf (accessed on 21 July 2021).Int. J. Environ. Res. Public Health 2021, 18, 8068 10 of 10
23. The Minister of Internal Affairs and Communications in Japan. Report of Electric Field Measurement in a Radio Wave Propagation
Environment of a Closed Space. January 2008. Available online: https://www.tele.soumu.go.jp/resource/j/ele/body/report/
pdf/19-1.pdf (accessed on 21 July 2021).
24. Joseph, W.; Verloock, L.; Goeminne, F.; Vermeeren, G.; Martens, L. Assessment of general public exposure to LTE and RF sources
present in an urban environment. Bioelectromagnetics 2010, 31, 576–579. [CrossRef] [PubMed]
25. The Minister of Internal Affairs and Communications in Japan. Radio-Radiation Protection Guidelines. 2018. Available online:
https://www.tele.soumu.go.jp/resource/j/material/dwn/rrpg_e.pdf (accessed on 21 July 2021).
26. Watanabe, S.; Hamada, L. Measurements of the Electromagnetic Field from a Mobile Phone Base Station. J. Natl. Inst. Inf. Commun.
Technol. 2016, 63, 213–231. Available online: http://www.nict.go.jp/publication/shuppan/kihou-journal/journal-vol63no1
/journal-vol63no1-03-04.pdf (accessed on 21 July 2021).
27. Ministry of Posts and Telecommunications. Methods of Calculation and Measurement for the Electromagnetic Field Strength
Transmitted from Radio Equipment, 1999, Japan; Notice 300. Available online: https://www.tele.soumu.go.jp/resource/j/ele/
body/system/300.pdf (accessed on 29 July 2021).
28. IEC 62232 ed.2. Determination of RF Field Strength, Power Density and SAR in the Vicinity of Radiocommunication Base Stations
for the Purpose of Evaluating Human Exposure. 2017. Available online: https://webstore.iec.ch/publication/28673 (accessed on
21 July 2021).
29. Narda Safety Test Solutions GmbH. Principles and Applications of the Selective Radiation Meter SRM-3000, June 2006; Application
note. Available online: https://www.narda-sts.com/en/ (accessed on 21 July 2021).
30. Information and Communication Statistics Database. Available online: https://www.soumu.go.jp/johotsusintokei/field/index.
html (accessed on 21 July 2021).You can also read