Modeled storm surge changes in a warmer world: the Last Interglacial - CP
←
→
Page content transcription
If your browser does not render page correctly, please read the page content below
Clim. Past, 19, 141–157, 2023
https://doi.org/10.5194/cp-19-141-2023
© Author(s) 2023. This work is distributed under
the Creative Commons Attribution 4.0 License.

Modeled storm surge changes in a warmer world:
the Last Interglacial
Paolo Scussolini1 , Job Dullaart1 , Sanne Muis1,2 , Alessio Rovere3,4 , Pepijn Bakker5 , Dim Coumou1 , Hans Renssen6 ,
Philip J. Ward1 , and Jeroen C. J. H. Aerts1,2
1 Institute
          for Environmental Studies, Vrije Universiteit Amsterdam, Amsterdam, the Netherlands
2 Deltares,Delft, the Netherlands
3 Department of Environmental Sciences, Informatics and Statistics, Ca’ Foscari University of Venice, Venice, Italy
4 MARUM, Center for Marine Environmental Sciences, University of Bremen, Bremen, Germany
5 Earth and Climate Cluster, Vrije Universiteit Amsterdam, Amsterdam, the Netherlands
6 Department of Natural Sciences and Environmental Health, University of South-Eastern Norway, Bø, Norway

Correspondence: Paolo Scussolini (paolo.scussolini@vu.nl)

Received: 25 March 2022 – Discussion started: 4 April 2022
Revised: 27 October 2022 – Accepted: 15 November 2022 – Published: 16 January 2023

Abstract. The Last Interglacial (LIG; ca. 125 ka) is a period      1   Introduction
of interest for climate research as it is the most recent period
of the Earth’s history when the boreal climate was warmer
than at present. Previous research, based on models and ge-        Storm surges are temporary changes in sea level driven by
ological evidence, suggests that the LIG may have featured         strong winds and very low atmospheric pressure (Resio and
enhanced patterns of ocean storminess, but this remains hotly      Westerink, 2008). The largest surges are associated with the
debated. Here, we apply state-of-the-art climate and hydro-        most intense storms: cyclones. Of these, the two key types
dynamic modeling to simulate changes in sea level extremes         are tropical cyclones and extratropical cyclones (Henson,
caused by storm surges, under LIG and pre-industrial cli-          1996). In combination with tides and waves, storm surges
mate forcings. Significantly higher seasonal LIG sea level         are the main driver of sea level extremes along the world’s
extremes emerge for coastlines along northern Australia, the       coasts (Enríquez et al., 2020; Muis et al., 2016; Kirezci et
Indonesian archipelago, much of northern and eastern Africa,       al., 2020). The genesis and intensity of storms and cyclones
the Mediterranean Sea, the Gulf of Saint Lawrence, the Ara-        depend on large-scale patterns of atmospheric circulation, on
bian Sea, the east coast of North America, and islands of the      sea surface temperature and on water vapor content of the
Pacific Ocean and of the Caribbean. Lower seasonal LIG sea         lower atmosphere. These processes that drive storm surges
level extremes emerge for coastlines along the North Sea, the      may adjust with ongoing climatic change. Climate reanalysis
Bay of Bengal, China, Vietnam, and parts of Central Amer-          datasets of the last few decades show signs of changes in the
ica. Most of these anomalies are associated with anomalies         atmospheric circulation (Staten et al., 2018) that are poten-
in seasonal sea level pressure minima and in eddy kinetic en-      tially due to global warming (e.g., Francis and Skific, 2015).
ergy calculated from near-surface wind fields, and therefore       These changes have likely driven detectable changes in pat-
seem to originate from anomalies in the meridional position        terns of tropical cyclones over the last few decades (Knutson
and intensity of the predominant wind bands. In a qualitative      et al., 2019), and they are expected to continue in the future
comparison, LIG sea level extremes seem generally higher           as sea surface temperatures (Bindoff et al., 2019) and water
than those projected for future warmer climates. These re-         vapor content (Takahashi et al., 2016) are projected to in-
sults help to constrain the interpretation of coastal archives     crease. As a result, the region of tropical cyclone formation
of LIG sea level indicators.                                       is expected to expand (Harvey et al., 2020), cyclones’ inten-
                                                                   sities could increase (Knutson et al., 2020) and the Atlantic
                                                                   coast of Europe (Haarsma et al., 2013) and North America

Published by Copernicus Publications on behalf of the European Geosciences Union.
142                                P. Scussolini et al.: Modeled storm surge changes in a warmer world: the Last Interglacial

(Garner et al., 2021) may see more frequent landfall of trop-           To date, patterns of LIG storminess have been much less
ical cyclones. Ensembles of climate models project a future          explored than temperature, ice sheet and sea level. Hansen
poleward shift and decrease in the occurrence of boreal extra-       et al. (2016) suggest that the (late) LIG may have been
tropical cyclones in the summer (Chang et al., 2012). This is        characterized by anomalous storminess in the Atlantic and
associated with the phenomenon of tropical expansion (e.g.,          more generally in the subtropics. The notion of higher
Yang et al., 2020) and with enhanced warming in the Arc-             storminess is rooted in geological observations of so-called
tic, which in turn reduces Equator-to-pole temperature gra-          “superstorm” deposits emplaced during the LIG along the
dients and hence the vertical shear and baroclinicity in the         coasts of the Bahamas (Hearty, 1997; Hearty et al., 1998)
mid-latitudes. For the winter, climate models associate future       and Bermuda (Hearty and Tormey, 2017). These are large
global warming with a southern shift of the prevailing tracks        boulders and storm ridges whose size and position suggest
of storms in the boreal mid-latitudes (Harvey et al., 2020).         that they were deposited by storms of higher intensity than
However, projections of both tropical and extratropical cy-          recorded in human history. However, there are still debates
clone occurrence remain contentious (Shaw et al., 2016; Ya-          around the origin of these proxies (Vimpere et al., 2019; Myl-
mada et al., 2017; Catto et al., 2019).                              roie, 2008, 2018) and the type of storm that created them
   To understand the implications of different climate states        (Rovere et al., 2017, 2018; Scheffers and Kelletat, 2020;
on the occurrence of storm surges, we can look at past peri-         Hearty and Tormey, 2018). Models of the LIG suggest a
ods in the Earth’s history. Paleoclimate proxies have the abil-      strengthening of the winter mid-latitude storm tracks, along
ity to depict changes in past patterns of storminess, based          with their northward shift and extension to the east (Kaspar
on a host of proxies that are recovered in the coastal area.         et al., 2007) and, more recently, that the LIG might have seen
For the last few millennia, cyclone activity is reconstructed,       higher-than-today sea surface temperatures and more fre-
for example, from lake sediment in Florida (Rodysill et al.,         quent and stronger tropical cyclones over the western North
2020) and from marine sediment in the tropical Pacific (Bra-         Atlantic (Yan et al., 2021). From proxies, reconstructions of
mante et al., 2020) and tropical Atlantic Ocean (Wallace et          storminess are only indirect and are inferred from variables
al., 2019). However, geological proxies do not have the spa-         linked to storm tracks such as precipitation (Scussolini et al.,
tial and temporal coverage needed to systematically address          2019), river runoff (Scussolini et al., 2020), and seasonal gra-
changes in storminess over large areas and across different          dients in precipitation and temperature (Salonen et al., 2021).
past climates. To fill this gap and to complement knowl-             Possible changes in LIG storm tracks might affect the proba-
edge from proxies, it is possible to use paleoclimate mod-           bilities of storm surges at the coastline, but this effect has not
eling (Raible et al., 2021). For example, by modeling a set          been quantified.
of starkly different past climatic conditions, Koh and Brier-
ley (2015) reveal that the potential for generation of tropical      1.2   Application of modeling to LIG storm surges
cyclones only changes regionally.
                                                                     Compared to previous generations, the present generation
1.1   The Last Interglacial
                                                                     of global climate models (GCMs) is much more capable of
                                                                     simulating present-day boreal storm tracks and jet streams
One period of particular interest for paleoclimate science is        (Roberts et al., 2020; Dullaart et al., 2020; Belmonte Ri-
the Last Interglacial (LIG), spanning from 129 to 116 ka.            vas and Stoffelen, 2019), with a reduction of almost 50%
This was the last period of the Earth’s past when large              in root-mean-square error (Harvey et al., 2020). However,
parts of the globe were characterized by a climate slightly          GCMs still have a positive bias in the intensity and a southern
warmer than at present, at least in the Northern Hemisphere          bias in the position of the zonal winds associated with sum-
(CAPE_Members, 2006; Hoffman et al., 2017; McKay et                  mer storm tracks (Roberts et al., 2020). Further, the inten-
al., 2011; Shackleton et al., 2020; Turney et al., 2020a;            sity of the strongest tropical cyclones seems to still be under-
Turney and Jones, 2010). On average, LIG polar tem-                  estimated (Roberts et al., 2020). GCMs indicate significant
peratures were several degrees higher than pre-industrially          changes in storm tracks under different climate change sce-
(Neem_Community_Members, 2013; Jouzel et al., 2007),                 narios (Harvey et al., 2020; Haarsma et al., 2013), possibly
ice sheets were smaller (Turney et al., 2020b; Rohling et            resulting in a poleward shift in areas of cyclone activity (Mori
al., 2019) and sea levels were higher than today (Dutton et          et al., 2019) and implying that future changes in storminess
al., 2015a, b; Dyer et al., 2021; Kopp et al., 2009; Rubio-          may contribute to higher coastal sea level extremes (Vous-
Sandoval et al., 2021). Although key differences in the forc-        doukas et al., 2018).
ing of LIG and future climates prevent the use of the LIG               In this paper, we explore the influence of the LIG atmo-
as a direct analog for the future (Lunt et al., 2013; Otto-          spheric climate on global patterns of storm surges. We ex-
Bliesner et al., 2013), its similarity with projected future ther-   amine changes in storm surge levels between climates of the
mal changes in some regions (especially the Northern Hemi-           LIG and the pre-industrial (PI) era and link them to changes
sphere) makes it a relevant process analog for warmer cli-           in mean and extremes of atmospheric circulation. To achieve
mate conditions.                                                     this, we employ meridional and zonal wind speed and sea

Clim. Past, 19, 141–157, 2023                                                             https://doi.org/10.5194/cp-19-141-2023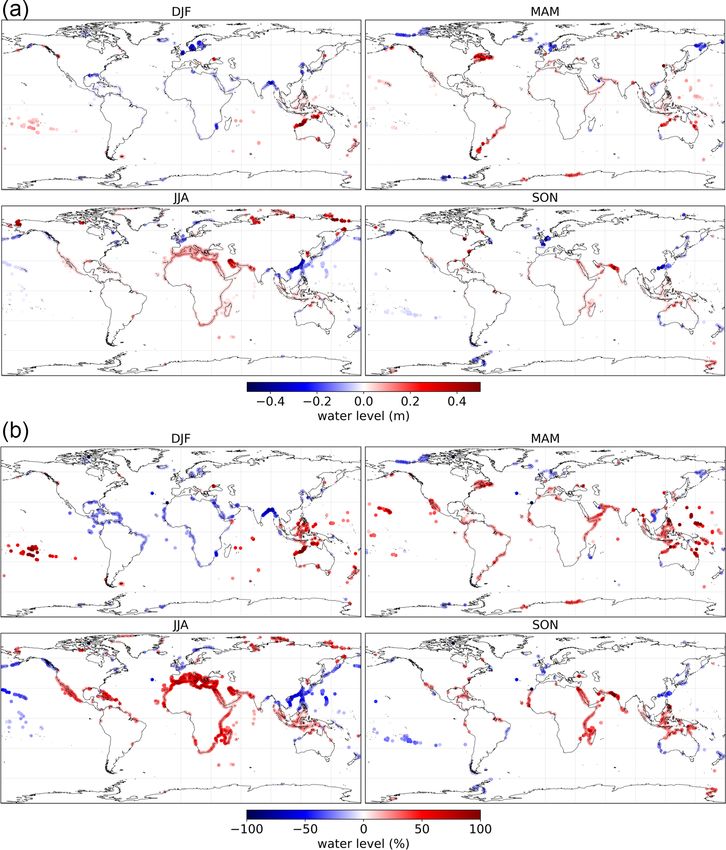
P. Scussolini et al.: Modeled storm surge changes in a warmer world: the Last Interglacial                                  143

level pressure from simulations of LIG and PI climates with a      model uses the Delft3D Flexible Mesh software (Kernkamp
global climate model and force a global hydrodynamic model         et al., 2011) and has a spatially varying resolution that
of the ocean to simulate the extreme sea levels along coast-       ranges from 50 km in the deep ocean to 2.5 km along the
lines resulting from storm surges.                                 coast. The Charnock (1955) relation with a drag coefficient
                                                                   of 0.0041 is used to estimate the wind stress at the ocean
                                                                   surface. A combination of different datasets is used for the
2     Methods
                                                                   bathymetry: EMODnet at 250 m resolution around Europe
2.1    Climate simulations
                                                                   (Consortium_Emodnet_Bathymetry, 2018) and the General
                                                                   Bathymetric Chart of the Ocean with 30 arcsec resolution
The LIG and PI climates are simulated with the state-of-the-       for the rest of the globe (GEBCO, 2014). The bathymetry
art coupled climate model CESM, version 1.2 (Hurrell et            under the permanent ice shelves in Antarctica is represented
al., 2013). The model includes the Community Atmosphere            by Bedmap2 (Fretwell et al., 2013). GTSMv3.0 forced with
Model (CAM5), the Community Land Model (CLM4.0),                   the ERA5 climate reanalysis (Hersbach et al., 2020) shows
the Parallel Ocean Program (POP2.1) and the Commu-                 an excellent overall performance when validated against
nity Ice Code (CICE4). We use a horizontal resolution of           a global dataset of tide gauge stations (Muis et al., 2020;
0.93◦ × 1.25◦ in the atmosphere (30 vertical levels and a          Dullaart et al., 2020). The annual maxima of coastal sea
finite volume core) and land and a nominal 1◦ resolution           level correlate with observations of an average value for
in the ocean (60 vertical levels) and sea-ice models with          Pearson’s r of 0.54 (standard deviation SD = 0.28), with
a grid reflecting a displaced North Pole. The LIG sim-             average bias −0.04 m (SD = 0.32 m) and average relative
ulation represents conditions at 127 ka, the timing of the         error of 14.0 % (SD = 13.4 %). As the relatively high SDs
maximum positive anomaly in Northern Hemisphere inso-              indicate, the model performance varies spatially. It performs
lation. It is forced with changes in atmospheric greenhouse        best in regions with large variability in sea level, that is,
gas values (275 ppm CO2 , 685 ppb CH4 and 255 ppb N2 O)            in regions with a wide and shallow continental shelf that
and in the orbital parameters (eccentricity = 0.039378, obliq-     have high storm surges, and it performs more poorly in
uity = 24.040◦ and perihelion − 180 = 275.41), following           regions near the Equator, where storm surges are low. Model
Otto-Bliesner et al. (2017). The PI simulation includes green-     performance is higher for 10 min series than for annual
house and orbital forcing of CE 1850. All other boundary           maxima, with correlation coefficients above 0.9 and RMSE
conditions, such as the land–sea mask, continental ice sheets      smaller than 0.1 (Muis et al., 2022). For further details,
and vegetation are the same in the PI and LIG simulations.         see Muis et al. (2020) and Wang et al. (2021). We execute
The LIG simulation of CESM1.2 has been compared to the             GTSM including only storm surge processes, and we ex-
available proxies for precipitation in Scussolini et al. (2019),   clude astronomical tidal forcing. Time series of surge levels
showing that it reproduces the sign of anomalies in LIG pre-       are stored at a 10 min temporal resolution for 23 815 output
cipitation better than most of the eight models examined in        locations. This set of locations was developed by Muis et
that study. From the LIG simulation of a similar version of        al. (2020) and includes output every 25–50 km along the
the same model, CESM2, surface air temperature was com-            global coast. The spatial resolution of the climate forcing is
pared to the available proxies in Otto-Bliesner et al. (2021),     too coarse to accurately represent the intensity of tropical
showing performance in line with the other models in the en-       cyclones (Roberts et al., 2020). Hence, sea level extremes
semble examined therein. Both the LIG and PI experiments           calculated for regions prone to tropical cyclones may be
are equilibrium simulations. For the PI experiments, data          underestimated. We discuss this limitation in Sect. 4.2.
are saved from simulations of a long period (> 2000 years)
with stationary PI forcing. For the LIG experiments, data          2.3   Analysis
are saved after an additional period of stationary LIG forc-
ing (> 300). These periods are considered more than suf-           In the analysis of the modeling results, we consider seasons
ficient to obtain a climate in near equilibrium at the atmo-       separately except when otherwise noted: December–
sphere and the upper ocean, which is relevant for this study.      January–February (DJF), March–April–May (MAM),
We save 6-hourly values of sea level pressure and of zonal         June–July–August        (JJA)    and     September–October–
and meridional wind speed at 10 m elevation, i.e., u10 and         November (SON). To adequately compare seasonal results
v10. These values constitute input in the next modeling step.      between the LIG and PI periods, we account for the effect
                                                                   of changes in the Earth’s orbit across geological time upon
2.2    Hydrodynamic simulations
                                                                   the definition of seasons, and we apply the angular (i.e.,
                                                                   celestial) definition of calendar (Bartlein and Shafer, 2019).
We use the atmospheric outputs from the climate                    For variables from the climate model simulations – sea
model to force the Global Tide and Surge Model ver-                level pressure, meridional and zonal wind speed, absolute
sion 3.0 (GTSMv3.0). GTSM is a depth-averaged hydro-               wind speed – we calculate the climatological average and
dynamic model of the ocean with global coverage. The               the seasonal maxima and minima of values sustained for 1,

https://doi.org/10.5194/cp-19-141-2023                                                          Clim. Past, 19, 141–157, 2023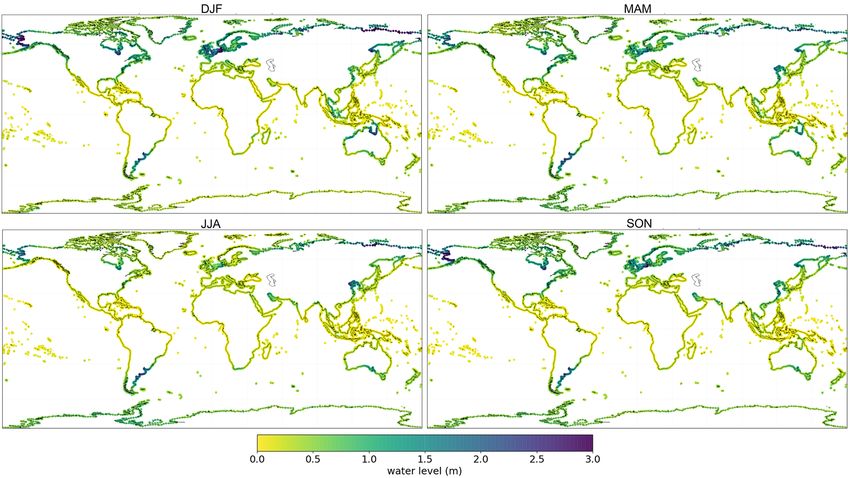
144                             P. Scussolini et al.: Modeled storm surge changes in a warmer world: the Last Interglacial

2, 3 and 5 d. To obtain a proxy for surface storminess, we         Atmospheric storminess, as portrayed by EKE, is strongest
calculate eddy kinetic energy (EKE). EKE is commonly            over the Southern Ocean and oceanic sectors to its north,
calculated in ocean and atmosphere sciences to quantify         over the northern Pacific and Atlantic oceans, and over the
the eddy-like behavior of fluids (O’Gorman and Schneider,       Arctic Ocean, with substantial seasonal differences. While
2008). Here, to obtain a proxy for the low-atmosphere           these broad patterns apply both to the LIG (Fig. 2a) and to
storminess that can generate ocean surges, we calculate EKE     the PI simulations (not shown), strong seasonal anomalies
from the zonal (u) and meridional (v) wind speeds at 10 m,      in EKE emerge over oceanic sectors adjacent to coastal ar-
and we filter out frequencies outside of the 2.5–6 d interval   eas, where anomalies have potential implications for extreme
with a Butterworth passband filter, as in, e.g., Pfleiderer     sea levels, as will be shown in Sect. 3.3. These are mainly
et al. (2019). From the value of sea levels resulting from      the extratropical North Atlantic Ocean, the northwestern and
storm surges along the global coastline, we subtracted values   northeastern Pacific Ocean, the southern Indian Ocean, and
of the local sea level averaged across the whole PI and         the southeastern Atlantic Ocean.
LIG simulations, as these are slightly different between
simulations (Fig. S1 in the Supplement). We then calculate      3.2   Sea level extremes
extreme values of sea levels for several return periods (from
2 to 20 years) based on seasonal maxima of daily maxima.        In the following, we present and discuss sea level extremes
The calculation of extreme values of sea levels for different   due to storm surges, modeled with GTSM, at the return pe-
return periods is based on the Weibull formula for plotting     riod of 10 years. This return period is deemed representative
positions (e.g., Makkonen, 2006):                               of extremes at return periods between 2 and 20 years (shown
                                                                in Figs. S4–S6). In both simulations of the LIG (Fig. 3) and
RP = (n + 1)/m,                                           (1)   of the PI era (not shown), the highest values of extreme sea
                                                                levels are reached at the coasts of northern Europe, north-
where RP is the return period (in years) of the event with      ern North America, northern Asia, the Gulf of Carpentaria
rank m in an ordered time series of annual/seasonal max-        in northern Australia (especially during DJF and MAM) and
ima of length n. We do not fit extreme value distributions to   Patagonia and, secondarily, at the coasts of southern Aus-
the maxima and extrapolate values along fitted curves. This     tralia (especially during MAM and JJA) and the northern
approach is adequate since we only consider anomalies in        Persian Gulf (especially during JJA and SON). The high val-
return periods from 2 to 20 years, a period which is encom-     ues in these regions are linked to the presence of a wide and
passed by the length of our time series.                        shallow continental shelf combined with the season of higher
   To estimate the uncertainty around the estimated values      storminess.
for the various return periods of sea level extremes, we use       Figure 4 maps the significant anomalies in sea level ex-
bootstrapping with 599 repetitions to obtain the 5 % and 95 %   tremes, expressed both in absolute values and as percentages.
confidence bounds (Wilcox, 2010).                               Anomalies are significant at the 95th confidence level in
                                                                8.5 % of locations for DJF, in 9.6 % for MAM, in 29.5 % for
                                                                JJA and in 8.4 % for SON. Annual anomalies are significant
3     Results
                                                                in 9.9 % of locations (Fig. 5). Considerably higher LIG surge
3.1    Atmospheric variables                                    levels, i.e., positive anomalies, emerge along northern Aus-
                                                                tralia and parts of the Indonesian archipelago, with anoma-
The most notable anomalies in sea level pressure between the    lies around +0.6 m during DJF; the Mediterranean Sea and
LIG and the PI climate simulations occur during JJA (Fig. 1).   northern Africa, with anomalies up to +0.2 m during JJA,
Both seasonal mean and seasonal minimum LIG values are          representing about +100 % increase from PI values; around
then much lower over northern Africa, Europe, and central       the area of the Gulf of Saint Lawrence in northeast Amer-
and northern Asia and secondarily over northern America,        ica with MAM anomalies that reach +0.4 m, correspond-
and they are much higher over the northernmost sector of        ing to about +50 %; at the Persian Gulf, with JJA anoma-
the Pacific Ocean. Across all seasons, seasonal LIG minima      lies up to +0.5 m, corresponding to +80 %; and at the coast
of sea level pressure deviate from the PI more strongly than    of Pakistan and northwest India, with SON anomalies up to
seasonal means of sea level pressure.                           +0.4 m, corresponding to more than +100 %. Considerable
   In the LIG climate simulation, the boundary between west-    negative anomalies are found at the Baltic and North seas,
erly and easterly winds of the boreal mid-latitudes slightly    with anomalies around −0.3 m, with the most profound de-
shifts poleward during JJA (Fig. S2). Conversely, it shifts     crease during DJF; at the Bay of Bengal, with DJF anoma-
equatorward during DJF. Further, LIG equatorial easterlies      lies reaching −0.4 m, corresponding to −80 %; at the coast
during JJA are weaker over the Atlantic and stronger over       of China and Vietnam, with JJA anomalies reaching −0.5 m,
the western Pacific Ocean sectors. Meridional wind patterns     corresponding to around −60 %; and over parts of Central
show that LIG Atlantic circulation is on average more zonal     America during DJF. Across a large number of the islands of
during JJA and slightly less zonal during DJF (Fig. S3).        the Pacific Ocean and of the Caribbean, significant anomalies

Clim. Past, 19, 141–157, 2023                                                      https://doi.org/10.5194/cp-19-141-2023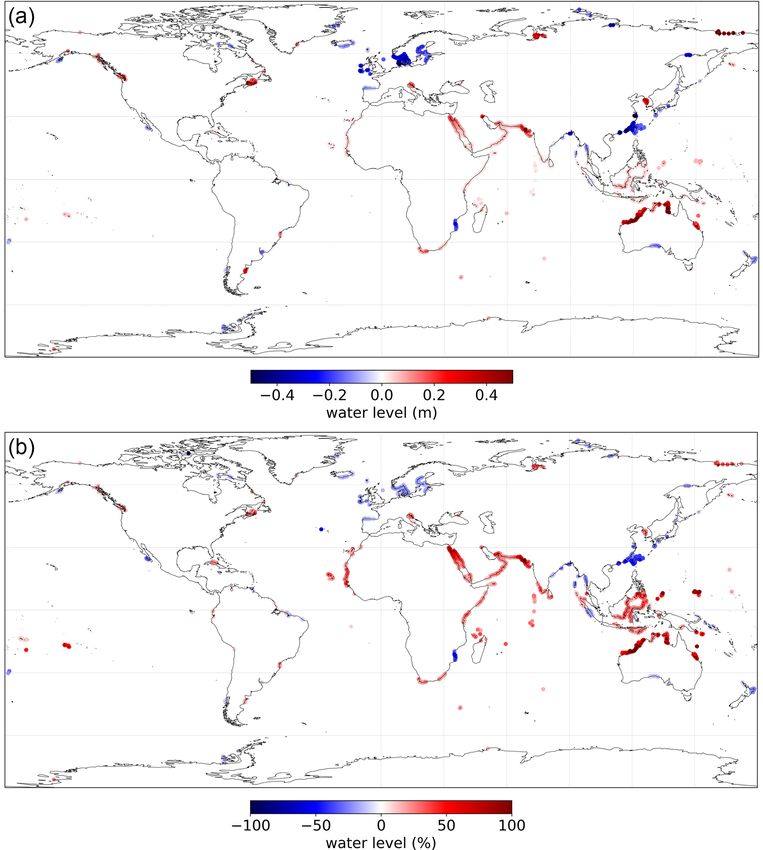
P. Scussolini et al.: Modeled storm surge changes in a warmer world: the Last Interglacial                                    145

Figure 1. Anomalies (LIG − PI) in sea level pressure. (a) Seasonal mean; (b) seasonal daily minimum. DJF indicates months December–
January–February and so on.

https://doi.org/10.5194/cp-19-141-2023                                                           Clim. Past, 19, 141–157, 2023
146                               P. Scussolini et al.: Modeled storm surge changes in a warmer world: the Last Interglacial

Figure 2. (a) Eddy kinetic energy (EKE), calculated from zonal and meridional wind speeds (see Sect. 2), in the LIG simulation. (b) EKE
anomalies (LIG − PI).

Clim. Past, 19, 141–157, 2023                                                             https://doi.org/10.5194/cp-19-141-2023
P. Scussolini et al.: Modeled storm surge changes in a warmer world: the Last Interglacial 147
Figure 3. Sea level extremes from storm surges in the LIG simulation at the 10-year return period.
are modest in absolute values; however, they reach percent- ranean; and over parts of the tropical western Pacific Ocean
age values of +100 % over the Pacific during DJF and MAM and northern Australia. Conversely, lower LIG EKE coin-
and +60 % over the Caribbean during JJA. cides with lower LIG sea level extremes (blue) mostly over
limited areas of the northern high latitudes. Higher LIG sea
3.3 Correspondence between anomalies in atmospheric level extremes coincide with lower LIG EKE (orange) over
variables and sea level extremes areas of eastern Africa, the south of the Arabian Peninsula
and the Indonesian archipelago. During JJA, higher LIG EKE
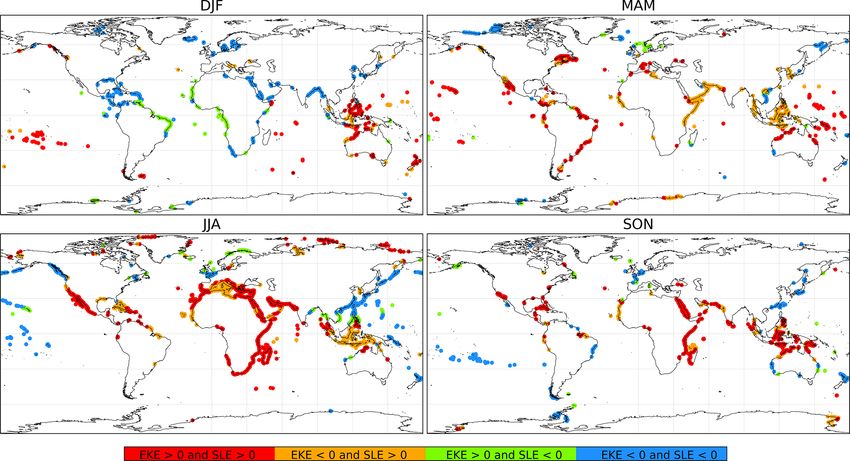
Our results reveal large-scale coherence between anomalies coincides with higher LIG sea level extremes (red) over the
of atmospheric storminess (Fig. 2b) and of sea level extremes majority of the global coasts around eastern Africa, southern
at the coast (Fig. 4). This is shown in the sign comparison Africa, northern Africa, Mozambique, much of the Mediter-
in Fig. 5, where the anomaly in EKE is interpolated to the ranean, the Arabian Peninsula and the Persian Gulf; over
coastal locations where the anomaly in sea level extremes is the northeastern sector of the Pacific Ocean and parts of the
significant. Typically, higher LIG EKE values coincide with Caribbean Sea and over some areas of South Asia and of the
higher LIG sea level extremes in adjacent coastlines (color Arctic Ocean. Conversely, lower LIG EKE coincides with
red in Fig. 5) and conversely (color blue in Fig. 5). During lower LIG sea level extremes (blue) over the northeastern
DJF, lower LIG EKE coincides with lower LIG sea level ex- and western sectors of the northern Pacific Ocean. Higher
tremes (blue) over Iceland, the North Sea and the Baltic Sea; LIG sea level extremes coincide with lower LIG EKE (or-
over the Gulf of Mexico and the Caribbean Sea; around the ange) over the central Mediterranean Sea and over much of
Arabian Peninsula; over some coastline of southern Africa the Indonesian archipelago. During SON, higher LIG EKE
and over the Bay of Bengal. Conversely, higher LIG EKE coincides with higher LIG sea level extremes (red) in the In-
coincides with higher LIG sea level extremes (red) over the dian Ocean sector along eastern Africa and Mozambique, in
area of the Indonesian archipelago and northern Australia. the Red Sea and the Persian Gulf, and over much of the In-
Higher LIG EKE coincides with lower LIG sea level ex- donesian archipelago and of the Caribbean Sea. Conversely,
tremes (green) over long stretches of coast at either side of lower LIG EKE values coincide with lower LIG sea level ex-
the tropical Atlantic Ocean. During MAM, higher LIG EKE tremes (blue) over parts of the East and South China seas,
coincides with higher LIG sea level extremes (red) over the parts of northwestern Europe, parts of the eastern coast of
western North Atlantic, around the Baja California Peninsula South America, and parts of New Zealand and Australia.
and the western South Atlantic; over parts of the Mediter-
https://doi.org/10.5194/cp-19-141-2023 Clim. Past, 19, 141–157, 2023148 P. Scussolini et al.: Modeled storm surge changes in a warmer world: the Last Interglacial Figure 4. Anomalies (LIG minus PI) in sea level extremes at the 10-year return period, as (a) absolute and (b) percentage values. Only values for which the 95 % uncertainty bands of the distributions of each climate do not overlap are shown. Clim. Past, 19, 141–157, 2023 https://doi.org/10.5194/cp-19-141-2023
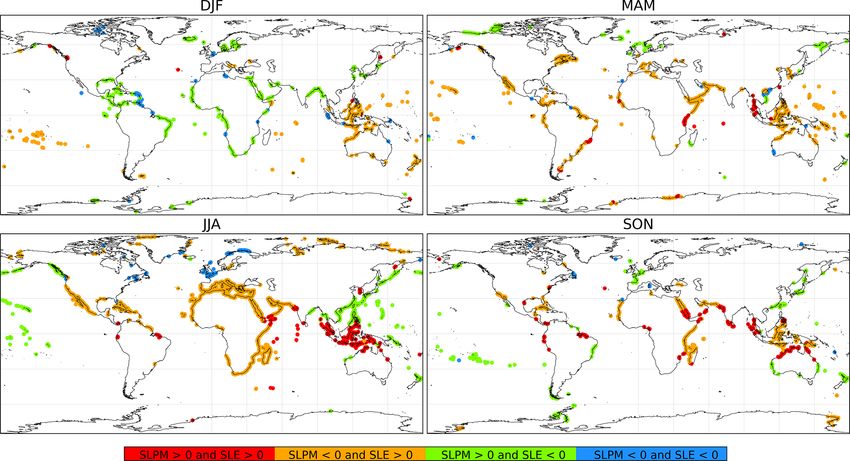
P. Scussolini et al.: Modeled storm surge changes in a warmer world: the Last Interglacial                                        149

Figure 5. Agreement and disagreement in the sign of anomalies (LIG minus PI) in eddy kinetic energy (EKE) and sea level extremes (SLE).
Colors indicate where anomalies in both EKE and SLE are positive (red), where EKE anomalies are negative and SLE anomalies are positive
(orange), where EKE anomalies are positive and SLE anomalies are negative (green), and where anomalies in both EKE and SLE are negative
(blue).

   A comparison between anomalies of sea level pressure               4   Discussion
minima (Fig. 1b) and of sea level extremes (Fig. 4) is shown
in Fig. 6, where sea level pressure minima are interpolated           In some regions, sea level extremes from storm surges in the
to the coastal locations where the anomaly in sea level ex-           LIG and PI climates generally differ from those modeled for
tremes is significant. Across seasons, lower LIG values of            the recent decades by Muis et al. (2016); based on climate
sea level pressure minima mostly correspond with higher               reanalysis (Fig. S7) they are higher than in recent decades in
LIG sea level extremes (color orange in Fig. 6). This holds           Patagonia and in the Gulf of Carpentaria, and they are lower
true, during JJA, over the Mediterranean, northern Africa,            than in recent decades at some coasts of South Asia. Anoma-
the Arabian Peninsula, the eastern coast of North America,            lies between LIG and PI are larger than between the pro-
the Caribbean Islands, the Persian Gulf, Mozambique and               jected warmer climate of the late 21st century and the recent
Madagascar; during MAM over the area of the Gulf of Saint             decades, as modeled by Muis et al. (2020) and Vousdoukas
Lawrence; and, during DJF, over northern Australia and In-            et al. (2018). In a comparison between our results and those
donesia. Conversely, lower LIG sea level extremes mostly              studies, both the climate periods and the climate models em-
coincide with areas where LIG sea level pressure minima               ployed differ, such that it is not possible to separate the ef-
are higher (color green). There are clear, localized deviations       fect of differences in climate forcing and of different mod-
from this anti-correlation (colors red and blue) during JJA           els. Whereas spatial patterns of warming during JJA in the
over northern Europe, during SON at the coast of Pakistan             Northern Hemisphere are similar across simulations of the
and northwest India, and during JJA over parts of the eastern         LIG (see sea surface temperatures in Fig. S8) and of warmer
Indian Ocean and Indonesia.                                           futures, any comparison between the LIG and possible fu-
   Clear links do not emerge between anomalies of zonal or            tures has to take into account fundamental differences in the
meridional wind speeds and of sea level extremes. As an ex-           forcing of the two climates (Otto-Bliesner et al., 2021). The
ception, during JJA, the latitudinal position of maximum in-          LIG deviates from the PI era due to higher boreal summer in-
tensity of the LIG easterlies over the Caribbean Sea shifts           solation, and the future deviates from the PI and the modern
northwards, coinciding with higher LIG sea level extremes.            climate due to higher greenhouse gas concentration.

https://doi.org/10.5194/cp-19-141-2023                                                              Clim. Past, 19, 141–157, 2023
150                               P. Scussolini et al.: Modeled storm surge changes in a warmer world: the Last Interglacial

Figure 6. Same as Fig. 5 but regarding agreement and disagreement in the sign of anomalies (LIG minus PI) in sea level pressure min-
ima (SLPM) and sea level extremes (SLE).

4.1   Implication for paleo sea level proxies                       applicable to beach deposits and beach ridges. For proxies
                                                                    correlated to LIG extreme storm deposits, like those reported
Our results also have implications for the interpretation of        in Bermuda and the Bahamas (Hearty, 1997; Hearty et al.,
certain geological facies that are used to reconstruct LIG rel-     1998; Hearty and Tormey, 2017), our results may help dis-
ative sea level, i.e., the local absolute elevation of the past     entangle in which areas it may be of interest to combine our
sea level, still uncorrected for post-depositional effects such     storm surge models with wave modeling to unravel whether
as due to glacial isostatic adjustment and tectonics. Recon-        higher surges may have also been coupled with higher waves.
structions of paleo relative sea level from field data often use
the uniformitarianism approach, i.e., the assumption that pro-
                                                                    4.2   Limitations and future research
cesses acted essentially with the same intensity in the past as
they do in the present (Lyell, 1830). In the practice of sea        It is known that the modeling of extreme sea levels based
level reconstruction, this concept often entails using modern       on global climate models is prone to large spatial biases, as
analogs to calculate the relationship between the measured          was shown in a comparison with observations and climate
elevation of a paleo relative sea level proxy and the paleo sea     reanalysis by Muis et al. (2020). While regional studies have
level. Different levels attained by storm surges in the LIG         attempted to correct for such biases (Marsooli et al., 2019),
might affect the interpretation of wave-built relative sea level    global studies that project future changes in storm surges
proxies, such as beach deposits or beach ridges. Beach ridges       have not (Muis et al., 2020; Vousdoukas et al., 2018). In
are widespread along the Atlantic coasts of South America           principle, bias correction could be attempted for meteoro-
(Patagonia) and the Gulf Coast of the USA (Gowan et al.,            logical results of the pre-industrial era simulation, based on
2021; Simms, 2021). In our models, both areas show varia-           reanalysis extending back to the 19th century (e.g., CIRES
tions on the order of up to a few tens of centimeters in the        20th-century reanalysis; Compo et al., 2011). However, the
LIG annual sea level extremes, which do not reach statistical       bias may likely differ across different climates, as shown in
significance (Fig. 7). LIG beach deposits are instead widely        a comparison between bias in the present and in the PI cli-
distributed globally, and our results contain annual anoma-         mate by Scussolini et al. (2020), and it is not possible to as-
lies that reach multiple tens of centimeters at several other       sess the bias for the LIG results due to the lack of adequate
locations, e.g., in the western Mediterranean (Cerrone et al.,      datasets. Therefore a bias correction of the PI results could
2021). We surmise that it may be possible that, at these lo-        not be applied to the LIG results. This leaves us with uncor-
cations, the uniformitarianism principle may not be directly        rected results: if the difference in bias between the LIG and

Clim. Past, 19, 141–157, 2023                                                           https://doi.org/10.5194/cp-19-141-2023
P. Scussolini et al.: Modeled storm surge changes in a warmer world: the Last Interglacial 151 Figure 7. Same as Fig. 4 but for annual instead of seasonal anomalies in sea level extremes. PI simulation is small, the anomalies that we present here improve spatial gradients in pressure and wind speeds and will mostly represent differences in climate forcing; if on the much increase the representation of tropical storms. Second, other hand the difference in bias is large, the anomalies will the length of the GCM simulations (20 years) is relatively incorporate the differences both in forcing and in bias. Fur- short for assessing changes in the probabilities of extremes, ther, there are considerable uncertainties associated with the especially on account of the large internal variability. In- meteorological forcing that we use here, and there are several creasing the length of the simulations would make the detec- research directions that could be explored in future research. tion of changes in extreme value statistics more robust. Third, First, the resolution of the CESM1.2 model, although high future research should attempt to address model bias and un- in the context of state-of-the-art GCMs, is not fully storm- certainty by performing hydrodynamic simulations based on resolving, which hampers especially the representation of an ensemble of climate models, such as the ensemble of LIG the intensity of tropical cyclones. To address this and to im- experiments analyzed in Otto-Bliesner et al. (2021). Higher prove spatial gradients in pressure and wind speeds, it would confidence could be placed on anomalies in LIG storm surges be necessary to use large synthetic datasets of tropical cy- that emerge as robust across the ensemble. clones in combination with high-resolution parametric wind An important assumption that underlies our analysis is models, as included in the approaches of, e.g., Dullaart et that we only consider climatic changes and do not account al. (2021) and Xi and Lin (2022). While this is beyond the for changes in mean sea level that originate from differ- scope of our current study, it could be explored in future ent extents of polar ice sheets and from steric processes. work, although the lack of observations makes it challenging The generation of a storm surge is influenced by changes to constrain the statistical model. Higher resolution would in bathymetry; coastal geometry; and geomorphic features https://doi.org/10.5194/cp-19-141-2023 Clim. Past, 19, 141–157, 2023
152                               P. Scussolini et al.: Modeled storm surge changes in a warmer world: the Last Interglacial

such as river deltas, barrier islands and bays, which all in-      Code availability. The climate model CESM can be openly
teract and can modulate the height of the storm surge (Is-         downloaded at https://www.cesm.ucar.edu/models/cesm2 (NCAR,
lam et al., 2021). Moreover, storm surges are influenced by        2023). The Delft3D-FM software that was used for the storm surge
variations in water depth as well as the sea–air momentum          modeling is openly available for download at https://download.
exchange, and as such they can be modulated by non-linear          deltares.nl/en/download/delft3d-fm/ (Deltares, 2023).
interaction effects with tides and waves (Idier et al., 2019).
This has been shown in regional studies that use fully cou-
                                                                   Data availability. The     datasets that result from cli-
pled hydrodynamic models, such as Arns et al. (2017). At
                                                                   mate simulations with model CESM, and on which
the global scale, interaction effects are typically excluded and
                                                                   this study is based, are openly available at DOIs:
considered to be negligible compared to the other sources of       https://doi.org/10.5281/zenodo.7457075 (Scussolini et al.,
uncertainty (Vousdoukas et al., 2018; Dullaart et al., 2020),      2022a) and https://doi.org/10.5281/zenodo.7458360 (Scussolini et
although Arns et al. (2020) have used statistical modeling         al., 2022b).
to show that interaction effects can modulate global extreme
sea levels. Further, all processes that regulate storm surges
act on various scales in space and in time (Arns et al., 2020).    Supplement. The supplement related to this article is available
Both changes in the large-scale atmospheric circulation and        online at: https://doi.org/10.5194/cp-19-141-2023-supplement.
changes in the frequency, intensity and position of tracks
of tropical and extratropical cyclones can drive changes in
multi-year return levels, such as we present here. Both are        Author contributions. PS, SM, AR, PJW and JCJHA designed
also known to be influenced by climate variability from an-        the study. PB carried out the climate model simulations. JD and
nual to decadal timescales. The starkly different climate of       SM carried out the hydrodynamic simulations. PS and JD processed
the LIG warrants exploration of this set of interactions, which    and analyzed the datasets. PS prepared the figures. PS, SM and
                                                                   AR led the writing of the paper. All authors contributed to the inter-
could be accomplished by (1) including LIG mean sea level
                                                                   pretation of results and the writing of the paper.
anomalies such as those resulting from a glacial isostatic ad-
justment (GIA) modeling approach and from inclusion of
steric effects and changes in ocean circulation; (2) running
                                                                   Competing interests. At least one of the (co-)authors is a mem-
GTSM simulations, with the inclusion of such mean sea              ber of the editorial board of Climate of the Past. The peer-review
level anomalies with activation of the tidal component of the      process was guided by an independent editor, and the authors also
model; (3) including wave modeling, globally or for specific       have no other competing interests to declare.
regions of interest; and (4) simulating longer periods, so as
to address the relative influence of various modes of climate
variability, from the annual to the multidecadal scale. This       Disclaimer. Publisher’s note: Copernicus Publications remains
is computationally expensive, but it seems like the near-ideal     neutral with regard to jurisdictional claims in published maps and
approach to investigate drivers behind observed changes at         institutional affiliations.
key paleo sea level indicator sites.

                                                                   Acknowledgements. We are grateful to three anonymous re-
                                                                   viewers, whose comments helped improve an earlier version of this
5   Conclusions                                                    article.

We report the first results of simulations of storm surge un-
                                                                   Financial support. We acknowledge funding from SCOR un-
der climatic conditions representing the Last Interglacial and
                                                                   der project COASTRISK; from NWO (Nederlandse Organ-
the pre-industrial periods. These reveal that a naturally (or-
                                                                   isatie voor Wetenschappelijk Onderzoek) under grant AL-
bitally) forced warmer climate implies significant seasonal        WOP.164 (Paolo Scussolini), under grant ASDI.2018.036 (MO-
and annual anomalies in sea level extremes along the coast-        SAIC project; Sanne Muis) and under NWO-VICI grant 453-13-
line of many global areas. A large part of those anomalies can     006 (Jeroen C. J. H. Aerts); from the European Research Coun-
be linked to changes in patterns of atmospheric storminess         cil (ERC), under the European Union’s Horizon 2020 Programme
and of sea level pressure minima in our climate simulations.       for Research and Innovation grant 802414 (Alessio Rovere) and un-
For some locations, anomalies of sea level extremes reach          der advanced grant 884442 (Jeroen C. J. H. Aerts).
multiple tens of centimeters and reach proportional change
on the order of 100 %. These insights can inform the inter-
pretation of existing and upcoming future paleo sea level in-      Review statement. This paper was edited by Ran Feng and re-
dicators. Lastly, we suggest research avenues to improve the       viewed by three anonymous referees.
realism of modeled sea level extremes for the LIG by includ-
ing other relevant processes in the modeling framework.

Clim. Past, 19, 141–157, 2023                                                            https://doi.org/10.5194/cp-19-141-2023
P. Scussolini et al.: Modeled storm surge changes in a warmer world: the Last Interglacial 153
References [data set], https://doi.org/10.12770/18ff0d48-b203-4a65-94a9-
5fd8b0ec35f6, 2018.
Deltares: Delft3D FM Suite, Delft3D [code], https://download.
deltares.nl/en/download/delft3d-fm/, last access: 10-01-2023.
Arns, A., Dangendorf, S., Jensen, J., Talke, S., Bender, J., Dullaart, J. C. M., Muis, S., Bloemendaal, N., and Aerts, J.
and Pattiaratchi, C.: Sea-level rise induced amplification of C. J. H.: Advancing global storm surge modelling using the
coastal protection design heights, Scient. Rep., 7, 40171, new ERA5 climate reanalysis, Clim. Dynam., 54, 1007–1021,
https://doi.org/10.1038/srep40171, 2017. https://doi.org/10.1007/s00382-019-05044-0, 2020.
Arns, A., Wahl, T., Wolff, C., Vafeidis, A. T., Haigh, I. Dullaart, J. C. M., Muis, S., Bloemendaal, N., Chertova, M. V.,
D., Woodworth, P., Niehüser, S., and Jensen, J.: Non- Couasnon, A., and Aerts, J. C. J. H.: Accounting for tropical cy-
linear interaction modulates global extreme sea levels, coastal clones more than doubles the global population exposed to low-
flood exposure, and impacts, Nat. Commun., 11, 1918, probability coastal flooding, Commun. Earth Environ., 2, 135,
https://doi.org/10.1038/s41467-020-15752-5, 2020. https://doi.org/10.1038/s43247-021-00204-9, 2021.
Bartlein, P. J. and Shafer, S. L.: Paleo calendar-effect adjustments Dutton, A., Webster, J. M., Zwartz, D., Lambeck, K., and Wohl-
in time-slice and transient climate-model simulations (PaleoCal- farth, B.: Tropical tales of polar ice: evidence of Last Inter-
Adjust v1.0): impact and strategies for data analysis, Geosci. glacial polar ice sheet retreat recorded by fossil reefs of the
Model Dev., 12, 3889–3913, https://doi.org/10.5194/gmd-12- granitic Seychelles islands, Quaternary Sci. Rev., 107, 182–196,
3889-2019, 2019. https://doi.org/10.1016/j.quascirev.2014.10.025, 2015a.
Belmonte Rivas, M. and Stoffelen, A.: Characterizing ERA-Interim Dutton, A., Carlson, A. E., Long, A. J., Milne, G. A.,
and ERA5 surface wind biases using ASCAT, Ocean Sci., 15, Clark, P. U., DeConto, R., Horton, B. P., Rahmstorf, S.,
831–852, https://doi.org/10.5194/os-15-831-2019, 2019. and Raymo, M. E.: Sea-level rise due to polar ice-sheet
Bindoff, N. L., Cheung, W. W. L., Kairo, J. G., Arístegui, J., Guin- mass loss during past warm periods, Science, 349, aaa4019,
der, V. A., Hallberg, R., Hilmi, N., Jiao, N., Karim, M. S., Levin, https://doi.org/10.1126/science.aaa4019, 2015b.
L., O’Donoghue, S., Purca Cuicapusa, S. R., Rinkevich, B., Suga, Dyer, B., Austermann, J., D’Andrea, W. J., Creel, R. C., Sand-
T., Tagliabue, A., and Williamson, P.: Changing Ocean, Marine strom, M. R., Cashman, M., Rovere, A., and Raymo, M. E.:
Ecosystems, and Dependent Communities, 2019. Sea-level trends across The Bahamas constrain peak last inter-
Bramante, J. F., Ford, M. R., Kench, P. S., Ashton, A. D., Toomey, glacial ice melt, P. Natl. Acad. Sci. USA, 118, e2026839118,
M. R., Sullivan, R. M., Karnauskas, K. B., Ummenhofer, C. https://doi.org/10.1073/pnas.2026839118, 2021.
C., and Donnelly, J. P.: Increased typhoon activity in the Pa- Enríquez, A. R., Wahl, T., Marcos, M., and Haigh, I. D.:
cific deep tropics driven by Little Ice Age circulation changes, Spatial Footprints of Storm Surges Along the Global
Nat. Geosci., 13, 806–811, https://doi.org/10.1038/s41561-020- Coastlines, J. Geophys. Res.-Oceans, 125, e2020JC016367,
00656-2, 2020. https://doi.org/10.1029/2020JC016367, 2020.
CAPE_Members: Last Interglacial Arctic warmth confirms polar Francis, J. and Skific, N.: Evidence linking rapid Arctic warming
amplification of climate change, Quaternary Sci. Rev., 25, 1383– to mid-latitude weather patterns, Philos. T. Roy. Soc. A, 373,
1400, https://doi.org/10.1016/j.quascirev.2006.01.033, 2006. 20140170, https://doi.org/10.1098/rsta.2014.0170, 2015.
Catto, J. L., Ackerley, D., Booth, J. F., Champion, A. J., Colle, B. A., Fretwell, P., Pritchard, H. D., Vaughan, D. G., Bamber, J. L., Bar-
Pfahl, S., Pinto, J. G., Quinting, J. F., and Seiler, C.: The Future rand, N. E., Bell, R., Bianchi, C., Bingham, R. G., Blanken-
of Midlatitude Cyclones, Curr. Clim. Change Rep., 5, 407–420, ship, D. D., Casassa, G., Catania, G., Callens, D., Conway, H.,
https://doi.org/10.1007/s40641-019-00149-4, 2019. Cook, A. J., Corr, H. F. J., Damaske, D., Damm, V., Ferracci-
Cerrone, C., Vacchi, M., Fontana, A., and Rovere, A.: Last In- oli, F., Forsberg, R., Fujita, S., Gim, Y., Gogineni, P., Griggs,
terglacial sea-level proxies in the western Mediterranean, Earth J. A., Hindmarsh, R. C. A., Holmlund, P., Holt, J. W., Jacobel,
Syst. Sci. Data, 13, 4485–4527, https://doi.org/10.5194/essd-13- R. W., Jenkins, A., Jokat, W., Jordan, T., King, E. C., Kohler,
4485-2021, 2021. J., Krabill, W., Riger-Kusk, M., Langley, K. A., Leitchenkov,
Chang, E. K. M., Guo, Y., and Xia, X.: CMIP5 multimodel en- G., Leuschen, C., Luyendyk, B. P., Matsuoka, K., Mouginot,
semble projection of storm track change under global warm- J., Nitsche, F. O., Nogi, Y., Nost, O. A., Popov, S. V., Rignot,
ing, Journal of Geophysical Research: Atmospheres, 117, E., Rippin, D. M., Rivera, A., Roberts, J., Ross, N., Siegert,
10.1029/2012jd018578, 2012. M. J., Smith, A. M., Steinhage, D., Studinger, M., Sun, B.,
Charnock, H.: Wind stress on a water surface, Q. J. Roy. Meteo- Tinto, B. K., Welch, B. C., Wilson, D., Young, D. A., Xiangbin,
rol. Soc., 81, 639–640, https://doi.org/10.1002/qj.49708135027, C., and Zirizzotti, A.: Bedmap2: improved ice bed, surface and
1955. thickness datasets for Antarctica, The Cryosphere, 7, 375–393,
Compo, G. P., Whitaker, J. S., Sardeshmukh, P. D., Matsui, N., Al- https://doi.org/10.5194/tc-7-375-2013, 2013.
lan, R. J., Yin, X., Gleason, B. E., Vose, R. S., Rutledge, G., Garner, A. J., Kopp, R. E., and Horton, B. P.: Evolv-
Bessemoulin, P., Brönnimann, S., Brunet, M., Crouthamel, R. I., ing Tropical Cyclone Tracks in the North Atlantic in
Grant, A. N., Groisman, P. Y., Jones, P. D., Kruk, M. C., Kruger, a Warming Climate, Earth’s Future, 9, e2021EF002326,
A. C., Marshall, G. J., Maugeri, M., Mok, H. Y., Nordli, Ø., Ross, https://doi.org/10.1029/2021EF002326, 2021.
T. F., Trigo, R. M., Wang, X. L., Woodruff, S. D., and Worley, S. Weatherall, P., Marks, K. M., Jakobsson, M., Schmitt, T., Tani, S.,
J.: The Twentieth Century Reanalysis Project, Q. J. Roy. Meteo- Arndt, J. E., Rovere, M., Chayes, D., Ferrini, V., and Wigley, R.:
rol. Soc., 137, 1–28, https://doi.org/10.1002/qj.776, 2011. A new digital bathymetric model of the world’s oceans, Earth
Consortium_EMODnet_Bathymetry: EMODnet Digital
Bathymetry (DTM), Consortium_EMODnet_Bathymetry
https://doi.org/10.5194/cp-19-141-2023 Clim. Past, 19, 141–157, 2023154 P. Scussolini et al.: Modeled storm surge changes in a warmer world: the Last Interglacial Space Sci., 2, 331–345, https://doi.org/10.1002/2015EA000107, Hurrell, J. W., Holland, M. M., Gent, P. R., Ghan, S., Kay, J. E., 2015. Kushner, P. J., Lamarque, J.-F., Large, W. G., Lawrence, D., Gowan, E. J., Rovere, A., Ryan, D. D., Richiano, S., Montes, A., Lindsay, K., Lipscomb, W. H., Long, M. C., Mahowald, N., Pappalardo, M., and Aguirre, M. L.: Last interglacial (MIS 5e) Marsh, D. R., Neale, R. B., Rasch, P., Vavrus, S., Vertenstein, sea-level proxies in southeastern South America, Earth Syst. Sci. M., Bader, D., Collins, W. D., Hack, J. J., Kiehl, J., and Mar- Data, 13, 171–197, https://doi.org/10.5194/essd-13-171-2021, shall, S.: The Community Earth System Model: A Framework 2021. for Collaborative Research, B. Am. Meteorol. Soc., 94, 1339– Haarsma, R. J., Hazeleger, W., Severijns, C., de Vries, H., 1360, https://doi.org/10.1175/bams-d-12-00121.1, 2013. Sterl, A., Bintanja, R., van Oldenborgh, G. J., and van den Idier, D., Bertin, X., Thompson, P., and Pickering, M. D.: Brink, H. W.: More hurricanes to hit western Europe due Interactions Between Mean Sea Level, Tide, Surge, Waves to global warming, Geophys. Res. Lett., 40, 1783–1788, and Flooding: Mechanisms and Contributions to Sea Level https://doi.org/10.1002/grl.50360, 2013. Variations at the Coast, Surv. Geophys., 40, 1603–1630, Hansen, J., Sato, M., Hearty, P., Ruedy, R., Kelley, M., Masson- https://doi.org/10.1007/s10712-019-09549-5, 2019. Delmotte, V., Russell, G., Tselioudis, G., Cao, J., Rignot, Islam, M. R., Lee, C.-Y., Mandli, K. T., and Takagi, H.: A new tropi- E., Velicogna, I., Tormey, B., Donovan, B., Kandiano, E., cal cyclone surge index incorporating the effects of coastal geom- von Schuckmann, K., Kharecha, P., Legrande, A. N., Bauer, M., etry, bathymetry and storm information, Scient. Rep., 11, 16747, and Lo, K.-W.: Ice melt, sea level rise and superstorms: evi- https://doi.org/10.1038/s41598-021-95825-7, 2021. dence from paleoclimate data, climate modeling, and modern Jouzel, J., Masson-Delmotte, V., Cattani, O., Dreyfus, G., Falourd, observations that 2 ◦ C global warming could be dangerous, At- S., Hoffmann, G., Minster, B., Nouet, J., Barnola, J. M., mos. Chem. Phys., 16, 3761–3812, https://doi.org/10.5194/acp- Chappellaz, J., Fischer, H., Gallet, J. C., Johnsen, S., Leuen- 16-3761-2016, 2016. berger, M., Loulergue, L., Luethi, D., Oerter, H., Parrenin, F., Harvey, B. J., Cook, P., Shaffrey, L. C., and Schiemann, R.: Raisbeck, G., Raynaud, D., Schilt, A., Schwander, J., Selmo, The Response of the Northern Hemisphere Storm Tracks E., Souchez, R., Spahni, R., Stauffer, B., Steffensen, J. P., and Jet Streams to Climate Change in the CMIP3, CMIP5, Stenni, B., Stocker, T. F., Tison, J. L., Werner, M., and and CMIP6 Climate Models, J. Geophys. Res.-Atmos., 125, Wolff, E. W.: Orbital and millennial Antarctic climate vari- e2020JD032701, https://doi.org/10.1029/2020JD032701, 2020. ability over the past 800,000 years, Science, 317, 793–796, Hearty, P. J.: Boulder Deposits from Large Waves during the Last https://doi.org/10.1126/science.1141038, 2007. Interglaciation on North Eleuthera Island, Bahamas, Quatern. Kaspar, F., Spangehl, T., and Cubasch, U.: Northern hemisphere Res., 48, 326–338, https://doi.org/10.1006/qres.1997.1926, winter storm tracks of the Eemian interglacial and the last glacial 1997. inception, Clim. Past, 3, 181–192, https://doi.org/10.5194/cp-3- Hearty, P. J. and Tormey, B. R.: Sea-level change and 181-2007, 2007. superstorms; geologic evidence from the last inter- Kernkamp, H. W. J., Van Dam, A., Stelling, G. S., and de Goede, E. glacial (MIS 5e) in the Bahamas and Bermuda offers ominous D.: Efficient scheme for the shallow water equations on unstruc- prospects for a warming Earth, Mar. Geol., 390, 347–365, tured grids with application to the Continental Shelf, Ocean Dy- https://doi.org/10.1016/j.margeo.2017.05.009, 2017. nam., 61, 1175–1188, https://doi.org/10.1007/s10236-011-0423- Hearty, P. J. and Tormey, B. R.: Listen to the whisper of the rocks, 6, 2011. telling their ancient story, P. Natl. Acad. Sci. USA, 115, E2902– Kirezci, E., Young, I. R., Ranasinghe, R., Muis, S., Nicholls, E2903, https://doi.org/10.1073/pnas.1721253115, 2018. R. J., Lincke, D., and Hinkel, J.: Projections of global- Hearty, P. J., Neumann, A. C., and Kaufman, D. S.: Chevron scale extreme sea levels and resulting episodic coastal Ridges and Runup Deposits in the Bahamas from Storms Late flooding over the 21st Century, Scient. Rep., 10, 11629, in Oxygen-Isotope Substage 5e, Quatern. Res., 50, 309–322, https://doi.org/10.1038/s41598-020-67736-6, 2020. https://doi.org/10.1006/qres.1998.2006, 1998. Knutson, T., Camargo, S. J., Chan, J. C. L., Emanuel, K., Ho, C.- Henson, R.: Hurricanes in Disguise, Weatherwise, 48, 12–17, H., Kossin, J., Mohapatra, M., Satoh, M., Sugi, M., Walsh, K., https://doi.org/10.1080/00431672.1996.9925997, 1996. and Wu, L.: Tropical Cyclones and Climate Change Assessment: Hersbach, H., Bell, B., Berrisford, P., Hirahara, S., Horányi, A., Part I: Detection and Attribution, B. Am. Meteorol. Soc., 100, Muñoz-Sabater, J., Nicolas, J., Peubey, C., Radu, R., Schepers, 1987–2007, https://doi.org/10.1175/bams-d-18-0189.1, 2019. D., Simmons, A., Soci, C., Abdalla, S., Abellan, X., Balsamo, G., Knutson, T., Camargo, S. J., Chan, J. C. L., Emanuel, K., Ho, C.- Bechtold, P., Biavati, G., Bidlot, J., Bonavita, M., De Chiara, G., H., Kossin, J., Mohapatra, M., Satoh, M., Sugi, M., Walsh, K., Dahlgren, P., Dee, D., Diamantakis, M., Dragani, R., Flemming, and Wu, L.: Tropical Cyclones and Climate Change Assessment: J., Forbes, R., Fuentes, M., Geer, A., Haimberger, L., Healy, Part II: Projected Response to Anthropogenic Warming, B. Am. S., Hogan, R. J., Hólm, E., Janisková, M., Keeley, S., Laloy- Meteorol. Soc., 101, E303–E322, https://doi.org/10.1175/bams- aux, P., Lopez, P., Lupu, C., Radnoti, G., de Rosnay, P., Rozum, d-18-0194.1, 2020. I., Vamborg, F., Villaume, S., and Thépaut, J.-N.: The ERA5 Koh, J. H. and Brierley, C. M.: Tropical cyclone genesis po- global reanalysis, Q. J. Roy. Meteorol. Soc., 146, 1999–2049, tential across palaeoclimates, Clim. Past, 11, 1433–1451, https://doi.org/10.1002/qj.3803, 2020. https://doi.org/10.5194/cp-11-1433-2015, 2015. Hoffman, J. S., Clark, P. U., Parnell, A. C., and He, F.: Regional and Kopp, R. E., Simons, F. J., Mitrovica, J. X., Maloof, A. global sea-surface temperatures during the last interglaciation, C., and Oppenheimer, M.: Probabilistic assessment of sea Science, 355, 276–279, https://doi.org/10.1126/science.aai8464, level during the last interglacial stage, Nature, 462, 863–867, 2017. https://doi.org/10.1038/nature08686, 2009. Clim. Past, 19, 141–157, 2023 https://doi.org/10.5194/cp-19-141-2023
P. Scussolini et al.: Modeled storm surge changes in a warmer world: the Last Interglacial                                                155

Lunt, D. J., Elderfield, H., Pancost, R., Ridgwell, A., Foster, G.      O’Gorman, P. A. and Schneider, T.: Energy of Midlatitude Transient
  L., Haywood, A., Kiehl, J., Sagoo, N., Shields, C., Stone,               Eddies in Idealized Simulations of Changed Climates, J. Climate,
  E. J., and Valdes, P.: Warm climates of the past – a les-                21, 5797–5806, https://doi.org/10.1175/2008jcli2099.1, 2008.
  son for the future?, Philos. T. Roy. Soc. A, 371, 20130146,           Otto-Bliesner, B. L., Rosenbloom, N., Stone, E. J., McKay, N. P.,
  https://doi.org/10.1098/rsta.2013.0146, 2013.                            Lunt, D. J., Brady, E. C., and Overpeck, J. T.: How warm was the
Lyell, C.: Principles of Geology; Being an Attempt to Explain the          last interglacial? New model–data comparisons, Philos. T. Roy.
  Former Changes of the Earth’s Surface, by Reference to Causes            Soc. A, 71, 20130097, https://doi.org/10.1098/rsta.2013.0097,
  Now in Operation, London, J. Murray, to 1833, https://www.loc.           2013.
  gov/item/45042424/ (last access: 10 January 2023), 1830.              Otto-Bliesner, B. L., Braconnot, P., Harrison, S. P., Lunt, D. J.,
Makkonen, L.: Plotting Positions in Extreme Value                          Abe-Ouchi, A., Albani, S., Bartlein, P. J., Capron, E., Carlson,
  Analysis, J. Appl. Meteorol. Clim., 45, 334–340,                         A. E., Dutton, A., Fischer, H., Goelzer, H., Govin, A., Hay-
  https://doi.org/10.1175/jam2349.1, 2006.                                 wood, A., Joos, F., LeGrande, A. N., Lipscomb, W. H., Lohmann,
Marsooli, R., Lin, N., Emanuel, K., and Feng, K.: Climate change           G., Mahowald, N., Nehrbass-Ahles, C., Pausata, F. S. R., Peter-
  exacerbates hurricane flood hazards along US Atlantic and Gulf           schmitt, J.-Y., Phipps, S. J., Renssen, H., and Zhang, Q.: The
  Coasts in spatially varying patterns, Nat. Commun., 10, 3785,            PMIP4 contribution to CMIP6 – Part 2: Two interglacials, scien-
  https://doi.org/10.1038/s41467-019-11755-z, 2019.                        tific objective and experimental design for Holocene and Last
McKay, N. P., Overpeck, J. T., and Otto-Bliesner, B. L.:                   Interglacial simulations, Geosci. Model Dev., 10, 3979–4003,
  The role of ocean thermal expansion in Last Inter-                       https://doi.org/10.5194/gmd-10-3979-2017, 2017.
  glacial sea level rise, Geophys. Res. Lett., 38, L14605,              Otto-Bliesner, B. L., Brady, E. C., Zhao, A., Brierley, C. M., Axford,
  https://doi.org/10.1029/2011GL048280, 2011.                              Y., Capron, E., Govin, A., Hoffman, J. S., Isaacs, E., Kageyama,
Mori, N., Shimura, T., Yoshida, K., Mizuta, R., Okada,                     M., Scussolini, P., Tzedakis, P. C., Williams, C. J. R., Wolff, E.,
  Y., Fujita, M., Khujanazarov, T., and Nakakita, E.: Fu-                  Abe-Ouchi, A., Braconnot, P., Ramos Buarque, S., Cao, J., de
  ture changes in extreme storm surges based on mega-                      Vernal, A., Guarino, M. V., Guo, C., LeGrande, A. N., Lohmann,
  ensemble projection using 60-km resolution atmospheric                   G., Meissner, K. J., Menviel, L., Morozova, P. A., Nisancioglu,
  global circulation model, Coast. Eng. J., 61, 295–307,                   K. H., O’Ishi, R., Salas y Mélia, D., Shi, X., Sicard, M., Sime, L.,
  https://doi.org/10.1080/21664250.2019.1586290, 2019.                     Stepanek, C., Tomas, R., Volodin, E., Yeung, N. K. H., Zhang,
Muis, S., Verlaan, M., Winsemius, H. C., Aerts, J. C., and Ward,           Q., Zhang, Z., and Zheng, W.: Large-scale features of Last In-
  P. J.: A global reanalysis of storm surges and extreme sea levels,       terglacial climate: results from evaluating the lig127k simula-
  Nat. Commun., 7, 11969, https://doi.org/10.1038/ncomms11969,             tions for the Coupled Model Intercomparison Project (CMIP6)–
  2016.                                                                    Paleoclimate Modeling Intercomparison Project (PMIP4), Clim.
Muis, S., Apecechea, M. I., Dullaart, J., de Lima Rego, J., Mad-           Past, 17, 63–94, https://doi.org/10.5194/cp-17-63-2021, 2021.
  sen, K. S., Su, J., Yan, K., and Verlaan, M.: A High-Resolution       Pfleiderer, P., Schleussner, C.-F., Kornhuber, K., and Coumou, D.:
  Global Dataset of Extreme Sea Levels, Tides, and Storm Surges,           Summer weather becomes more persistent in a 2 ◦ C world, Nat.
  Including Future Projections, Front. Mar. Sci., 7, ISSN 2296-            Clim. Change, 9, 666–671, https://doi.org/10.1038/s41558-019-
  7745, https://doi.org/10.3389/fmars.2020.00263, 2020.                    0555-0, 2019.
Muis, S., Aerts, J. C. J. H., Álvarez-Antolínez, J. A., Dullaart, J.,   Raible, C. C., Pinto, J. G., Ludwig, P., and Messmer, M.: A re-
  Duong, T. M., Erikson, L., Haarmsa, R., Apecechea, M. I., Men-           view of past changes in extratropical cyclones in the northern
  gel, M., Bars, D. L., O’Neill, A., Ranasinghe, R., Roberts, M.,          hemisphere and what can be learned for the future, WIREs Clim.
  Verlaan, M., Ward, P. J., and Yan, K.: Global projections of storm       Change, 12, e680, https://doi.org/10.1002/wcc.680, 2021.
  surges using high-resolution CMIP6 climate models: validation,        Resio, D. T. and Westerink, J. J.: Modeling the
  projected changes, and methodological challenges, Earth Space            physics of storm surges, Phys. Today, 61, 33–38,
  Sci. Open Arch., 21, https://doi.org/10.1002/essoar.10511919.1,          https://doi.org/10.1063/1.2982120, 2008.
  2022.                                                                 Roberts, M. J., Camp, J., Seddon, J., Vidale, P. L., Hodges, K., Van-
Mylroie, J. E.: Late Quaternary sea-level position: Evidence from          niere, B., Mecking, J., Haarsma, R., Bellucci, A., Scoccimarro,
  Bahamian carbonate deposition and dissolution cycles, Quatern.           E., Caron, L.-P., Chauvin, F., Terray, L., Valcke, S., Moine, M.-
  Int., 183, 61–75, https://doi.org/10.1016/j.quaint.2007.06.030,          P., Putrasahan, D., Roberts, C., Senan, R., Zarzycki, C., and Ull-
  2008.                                                                    rich, P.: Impact of Model Resolution on Tropical Cyclone Sim-
Mylroie, J. E.: Superstorms: Comments on Bahamian Fenestrae and            ulation Using the HighResMIP–PRIMAVERA Multimodel En-
  Boulder Evidence from the Last Interglacial, J. Coast. Res., 34,         semble, J. Climate, 33, 2557–2583, https://doi.org/10.1175/jcli-
  1471–1483, 1413, 2018.                                                   d-19-0639.1, 2020.
NCAR: National Center for Atmospheric Research (NCAR), Com-             Rodysill, J. R., Donnelly, J. P., Sullivan, R., Lane, P. D.,
  munity Earth System Model 2 (CESM2), CESM [code], https:                 Toomey, M., Woodruff, J. D., Hawkes, A. D., MacDonald, D.,
  //www.cesm.ucar.edu/models/cesm2, last access: 10 January                d’Entremont, N., McKeon, K., Wallace, E., and van Hengstum,
  2023.                                                                    P. J.: Historically unprecedented Northern Gulf of Mexico hur-
Neem_Community_Members: Eemian interglacial reconstructed                  ricane activity from 650 to 1250 CE, Scient. Rep., 10, 19092,
  from a Greenland folded ice core, Nature, 493, 489–494,                  https://doi.org/10.1038/s41598-020-75874-0, 2020.
  https://doi.org/10.1038/nature11789, 2013.                            Rohling, E. J., Hibbert, F. D., Grant, K. M., Galaasen, E. V., Ir-
                                                                           valı, N., Kleiven, H. F., Marino, G., Ninnemann, U., Roberts, A.
                                                                           P., Rosenthal, Y., Schulz, H., Williams, F. H., and Yu, J.: Asyn-

https://doi.org/10.5194/cp-19-141-2023                                                                   Clim. Past, 19, 141–157, 2023
You can also read