Middle Market M&A Update - Q1 2021 - MNP
←
→
Page content transcription
If your browser does not render page correctly, please read the page content below

Middle Market M&A Update
Q1 2021

                           MNPCF.ca
M&A Market Summary
  Canadian Mid-Market

  Aggregate deal value for the quarter increased to $5.8
  billion across 87 transactions, the highest mid-market                                                Q1'21 - M&A Volume By Sector
  deal volume in Canada since Q4 2017. By comparison, Q4
  2020 totalled $4 billion in aggregate deal value across 66
  transactions. Equity market strength and low interest                                                                        Utilities
                                                                                                                                              Consumer
  rates have supported M&A volume over the quarter.                                                Communication                 2%
                                                                                                                                             Discretionary
  Increased activity suggests that investor sentiment is                                              Services                                    5%
  increasingly positive.                                                                                5%                                                Consumer
  The chart to the right summarizes transaction volume per                                                                                                 Staples
  sector, as defined by the S&P/TSX Composite Index. The                                                                                                     13%
  mix of transactions compared to last quarter indicates                                      Materials
  higher volumes in information technology, energy, and                                        24%
  materials, offset by lower volumes in industrials and                                                                       87                                 Energy
  financials.
                                                                                                                         Transactions                             11%
  •                 Materials accounted for 24% of total deal volume with
                    21 deals made in the quarter, 15 of which relate to
                    gold mining.
                                                                                                                                                                Financials
  •                 Health care accounted for 17% of total deal volume,                       Information                                                          1%
                    down from 20% in the previous quarter. There were 15                      Technology
                    deals in the space, seven of which were made by                               15%                                              Health Care
                    companies in the cannabis/psychedelics space and                                                                                  17%
                                                                                                                     Industrials
                    five of which were made by digital healthcare
                                                                                                                        7%
                    solutions companies. HEXO Corp closed the largest
                    mid-market health care deal in the quarter, acquiring
                    Zenabis Global Inc for $310 million.
  •                 Information technology accounted for 15% of total M&A volume, including two large deals in software.

                            7
                                                             Quarterly Deal Volume and Value*                                                              100

                                                                                                                                                                   Deal Volume (Number of Transactions)
                            6
                                                                                                                                                           75
                            5
  Deal Value ($ Billions)

                            4
                                        $7.1B                                                                                                              50
                            3                                                           $5.7B                                                      $5.8B
                                                $5.1B $5.2B $5.0B $5.0B $5.1B
                                $4.6B                                                                   $4.2B
                            2                                                                                                              $4.0B
                                                                                $3.4B                                              $3.5B                   25
                                                                                                $2.7B            $2.9B $2.7B
                            1

                            -                                                                                                                              -

                                                                        Deal Value              Deal Volume

*Based on Canadian publicly disclosed transactions in the enterprise value range of $5 million to $500 million. Currency in USD.
Source: S&P Capital IQ.                                                                                                                                          Page 2
Equity Markets

In Q1 2021, the TSX Composite posted positive gains
                                                                                                Q1 2021 Sector Performance*
for the fourth straight quarter, fueled by economic
recovery and continued government stimulus. The                                                    Sector               TSX         S&P 500
health care, energy, financials, and consumer                                                                         Composite
discretionary sectors all posted 13%+ gains, with only
one sector, materials, posting a loss. Out of the 235                                 Healthcare                         32.7%       3.3%
stocks that were in the TSX Composite over the
quarter, 164 recorded a gain, with small caps                                         Energy                             26.8%       29.1%
outperforming large caps, and mid caps lagging. The
index as a whole returned 6.7% in Q1 2021.                                            Financials                         13.7%       16.9%
•    The health care sector outperformed the broader
     market in Q1 2021, with a 32.7% return. Momentum                                 Consumer Discretionary             13.6%       4.1%
     for cannabis stocks continued to prevail with Aphria
     (+162%) and Canopy Growth Corp (+29%) making                                     Industrials                        7.4%        13.9%
     significant contributions to sector performance.
                                                                Communication Services          6.6%           9.5%
•    The financials sector returned 13.7% in Q1 2021.
     National Bank (+19%), Bank of Montreal (+16%) and          Consumer Staples                3.0%           1.6%
     Bank of Nova Scotia (+14%) benefitted from rising
     long-term interest rates and a reduction in loan loss      Information Technology          2.4%           3.6%
     provisions, delivering quarterly earnings that were
     significantly better than analyst expectations. Given      Utilities                       2.0%           4.7%
     the large weighting of financials in the index, the
     sector’s strong performance had a sizable influence        Materials                      -12.9%          9.7%
     on the overall return of the index.
•    The materials sector was the only sector to deliver a loss in the quarter, posting a -12.9% return. Fears and risks
     of recession that were alleviated by economic normalization caused a drop in gold prices, which drove the poor
     performance of gold and precious metal stocks, with seven of the top ten detractors being gold and precious
     metal miners.
                                North American Equity Indices - Q1 2021 Performance
    10.00%

    8.00%                                                                                                                            7.36%

    6.00%
                                                                                                                                      6.69%
    4.00%

    2.00%

    0.00%

    -2.00%
        Jan-04-2021            Jan-18-2021            Feb-01-2021            Feb-15-2021           Mar-01-2021      Mar-15-2021   Mar-29-2021

                                                     S&P 500 Index                   TSX Composite Index

* Sector performance based on the price change of each corresponding S&P 500 sector index over the quarter.
Sources: S&P Capital IQ, Linde Equity – TSX Quarterly Review and Raymond James – Quarterly Insights & Strategies.                       Page 3
Treasury Yields
Canada

On March 10, 2021, the Bank of Canada (BoC or Bank) decided to hold its target for the overnight rate at the
effective lower bound of 0.25%, which continues the BoC’s decision to maintain the same overnight interest rate
since March 2020. The Bank will continue its positive forward guidance, which is supplemented by its quantitative
easing (QE) program. This program will continue at a pace of at least $4 billion of large-scale asset purchases
(Government of Canada bonds) per week. Interest rates are expected to remain at this level until the target inflation
rate of 2.0% is achieved, which the Bank does not see happening until 2023.

                                                                                            2 & 10 YR CDN Gov't. Bond Yields
By the end of Q1 2021, the country began to enter a
third wave of COVID-19 infections. The Canadian                                      2.00%                                                           1.50%
                                                                                                 CND 10 Year 1.47%
government continues its roll-out of COVID-19                                                    CND 2 Year 0.23%

vaccines as supply is received. The Bank noted that the                                          Spread 1.24%
                                                                                     1.50%                                                           1.00%
year-over-year inflation rate will likely increase in the
coming months as recovery takes place, as prices for

                                                                                                                                                             Spread
goods and services are currently comparable to prices                        Yield
                                                                                     1.00%                                                           0.50%
depressed during the initial months of the pandemic
in 2020.
                                                                                     0.50%                                                           0.00%
Since last quarter (Q4 2020), the 10-year Canadian
Government Bond Yield has increased from
approximately 0.7% to 1.5%. The 2/10-year spread has                                 0.00%                                                           -0.50%
increased from approximately 0.5% to 1.2%. These
factors continue to improve in parallel to economic
improvement after the pandemic disruptions. As the
Canadian economy recovers, the Government of
Canada is targeting a stable inflation rate of 2.0%.                                    CND 2/10 SPREAD                   CND 10 YR                 CND 2 YR

As the economy moves forward into Q2 of 2021, the Bank will continue to provide the economy with monetary
policy support. The QE program is expected to continue with a gradual reduction as the Canadian economy
rebounds over the course of the year.

                                                CDN Government Bond Yield Curves
   2.50%

   2.00%

   1.50%

   1.00%

   0.50%

   0.00%

                                 CND 31-Mar-21                               CND Last Quarter                                CND Last Year

Sources: S&P Capital IQ, Bank of Canada, Globe and Mail, and Financial Post. The next scheduled dates in 2021 for the interest rate announcements
(excluding Monetary Policy Report releases) are June 9, and September 8, and December 8.                                                                Page 4
Treasury Yields
United States

On March 17, 2021, the Federal Reserve (Fed or Committee) decided to hold interest rates near zero (0.0% to
0.25%) and indicated that they will remain at this range until labour market conditions have reached key target
metrics levels, which is not expected until 2023. The Committee stated it would continue to buy at least $120B of
bonds each month until the aforementioned key target metrics are met.
According to the most recent release of the Fed’s
                                                                                           2 & 10 YR US Gov't. Bond Yields
Dot Plot on March 17, 2021, a majority of members
                                                                                  2.00%                                                              2.00%
agree and foresee the 0.0% to 0.25% interest rate to                                          US 10 Year 1.69%
                                                                                              US 2 Year 0.17%
remain until the end of 2023. The long run shows                                              Spread 1.52%
members targeting an interest rate of 2.0% to 3.0%.                                                                                                  1.50%
                                                                                  1.50%
The Fed reported a change in Real Gross Domestic
Product (GDP) of 6.5% since last quarter, which was                                                                                                  1.00%

                                                                                                                                                             Spread
higher than its 4.2% projection. The Fed also revised                             1.00%
its 2022 and 2023 forecast of 3.3% and 2.2%,                              Yield
                                                                                                                                                     0.50%
respectively.
The 2021 median unemployment rate has been                                        0.50%
                                                                                                                                                     0.00%
reported at 4.5%, which is 0.5% lower than its
projections. Moving forward, the Fed expects 2022
unemployment to be 3.9% versus its initial projection                             0.00%                                                              -0.50%
of 4.2% and 2023 unemployment to be 3.5% versus
its initial projection of 3.7%.
Since last quarter (Q4 2020), the 10-year US
Government     Bond   Yield    has    gone  from                                        US 2/10 SPREAD                   US 10 YR              US 2 YR
approximately 0.9% to 1.7%. The 2/10-year spread
has gone from approximately 0.8% to 1.6%.
The Fed will continue to monitor incoming information regarding the economic outlook and global developments
and act appropriately to support the economy. The Committee's assessments will take into account a wide range of
information, including readings on public health, labour market conditions, inflation pressures and inflation
expectations, and financial and international developments.

                                                 US Government Bond Yield Curves
3.00%

2.50%

2.00%

1.50%

1.00%

0.50%

0.00%

                                    CND 31-Mar-21                             US Last Quarter                          US Last Year

Source: S&P Capital IQ, Federal Reserve, and CNBC, The next scheduled dates in 2021 for FOMC interest rate announcements are April 27-28, June 15-
16, July 27-28, September 21-22, November 2-3, and December 14-15.                                                                                      Page 5
Commodity Markets

                                                                                          •    In YTD 2021, crude oil prices for Western
                                           Crude Oil Differential
                                                                                               Canadian Select (WCS) has risen by ~10%, while
                   80.0
                                                                                               West Texas Intermediate (WTI) has risen by ~3%.
                   60.0
                                                                                          •    Since their lows in April 2020, both WCS and WTI
     $USD/Barrel

                   40.0                                                                        have recovered, with prices reaching a high of
                                                                                               ~$51/barrel and ~$62/barrel, respectively.
                   20.0
                                                                                          •    The price differential reduced to ~$8/barrel in Q3
                     0.0
                                                                                               of 2020 and since then has grown to ~$11/barrel
                   -20.0                                                                       at the end of Q1 2021.

                                                                                          •    Moving forward, prices for WCS and WTI are
                                                                                               predicted to average $50/barrel and $62/barrel
                          Differential                 WTI                      WCS            until the end of Q3 2021 after which they will
                                                                                               reduce to $46/barrel and $59/barrel, respectively.
                          WTI Forecast                 WCS Forecast

                                         Natural Gas (Henry Hub)                          •    Natural gas prices grew by 3.2% (~$0.1/mm BTU),
                   3.90                                                                        since the previous quarter to $2.6/mm BTU in
                                                                                               March 2021.
                   3.40
                                                                                          •    During the YTD 2021 period (Jan to Mar), natural
                   2.90
                                                                                               gas prices saw minimal volatility with lows of
     $USD/mm BTU

                   2.40                                                                        ~$2.5/mm BTU and highs of ~$3.0/mm BTU.

                   1.90
                                                             2.623                        •    There is potential for growth that may be driven
                                                                                               by a colder summer in 2021, which will create a
                   1.40                                                                        tight supply market for natural gas.
                                                                                          •    Growth in prices is expected in subsequent
                                                                                               quarters as Q2 growth is expected to be ~9%.
                                   Historical Pricing                Future Contracts

                                               Gold (COMEX)                               •    Gold prices witnessed a decline of ~10% in YTD
             2200                                                                              2021 as prices dropped from $1895/oz. in January
                                                                                               to $1716/oz. in March.
             2000
                                                                                          •    Certainty surrounding the US currency and global
              1800                                                                             markets as well as reduced quantitative easing
$USD/oz.

                                                                                               measures has instilled greater confidence in many.
                                                              1716
              1600                                                                        •    A strong USD tends to have an inverse relation
                                                                                               with gold prices as gold is priced in USD and
              1400                                                                             foreign investors shift money into more traditional
                                                                                               value sources when the currency is appreciating.
              1200
                                                                                          •    Gold prices are expected to remain stable at a
                                                                                               $1777/oz average in 2021 but continue to face
                                                                                               pressures from rising inflation and Treasury Yields
                                  Historical Pricing             Future Contracts
                                                                                               implemented by the US Federal Reserve.

     Source: S&P Capital IQ, Oil Sands Magazine, Alberta Government – Economic Dashboard, Reuters. All prices are in USD unless otherwise stated.   Page 6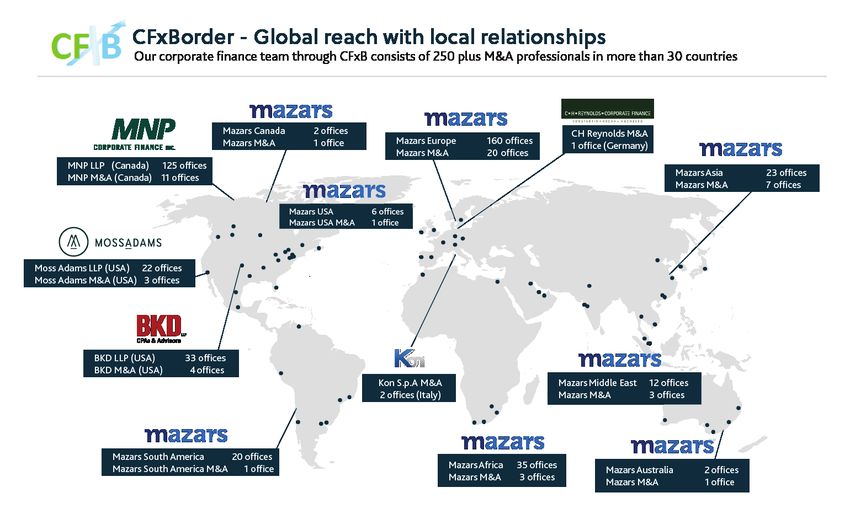
Canadian Economic Update

The Canadian dollar ended Q1 2021 at 1.26 USD/CAD,
displaying relatively strong performance fueled by an                                                      CAD/USD Exchange Rate*
economy that exceeded expectations and a weakening
USD. Strengthening global demand and decreased
supply have contributed to rising commodity prices,                                           1.36
which has had a positive effect on the CAD.
                                                                                              1.34
Real GDP is forecasted to increase 4.5% in Q1 2021
reflecting expectations of a supportive monetary and                                          1.32
fiscal policy. The roll-out of COVID-19 vaccinations has
                                                                                              1.30
continued to create expectations of economic

                                                                                    CAD Per USD
normalization and increased risk appetite throughout                                          1.28                                             1.26
2021, however, the looming third wave of cases and
logistical problems with vaccine distribution could                                           1.26
hinder investor sentiment and economic recovery.
                                                                                              1.24
Canada’s housing market has continued to perform
very well in Q1 2021 as low interest rates and elevated                                       1.22
savings balances fuel accelerating home sales.
                                                                                              1.20
Canada’s unemployment rate, which fell to 8.8% in Q4
2020, bounced to 9.2% in Q1 2021, as industries that                                              1.18
have suffered through the third wave of COVID-19,
particularly the service-sector, were forced to make job
cuts. Labour markets are expected to recover as these
companies begin rehiring employees.
                                                                                                                                Historical
The consumer price index is expected to grow                                                                                    Forecast
approximately 1.7% in Q1 2021. Inflation is projected to
increase, fueled by rising commodity prices and growth                                            Note: RBC forecasts a Q2’21 CAD/USD exchange rate of 1.26.
in household spending.

     Real GDP Growth                      Unemployment Rate                                Housing Starts                     Consumer Price Index
      (YoY % change)**                          (%)**                                         ('000s)**                          (YoY % change)**

   Year             Canada                  Year            Canada                  Year                    Canada              Year           Canada

   2020              -5.4%                 2020               9.6%                  2020                      218               2020             0.7%
     Q3'20                  40.6%            Q3'20                   10.1%             Q3'20                           63         Q3'20                 0.3%
     Q4'20                    9.6%           Q4'20                    8.8%             Q4'20                           64         Q4'20                 0.8%
    Q1'21F                    4.5%          Q1'21F                    9.2%           Q1'21F                          N/A         Q1'21F                 1.7%
    Q2'21F                    5.0%          Q2'21F                    8.0%          Q2'21F                           N/A         Q2'21F                 3.1%
   2021F              6.3%                 2021F              7.7%                 2021F                      249               2021F            2.1%
  2022F               4.1%                2022F               6.1%                 2022F                      200              2022F             2.0%

Exchange rate data as of March 31, 2021. Forecast from RBC Financial Markets Monthly – March 2021.
**RBC Capital Markets Economic Research, Statistics Canada and Canada Mortgage and Housing Corporation.
Sources: S&P Capital IQ, RBC Economics - Current Trends Update - Canada, National Bank of Canada – Economics and Strategy – FX Update – March 2021,
www.tradingeconomics.com/canada/unemployment-rate                                                                                                       Page 7
About Us

MNP Corporate Finance (MNPCF) has a dedicated team of over 85             Recently Closed Deals
merger, acquisition, and transaction professionals across Canada.
MNPCF works with clients in virtually all industries as they prepare,          (National)
plan and execute transactions.

Our typical transactions range in value between $3 million and
$300 million.

              Local and International Reach
MNP is a participating firm within Praxity, a unique global alliance of
independent accounting/advisory firms created to answer global
business needs. As a member of Praxity, we are able to offer access
to corporate finance, accounting, and tax advisory services
worldwide. We are also affiliated with Corporate Finance Cross
Border, which consists of 250+ M&A professionals in more than 30
countries.

                              Services
           • Divestitures              • Due Diligence
           • Acquisitions              • Transaction Advisory
           • Debt Financing              Services

                                                                                             Page 8
About Us

                        Deal Experience                               Recently Closed Deals
                                                                           (National)
Since our inception, our team has advised on hundreds of
transactions, in a wide range of industries with diverse enterprise
values. In the past five years alone we have completed over 125
transactions worth over $2 billion (not including due diligence
engagements).

                     Industry Experience
      •   Food & Beverage                •   Transportation
      •   Retail & Distribution          •   Construction
      •   Manufacturing                  •   Software
      •   Agriculture                    •   Financial Services
      •   Automotive                     •   Technology
      •   Materials                      •   Energy
      •   Health Care                    •   Oilfield Services
      •   Pharmaceutical                 •   Real Estate

                    Hands-on Approach
Current M&A transactions require a hands-on approach from start
to finish including the active engagement of senior resources. Our
senior resources are dedicated to our clients and are available as
necessary and appropriate. We keep our clients regularly informed
of the engagement status, issues we are encountering, successes,
and overall progress.

               Integrated Service Offering
We draw on the vast experience and deep specialist knowledge
network of our partners locally, nationally and internationally as
specialty issues arise, such as pre-transaction tax planning,
transaction structuring, estate planning, valuation, due diligence,
performance improvement, and risk management.

                                                                                         Page 9
Leadership Team
                                         Transaction Leadership

         Brett Franklin            Aleem Bandali              Mark Regehr              Mike Reynolds
             President            Managing Director        Managing Director          Managing Director
      Brett.Franklin@mnp.ca     Aleem.Bandali@mnp.ca      Mark.Regehr@mnp.ca        Mike.Reynolds@mnp.ca
           204.336.6190             778.374.2140              780.969.1404               587.702.5909

         Erik St-Hilaire            Stephen Shaw               Dan Porter              Kevin Tremblay
       Managing Director           Managing Director       Managing Director          Managing Director
     Erik.St-Hilaire@mnp.ca      Stephen.Shaw@mnp.ca       Dan.Porter@mnp.ca        Kevin.Tremblay@mnp.ca
          204.336.6200                416.515.3883            416.515.3877                647.943.4051

          Jon Edgett              Patrick Khouzam          Jonathan Banford             Éric Grondin
        Managing Director          Managing Director        Managing Director         Managing Director
       Jon.Edgett@mnp.ca        Patrick.Khouzam@mnp.ca   Jonathan.Banford@mnp.ca     Éric.Grondin@mnp.ca
          519.772.7460                 514.228.7874            418.696.3924               819.823.3290

                                                                Due Diligence Leadership

     Jean-Raymond Lafond            Craig Maloney             Johnny Earl            John Caggianiello
         Managing Director         Managing Director        Managing Director         Managing Director
   Jean-Raymond.Lafond@mnp.ca    Craig.Maloney@mnp.ca      Johnny.Earl@mnp.ca      John.Caggianiello@mnp.ca
           819.473.7251               902.493.5430            604.637.1514                416.513.4177

                                                                                                        MNPCF.ca

                                                                                                              Page 10
You can also read