Metro Manila, Philippines - The case of - University College London
←
→
Page content transcription
If your browser does not render page correctly, please read the page content below

The case of

Metro Manila, Philippines

                                                                                                Source: CIA factbook
by Junio M Ragragio

Contact:
Junio M Ragragio
No. 80 Boston Street, Cubao,
Quezon City, Philipines
Phone: +632 721-8370; +632 411- 5988
Fax. +632 721-8370
E-mail: dpem@info.com.ph

I. INTRODUCTION: THE CITY

A.     THE URBAN CONTEXT
1. National Overview                                         Figure 1: Map of the Philippines
  In 2000 the total population of the Philippines was
76,498,735. The population has increased by 2.36 per
cent annually since 1995. The average population
density at the national level was 260 people per km2
with the National Capital Region (NCR), otherwise
known as Metro Manila having the highest population
density at 15,617 persons per km2. The total land area
of the Philippines is 294,554 km2.
  In the same census year, the national annual average
family income and expenditure were estimated at
PhP144,506        (US$2,890)1      and     PhP119,276
(US$2,385), respectively. The annual per capita poverty
threshold was set at PhP13,916 (US$278). About 34.2
per cent of the total household population or 5.2 million
families live below the poverty threshold. On average,
each household has 5 to 6 members.

2. The Physical City
   Metro Manila has a land area of 636 km2 accounting
for approximately 0.2 per cent of the country’s total land
area. The metropolis is divided into 4 districts with 12
cities and 5 municipalities. The second district is the
largest accounting for about 40 per cent of the total land
area. The first district is the smallest at 6 per cent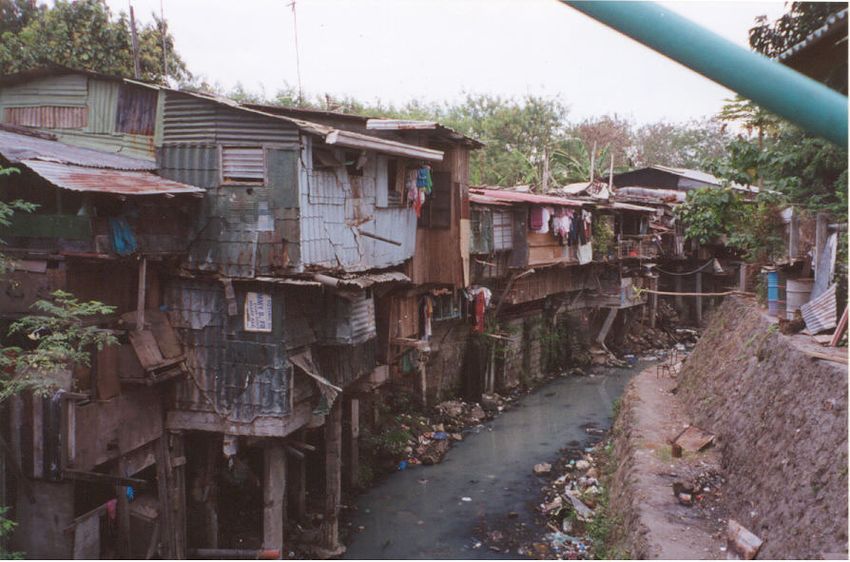
Urban Slums Reports: The case of Manila, Philippines

       comprising only the City of Manila. Among the            the lowest population at 57,407. From 1995 to 2000, it
       cities, the largest is Quezon City with an area of       was estimated that Metro Manila’s annual population
       166.2 km2 while the smallest is Pasig with only 13       growth rate was at 1.1 percent. During the same period,
       km2.                                                     Taguig had the highest growth rate at 4.5 per cent and
          As of December 1996, about 75.8 per cent of           Parañaque posted a negative growth rate of -2.9
       Metro Manila’s land area was certified as alien-         percent. Average household size is 4 to 5 persons.
       able and disposable and 24.2 per cent was                    Nearly half of the families in Metro Manila fall under
       considered to be forested land. This ‘forested           the PhP100,000-249,000 (US$2,000-$4,980) annual
       land’ includes fishponds, established timber-            income class. This translates to roughly PhP20,000
       lands, national parks, and unclassified land.            (US$400) monthly household income. Recent newspa-
                                                                per and television broadcasts report that a family of five
                                                                in Metro Manila would require at least PhP15,000
       3. Demographics                                          (US$300) to meet basic needs.
          In 2000, Metro Manila had a total population of         In 1990, 1.4 million occupied dwelling units were
       9.4 million of which 51.2 per cent are females           located in Metro Manila out of the Philippine total of 9.5
       and 48.7 per cent males. The top three cities in         million (National Statistical Co-ordination Board 2001,
                                                                                        2
       terms of total population are Quezon City, Manila,       Table 1) . Of the total of 11.4 million households, 9.4
       and Kalookan. The Municipality of Pateros has            million live in dwelling units that are owned or being paid
                                                                                       off, 907,051 are rented, 1 million
                                                                                       live in dwelling units occupied for
Table 1. Land Area and Population by City and Municipality, 1975-2000
                                                                                       free with the consent of the owner,
                                                                                       and 30,110 live in dwelling units
       City /      Land Area      2000     1995      1990     1980        1975         which are occupied for free without
   Municipality        (km2)                                                           the consent of the owner. Figures
                                                                                       2 and 3 further illustrates this situa-
First District
                                                                                       tion.
City of Manila                38.3     1,581,082   1,654,761   1,601,234   1,630,485   1,479,116
                                                                                                                                       3
                                                                                                       4. Brief History of Metro Manila
Second District
                                                                                                       Metro Manila evolved from a
Mandaluyong City              26.0      278,474      286,870    248,143     205,366     182,267      small tribal settlement ruled by
Marikina City                 38.9      391,170      357,231    310,227     211,613     168,453
                                                                                                     Rajah Sulayman. It was a thriving
                                                                                                     Muslim Community when the
Pasig City                    13.0      505,058      471,075    397,679     268,570     209,915      Spaniards discovered it about thirty
 Quezon City                 166.2     2,173,831   1,989,419   1,669,776   1,165,865    956,864      years from the time Ferdinand
                                                                                                     Magellan set foot on the islands in
San Juan                      10.4      117,680      124,187    126,854     130,088     122,492
                                                                                                     1521. The Spaniards transferred
Third District                                                                                       the capital from Cebu to Manila,
                                                                                                     and from that time began the 309
Kalookan City                 55.8     1,177,604   1,023,159    763,415     467,816     397,201
                                                                                                     years of Spanish colonisation. In
Malabon                       23.4      338,855      347,484    280,037     191,001     174,878      the same year, the Spaniards
Navotas                         2.6     230,403      229,039    187,479     126,146         97,098   started building Intramuros, the
                                                                                                     Walled City, and made it the seat of
Valenzuela City                 47      485,433      437,165    340,227     212,363     150,605
                                                                                                     the Church and the State.
Fourth District                                                                                        Guarded by Fort Santiago, the
                                                                                                     new city became a Spanish
Las Piñas City                41.5      472,780      413,086    297,102     136,514         81,610
                                                                                                     enclave from where missionaries
Makati City                   29.9      444,867      484,176    453,170     372,631     334,448      and armies were sent out to
Muntinlupa City               46.7      379,310      399,846    278,411     136,679         94,563
                                                                                                     conquer the countryside. While the
                                                                                                     Spaniards kept to themselves in
Paranaque City                38.3      449,811      391,296    308,236     208,552     158,974      Intramuros, the natives, called
 Pasay City                   13.9      354,908      408,610    368,366     287,770     254,999      indios by the conquerors, lived in
                                                                                                     the suburbs, or what are now
  Pateros                     10.4       57,407       55,286     51,409      40,288         32,821
                                                                                                     districts of Tondo, Sta. Cruz,
Taguig                        33.7      467,375      381,350    266,637     134,137         73,702   Quiapo, and Sampaloc. The sang-
                                                                                                     ley or Chinese merchants, lived in
Source: National Statistical Co-ordination Board (2001)                                              the parian, a district which became
                                                                                                     part of the present Binondo. By the
                                                                                                                                            2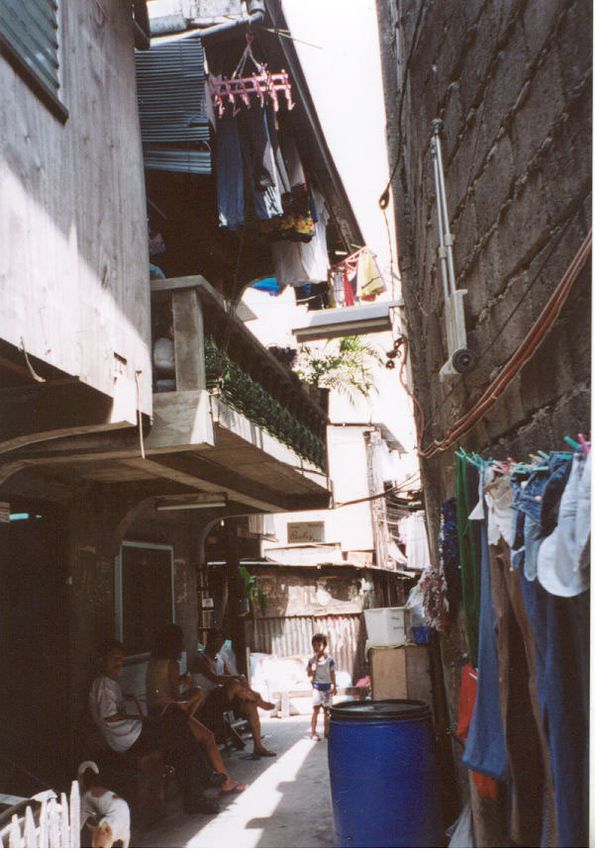
U N D E R S TA N D I N G S L U M S : C a s e St u d i e s f o r t h e G l o b a l R e p o r t o n H u m a n S e t t l e m e n t s 2 0 0 3
late 1800s, Spain had lost control of the Philippines and municipalities was officially designated as the National
with their defeat by the American fleet in the battle of Capital Region (NCR) or Metro Manila, by virtue of
Manila Bay, gave up their hold on the colony altogether. Presidential Decree 921 issued on March 4 of the same
The Philippines then became a colony of the United year. In the last few years, eight municipalities were
States of America for fifty years and was occupied by upgraded into cities in accordance with existing laws. As
Japan for three years during the Second World War. of December 31, 1998, twelve cities and five municipal-
The post-war years saw the reconstruction of Manila ities comprised the metropolis.
and its growth, both in area and population. Virgin lands
in what are now Makati, Mandaluyong, and San Juan
were developed and residential villages emerged in 5. The Urban Economy
Quezon City, Pasig, Pasay, and Parañaque. Factories In Metro Manila, 65 per cent of the total 6.7 million
and industrial areas mushroomed in Kalookan, population over 15 years old are in the labour force.
Malabon, Navotas, and Valenzuela. Most employed persons are engaged in production and
In 1976, an agglomeration of four cities (Manila, related types of work in transport equipment operations
Pasay, Kalookan, and Quezon City) and thirteen (31 percent), services (23.5 percent), and sales (20
percent). Only about 1 per cent are engaged in agricul-
ture and related work. Of the top 50 corporations based
in the country, 41 have major offices in Metro Manila.
Figure 2 Types of Occupied Housing Units in Metro
Makati City had the highest number of corporations (19)
Manila
whose combined gross revenues amount to about
Other Housing
Commercial,
Unit s Institutional Living PhP465 billion (US$9.3 billion) (National Statistical Co-
Industrial,
Agricultural
Quarters ordination Board, 2000, pp 2-7). Figures 5 and 6 illus-
Not Reported
trate the distribution of employed persons by major
Multi-Unit occupation group and by gender/sex.
Residential
According to a barangay survey conducted in 2002 by
the Asian Development Bank under the Metro Manila
4
Urban Services for the Poor Project (MMUSP) average
Duplex unemployment in depressed settlements located in
Sin gle House Metro Manila is nearly 40 per cent. This is more than
three times the Metro Manila average of 10-12 percent
(ADB 1999) and the Philippine average of 11.1 per cent
Figure 3 Number of Households in Occupied Dwelling
Units by type of Occupancy in Metro Manila (NEDA 2001). Approximately 54 per cent of the jobs in
g p g y yp depressed settlements are generated through self-
Occupancy in Metro Manila
employment. The government sector provides only 4.8
Being Occupied
Being Occupied
per cent of the full-time jobs (see Table 2).
for Free With for Free Without
Consent of Consent of The labour force constitutes 665
per cent of the popu-
Owner
Owner
lation in 6depressed settlements . The labour participa-
8% 1%
tion rate is fairly high at 60.2 per cent. However, 50.2
Owned/Being
Rented per cent of the labour force is unemployed, while 49.8
Amortized
30%
61% per cent are either part-time or full-time employed. With
the family size between 5 and 7, this indicates that on
average each household has about 2-3 employed
members.
Only half the population in depressed settlements is
employed in the formal sector. The predominant
Figure 4 Distribution of Household Population by
employment activities in the informal sector are domes-
Income Class in Metro Manila (income in Philippin)
tic help, tricycle driving, construction labour, self-
Figure 3. Distribution of Household Population
by Income Class in Metro Manila (income in PhP)
employment (i.e. handicrafts making), factory labour,
and vending. Domestic help ranks the highest, possibly
250,000 and over 275,936
because many women work in this category while men
100,000-249,000 841,090
473,032
are spread over a number of different livelihoods.
60,000-99,999
40,000-59,999 148,457 The monthly income ranges from PhP2,500 (US$50)
30,000-39,999 18685 to Php9,500 (US$80), with the government employees
20,000-29,999 7528 in the highest bracket. The overall mean monthly
15,000-19,999 0
income is PhP6,125 (US$122.5) per month. SOURCE
Under 15,000 917
The formal sector employment (government, private,
military, factory, shipping) fetches incomes higher than
3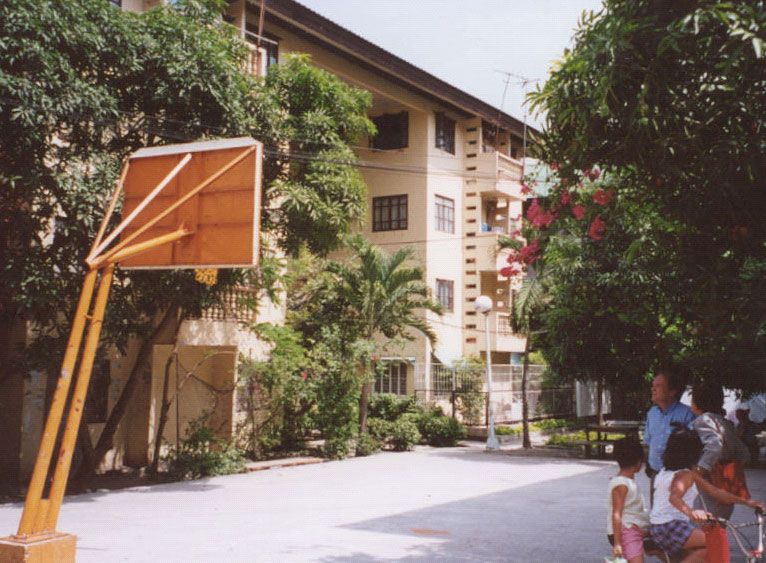
Urban Slums Reports: The case of Manila, Philippines

the overall average. Assuming that there are 2-3                slums and blighted areas, the development of shelter
employed individuals per household, the average                 and housing facilities and the provision of necessary
household monthly income is about PhP12,250                     social services. Most of MMDAs mandates especially
(US$245) to PhP18,375 (US$367.5) (MMUSP Baringay                those involving shelter, solid waste, and sewerage run
survey).                                                        directly into the issues of slums and shelter.
  The average annual household income for Metro                    Based on the data from the Department of Budget
Manila in 1994 was P173,500 (US$3,470) (ADB 1999)               and Management (DBM), the total financial resources
or P14,458 (US$289) per month. NSO recorded the                 under Metro Manila as composed by the LGUs and
mean monthly income of urban poor families in 1997 at           MMDA in 1999 was about PhP28 billion (US$560
P14,846 (US$297) and the median at P9,760 (US$195)              million). The bulk of this comes from revenues consist-
(NSO 2001).                                                     ing of internal revenue allotment (IRA)9, real property
  Wages constitute 81 per cent of total household               taxes, and local taxes.
income. 19 per cent of it comes from non-cash/other                The Local Government Code (LGC) or RA 7160 of
sources or remittances. This closely matches the 1999           1991 devolved governance from the national govern-
National Statistics Office’s Annual Poverty Indicators          ment to LGUs. With the LGC in place, several functions
Survey (APIS) Report, REF which indicates that salary           traditionally undertaken by the national government
and entrepreneurial activities constitute 72 per cent of        were devolved to the local units. Such functions include
the income (MMUSP Baringay survey).
  12 per cent of the households interviewed in the              Table 2: Employment Status in Depressed Settlements
MMUSP survey received non-cash income, and 28 per               in Metro Manila
cent received remittances. The median remittance
recorded was P2,500 (US$50) per month with a                                                          Depressed Settlements
                                                                    Employment Status
                                                                                                        (Av. % Population)
number of families receiving over P20,000 (US$400).
National level data (APIS) indicates a slightly lower
                                                                         Unemployed                           39.4
percentage of wages (71.9 per cent) compared to data
gathered from depressed households in Metro Manila                          Registered                         7.5
which was at 81 per cent.
                                                                           Unregistered                        16

                                                                      Part-time employed                      16.7
6. Governance
                    7

   As of June 30, 1999, there8
                                 are 12 cities, 5 municipal-          Full-time employed                      43.9
ities, and 1,694 barangays in Metro Manila. The cities,
                                                                           Government                          2.7
municipalities, and barangays are governed by their
respective local government units (LGUs). The Local                       Private sector                      15.2
Government Code (LGC) or Republic Act 7160
mandates the LGUs to provide efficient and effective                      Informal sector                     18.6
governance and promote general welfare within their
                                                                          Self employed                        5.0
respective territorial jurisdictions. The LGUs are rela-
tively autonomous.                                                            Other                            1.2
   The Metropolitan Manila Development Authority or
                                                                Source: ADB-MMUSP Barangay Survey
MMDA was created and mandated by Republic Act
7924 to ensure effective delivery of Metro-wide serv-           Table 3: Distribution of Employment Status by Total
ices. Their major mandates or functions are as follows:
      Development Planning
     Transport and Traffic Management                              Employment                % Total
                                                                                                             % Labour Force
                                                                     Status                 Population
     Solid Waste Disposal and Management
     Flood Control and Sewerage Management
                                                                 Full time employed            15.7                  23.7
     Urban Renewal, Zoning, Land Use Planning and
     Shelter Services
                                                                 Part time employed            13.7                  20.8
     Health and Sanitation, Urban Protection, and
     Pollution Control                                             Self employed               3.4                   5.2

   The MMDA’s mandate includes the adoption and                     Unemployed                 33.2                  50.2
implementation of policies, standards, rules and regula-
tions, programmes and projects to rationalise and opti-          Not applicable (not
                                                                                               34.0                   -
                                                                   working age)
mise land use and provide direction to urban growth
and expansion, the rehabilitation and development of             Source: ADB-MMUSP Barangay Survey

                                                                                                                              4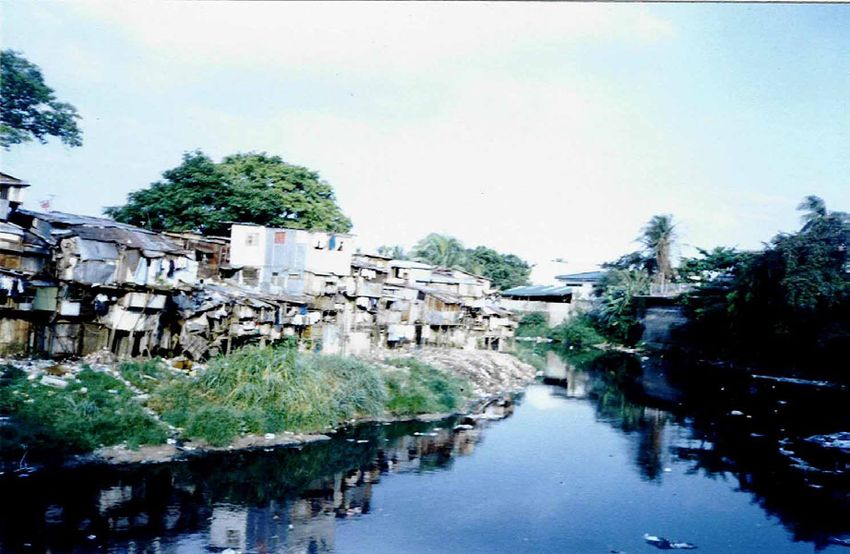
U N D E R S TA N D I N G S L U M S : C a s e St u d i e s f o r t h e G l o b a l R e p o r t o n H u m a n S e t t l e m e n t s 2 0 0 3
but are not limited to the provision of basic health serv- sations (NGOs) and people’s organisations (POs) in the
ices, land use planning, environmental management, planning, implementation and monitoring of LGU-led
agricultural development, and livelihood support devel- projects relatively increased. The LGC prescribed the
opment. formation of Local Development Councils (LDCs) or
With the increased decentralisation brought about by special bodies to serve as venues for representation of
the Code, the participation of non-government organi- communities, through their organisations,
10
to express
their views on issues affecting them . These issues
involve a wide array of concerns and include shelter and
Figure 5 Employed Persons by Major Occupation Group by Sex
poverty.
Prod uct ion a nd relat ed workers, Tra nspo rt w orkers
Agricu lt ural, Animal h usba ndry, a nd Forest ry w orkers
Service worker
II. SLUMS AND POVERTY
Sales worker
Clerical and relate d w orkers ` B. DIFFERENT TYPES OF SLUMS IN
Administrat ive, Execut ive, and Mana gerial workers THE CITY
Professional, Techn ica l, and relate d w orkers
0% 20% 40% 60% 80% 100% Slums can be found in 526 communities, located in all
the cities and municipalities of Metro Manila. They
account for some 2.54 million men, women and children
Male Female living in the most depressed areas of the country’s prime
metropolis. These slum communities are located on
vacant lands that are both private and government
Figure 6: Unemployed Persons by Sex in Metro Manila
owned. Usually they are located along rivers and
creeks, in garbage dumps, along railroad tracks, under
900,000 bridges, and beside factories and other industrial estab-
800,000
700,000
lishments. Slums located next to mansions in affluent
600,000 residential areas are not uncommon. Although there are
500,000 Male relatively large slum communities, the settlement pattern
400,000 Female of the Metro Manila urban poor is generally dispersed,
300,000
200,000 with houses located wherever there is space and oppor-
100,000 tunity. Metro Manila’s slums cannot be geographically
- defined the way ghettos can be clearly segregated in
some countries. In terms of building materials used,
89
90
91
93
94
95
97
98
92
96
99
00
19
19
19
19
19
19
19
19
19
19
19
20
slum housing can be broadly categorised as a) tempo-
rary shelters made of salvaged materials b) semi-
permanent shelters and c) permanent shelters.
Table 4: Comparison of the Results of the APISa and the Photographs 6 to 8 illustrate this. The following pictures
b
MMUSP Surveys
illustrate the slums that can be found in Metro Manila.
Based on APIS, NSO
Data available on slums are currently measured in terms
Based on the MMUSP Household Survey
National Level Data of the number of informal settlers (see Table 5), as
derived from surveys conducted by the Housing and
Mean
Income Source
% of Income % of % HHs Median
(P/mo) Urban Development Co-ordination Council.
Income Source Income with (P/mo)
Salary 47.4% Total 16,900 23,401
Entrepreneurial
24.5% Wages 81% 95% 15,800 20,852
Activity
Net share of
0.7% Non-cash 2% 11.8% 1,157 2,105
crops, etc.
Family
1.3% Remittance 7% 27.9% 2,500 9,072
Sustenance
Other Sources 26.2% Other 10% 35.3% 1,984 2,708
Source: an Annual Poverty Indicators Surveyb Metro Manila Urban
Services for the Poor
5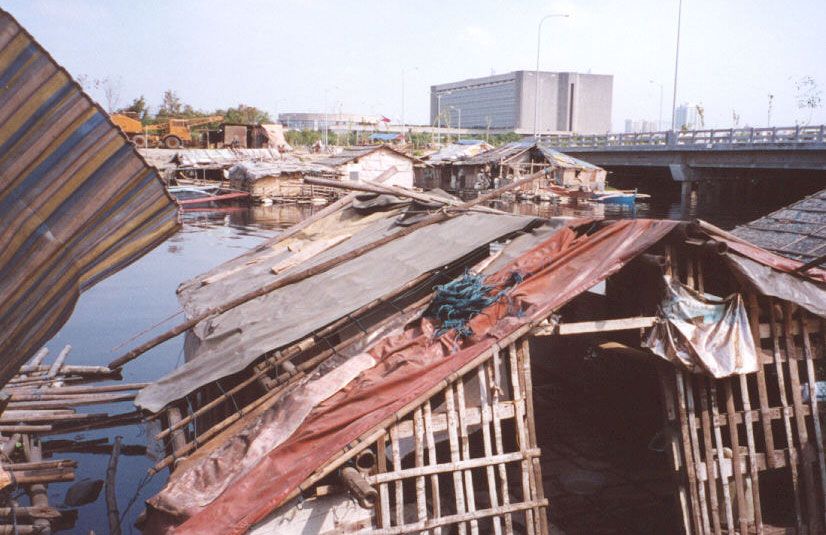
Urban Slums Reports: The case of Manila, Philippines

C.     OFFICIAL DEFINITIONS OF
       SLUMS USED FOR POLICY
       PURPOSES
    The Housing and Urban Development Co-ordinating
Council (HUDCC) defines slum as buildings or areas
that are deteriorated, hazardous, unsanitary or lacking
in standard conveniences. They were also defined as
the squalid, crowded or unsanitary conditions under
which people live, irrespective of the physical state of
the building or area. Under such a set of definitions,
slum dwellers are identified as the urban poor, individu-
als or families residing in urban and urbanisable areas         Photo 1 : Slum community next to a major river in
whose income or combined household income fall                  Quezon City. Note the factory in the background.
below the poverty threshold11.
    While it is clear that the government accepts the exis-
tence of slums, data gathering and programmes have
focused more on the provision of shelter or dwelling
units and relocation projects than on slum upgrading.
    More than the slums, the government has regarded
illegal occupants as a major problem in urban manage-
ment. These illegal occupants, defined by HUDCC as
those who settle on someone else’s land without title or
rights whether in urban or rural areas, are better
referred to in the urban setting as squatters, both as a
legal definition and as an informal term.
    Presidential Decree 772, promulgated in 1975 crimi-          Photo 2 : Slum community next to a creek in Quezon
nalised squatting and gave birth to an official definition       City
for another breed of illegal occupants – professional
squatters. Professional squatters are understood to be
individuals or groups who occupy lands without the
expressed consent of the landowner and who have
sufficient income for access to legitimate housing. The
term also applies to people who have been previously
awarded lots or housing units by the government but
who sold, leased or transferred them and settled ille-
gally in the same place or in another urban area as non-
bona fide occupants and intruders on land set aside for
social housing. The term does not apply to individuals or
groups who simply rent land and housing from profes-
sional squatting syndicates. Professional squatting
syndicates are the informal and illegal organisations          Photo 4 : Slum community next to a railroad track in
                                                               Manila City.

              Photo 3 : Slum community next to a
              major river in Pasay City.
                                                                                                                      Source ADB-MMUSP interim report.

              Note the bridge in the background.

                                                                                                                                                     6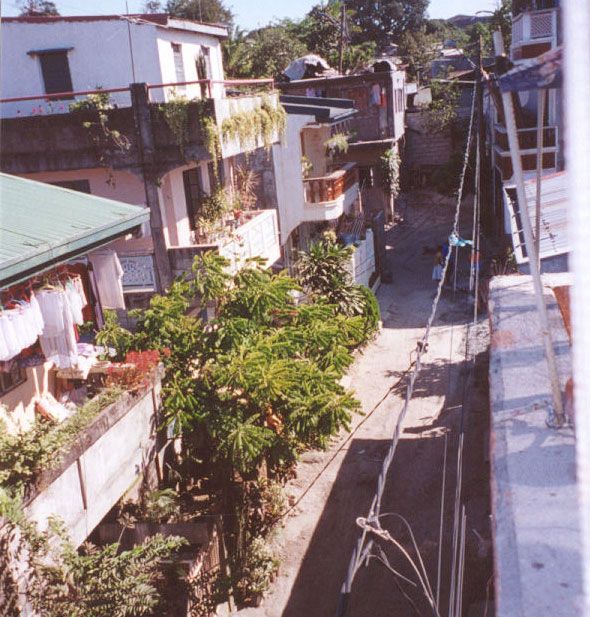
U N D E R S TA N D I N G S L U M S : C a s e St u d i e s f o r t h e G l o b a l R e p o r t o n H u m a n S e t t l e m e n t s 2 0 0 3

    covertly co-ordinating the activities of professional                       eskinita (refers to alleys that hold only one person at
    squatters.                                                              a time);
      The 22-year old Presidential Decree 772 enacted by                        looban (meaning inner areas where houses are built
    former President Ferdinand E. Marcos branded squat-                     so close to each other and often in a manner not visible
    ters as criminals and effectively condemned an esti-                    to the general view of the city); or
    mated 10 million urban poor Filipinos who cannot afford                    dagat-dagatan (for areas that are frequently flooded).
    legal housing. The decree has been used in some
    cases as a basis for the criminal conviction of squat-                     While there is an acceptance that squatting is illegal,
    ters. With the continued implementation of the decree                   slum dwellers perceive themselves as legal citizens
    about 100,000 families were evicted yearly from 1986                    awaiting government action for housing provisionxii.
    to 1991 alone (UN Committee on Economic, Social and                     This is due to the fact that election bandwagons have
    Cultural Rights). In 1997, PD 772 was repealed under                    consistently made promises of addressing these needs.
    the administration of then President Fidel V. Ramos.                    It cannot be denied that the length of period of stay in
                                                                            the area13 and the improvements made by these resi-
                                                                            dents raise a question of land stakeholdership.

    D.        UNOFFICIAL DEFINITIONS OF
              SLUMS
                                                                             E.        THE OFFICIAL DEFINITION OF
      The term “slums” has no direct equivalent in the local                           POVERTY
    language. They are normally referred to in terms of
    descriptive words, such as:                                                Since policy goals are set in terms of well-being, a
                                                                            broad proxy indicator for well being is required since it
        iskwater (Tagalog version of squatter referring to a                is not in practice readily available (Balisacan 1999). In
    physically disorganised collection of shelters made of                  most countries, poverty is understood to be the mini-
    light and often visually unappealing materials where                    mum income necessary to purchase a basic calorie
    poor people reside)                                                     intake, measured in terms of income and expenditure
        estero (narrower than sewers and associated with                    (ABD 1999). Although total current income has become
    bad smell);                                                             a popular choice, the operational difficulty in acquiring

    Photos 5, 6, 7

       The general types of
     housing in the slum
     areas can be broadly
     categorized in terms of
     the construction mate-
     rials used namely
     salvage materials
     (upper left photo),
     semi-permanent mate-
     rials (left), and
     strong/permanent
     materials (above).
     (Source: ADB-MMUSP
     Interim Report)ritULL
     REF??

7
Urban Slums Reports: The case of Manila, Philippines

accurate information is more severe for current income           Philippines, the ADB definition has been the accepted
than for current consumption (Ravallon and Chen,                 one, guiding several other poverty reduction
1997).                                                           programme implementers.
   In 1994, President Ramos launched the Social
Reform Agenda (SRA) in which various social sectors
converged and agreed to consider a set of services.               F.     UNOFFICIAL DEFINITIONS OF
These services are known as the Minimum Basic Needs                      POVERTY
(MBN), and are probably the closest indicators ever
established to capture poverty beyond income and                    From the perspective of planners, particularly econo-
expenditure. The MBN define poverty in terms of a                mists, the poor are defined as individuals living in
three-tier needs hierarchy: survival (food/nutrition,            households with per capita expenditures below the
health, water/sanitation, and clothing); security (shelter,      poverty threshold. They are further classified as ultra
peace, income, and employment); and enabling (basic              poor, near ultra poor, and marginal poor. The ultra poor
education/literacy, people’s participation, family care,         are individuals whose household per capita expenditure
and psycho-social indicators) (ABD 1999).                        is below food subsistence thresholds. Near ultra poor
   Administrative Order 194, which gave way to the SRA           are those with household per capita expenditure is at
implementation, expressed its objective as the eradica-          least equal to subsistence thresholds but below the
tion of absolute poverty, the reduction of relative              median of subsistence and poverty thresholds. The
poverty, and fast track growth and development in the            marginal poor are individuals with household per capita
20 provinces identified as being the poorest14. Absolute         expenditures that are at least equal to the median of the
poverty refers to incomes below the food threshold               subsistence and poverty threshold (UP Economics,
levels (Monsod and Monsod 1999).                                 2000).
   In 1999, the Asian Development Bank (ADB) defined
poverty as “a deprivation of essential assets and oppor-
tunities to which every human is entitled”. While admit-          G.     THE ORIGINS OF THE TYPES OF
ting that in practice the most broadly used standard for                 SLUMS IDENTIFIED
measuring poverty will continue to be the adequate
consumption of food and other essentials, ADB stressed             Respondents of the ADB MMUSP Barangay Survey
that their priority will be absolute poverty (ADB 1999).         reported that, on average, three quarters of the house-
   As an active policy programme implementer in the              holds in the depressed settlements covered are long-
                                                                 term (more than five years) residents of the area. The
                                                                 settlements average 19.2 years in age, and often are 40
                                                                 years old or more. The majority of the households
                                                                 migrated to these areas from other cities within the
Photograph 8, 9, 10, 11
                                                                 Metro or other areas within the city. The survey indi-
                                                                 cated that the majority of the urban poor households
                                                                 have been living in Metro Manila for nearly two
                                                                 decades.

                                                                 H.      DATA ON THE CITY’S SLUMS
                                                                 1. Maps
                                                                    The following map illustrates the distribution of the
                                                                 household population of informal settlers in the different
                                                                 cities and municipalities of Metro Manila.
                                           These images
                                           illustrate a typi-
                                                                 2. Census Data15
                                           cal household in        Over a third of Metro Manila’s population lives in
                                           depressed
                                           settlements or        depressed areas. Quezon City and Manila are home to
                                           slum areas. Four      Metro Manila’s 35 per cent of urban poor households.
                                           families (with an
                                           average of five       Pasay City has 70 per cent of its population living in
                                           members each)         depressed areas. Table 5 presents the number of infor-
                                           live in the exam-
                                                                 mal settlers in each of City/Municipality.
                                           ple presented.

                                                                                                                              8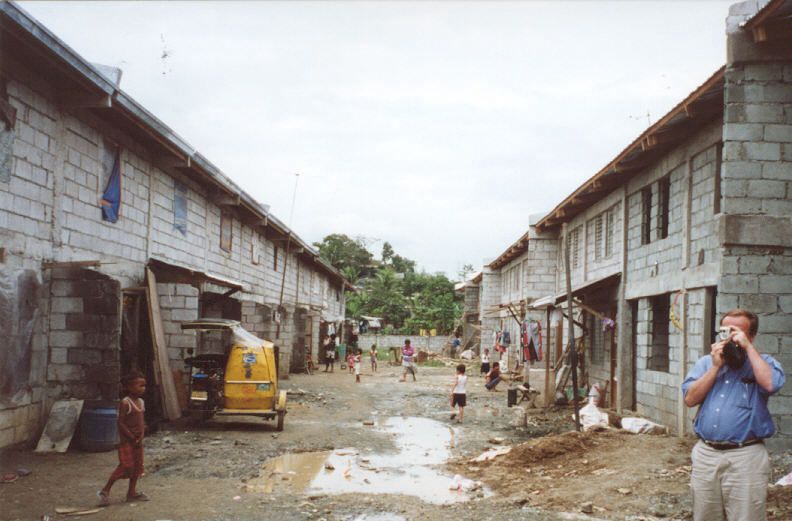
U N D E R S TA N D I N G S L U M S : C a s e St u d i e s f o r t h e G l o b a l R e p o r t o n H u m a n S e t t l e m e n t s 2 0 0 3

     I.       DATA ON POVERTY IN THE CITY                                     Her younger sister sells toys. Her income provides
                                                                            their daily food. A typical breakfast and lunch for
    1. Census Data                                                          Marilyn’s household consists of one kilo of rice and half
      See Table 6                                                           a kilo of fish. They have to set aside a portion for lunch.
                                                                            For dinner, they have to wait for her sister until 9 in the
                                                                            evening, and only then are they able to buy food for the
    III. SLUMS: THE PEOPLE                                                  entire household.

    J.         WHO LIVES IN SLUMS?                                                Magdalena Umenga is 52 years old. She has been
                                                                            living in the area since her birth. She occupies a small
    1. Short Histories and Key Events in the                                room in a two-storey structure built by her parents. Two
      Lives of Typical Slum Households,                                     of her sisters and their respective families share the
      Including Female-Headed Households                                    house with her.

       The following section presents the highlights of inter-
    views carried out in May 2002 with persons living in                    Table 5. Number of Informal Settlers in Metro Manila by
    depressed areas in Metro Manila. Rather than indicating                 City and Municipality, 2002
    a trend or generalisation, the anecdotes illustrate the
    lives of typical slum dwellers.                                                                      Total              Number of
                                                                             City/Municipality                                                   % of Total
                                                                                                      Households          Depressed HHs

       1.1 Sampaloc Railroad Track, Manila City. The                         City of Manila              333,547                 99,549             29.8
    Philippine National Railways (PNR), has a train route                     Mandaluyong                 59,682                 25,383             42.5
    from Manila City to Bicol. The company owns the land                      Marikina City               80,160                 28,580             35.6
    along the railroad.
                                                                                Pasig City               107,835                 27,328             25.2

                                                                               Quezon City               480,624                 169,490            35.2
         Marilyn Soriano, 41 years old, was born and contin-
    ues to live in a 9 m2 room along the PNR track. The                       Kalookan City              249,567                 67,292             26.9

    room was built by her deceased parents. She is a single                      Malabon                  74,137                 12,461             16.8
    parent with two children and shares the room with her                         Navotas                 49,450                 19,030             38.4
    younger sister and seven other nieces.                                   Valenzuela City             106,382                 36,404             34.2
      Marilyn stopped selling fish when her meagre capital
                                                                              Las Piñas City              97,962                 36,107             36.8
    was drained by spending on food and other basic
                                                                                Makati City               98,225                 27,024             27.5
    necessities. Currently, she earns PhP200 (US$4) per
    day for doing laundry. This is often insufficient. Being an              Muntinlupa City              78,016                 40,457             51.8
    active member of the church, she derives support from                     Parañaque City              94,106                 29,790             31.6
    food donations.                                                             Pasay City                78,180                 57,436             73.4

                                                                                  Pateros                 12,029                  3,502             29.1

                                                                                   Taguig                102,723                 21,931             21.3

                                                                             Source: HUDCC unpublished report, 2002

                                                   67,212                    Table 6. Annual Per Capita Poverty Thresholds and
            36,404
            households of
                                                   households of            Incidences of Families in Metro Manila, 1991-2000
      19,030                                          169,490
      households of                                   households of
                                                                                                           1991           1994            1997       2000
     12,461                                              28,580
     households of                                       households of
                                                                             Annual Per Capitaa           9,286         11,230         14,299       18,001
       99,549                                                                Threshold (PhP)            (US$186)       (US$225)       (US$286)     (US$360)
                                                         25,383
       households of                                     households of
                                                                              Number of Poor                                                       211,559
          27,024                                                                                         217,602        141,671      127,873
                                                     27,328                     Families b
          households of
                                                     households of
           57,436                                                            Incidence of Poor
           households of                                                                                   13.2            8.0             6.4        9.7
                                                                               Families (%) c
                                                 21,931households
            29,790                               of informal settlers
            households of                                                   Source: 2001 Philippine Statistical Yearbook, NSCB
                                                                            a. The annual per capita income required or the amount to be spent to satisfy nutri-
           36,107                               40,457                      tional requirements and other basic needs
           households of                        households of
                                                                            b. The number of families whose annual per capita income falls below the annual
                                                                            per capita threshold

                                                                            c. The proportion of poor families to the total number of families

9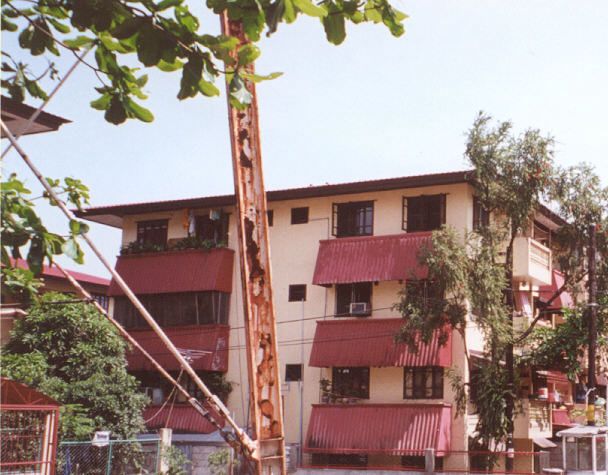
Urban Slums Reports: The case of Manila, Philippines

      Baby Santos is a 58-year old widow who lived in           also serves as dining room and two bedrooms for his
the area all her life, at the back of a church which is a       family and two nieces who help take care of the chil-
stone’s throw away from the railroad track. She raised          dren. He earns PhP8,000 (US$160) a month while his
her children selling fish. Her three daughters are now          wife, a public school teacher earns the same amount.
married and living with their respective husbands. She          With four children, their salaries are not enough to
is currently jobless with a 10-year old daughter who            sustain their daily needs and loan payments (e.g. hospi-
lives with her after being maltreated by the stepfather.        tal bills when their children are sick, tuition fees, etc).
   Trains pass their houses almost every hour starting in          His one-month old child just recently spent a week in
the early morning and continuing until late in the              a private hospital incurring bills of almost PhP20,000
evening. Their area is not only noisy; it is also a haven       (US$400). A large part of this was paid for through loans
of drug pushers and users, and other criminals.                 from friends and family. When asked why he did not
                                                                send his child to a public hospital to lessen his
  1.2 Batasan Hills, Quezon City. The land is owned             expenses, he said the facilities and the services are
by the national government.                                     usually insufficient in a public hospital. He added he
                                                                doesn’t want to endanger the life of his child.
      Narciso Mendoza is a 51 year old living in a squat-          According to him, even if they have no loans, they
ter colony since 1980. He acquired land from his sister         would hardly cope with expenses. This coming school
who was able to buy the rights to a comparatively large         year, he intends to enrol his two children in a private
parcel of land. He incrementally improved his house             school which means he will need at least PhP12,000
from a temporary shelter to a concrete structure. His           (US$240) for tuition alone plus at least PhP3,000
house now has two rooms, a kitchen, a dining room, and          (US$60) for the uniforms, books, and other school
a living room. He shares the house with his wife and his        supplies of the children.
daughter’s family of four. His two other daughters are             Jojo Mendoza plans to establish a computer shop.
also married and have their own houses in the vicinity.         However, the loan he was expecting from an NGO has
   Narciso has no regular work. He only finished                not yet been approved due to the diminishing funds of
seventh grade and works as a seasonal carpenter. His            the organisation. He does not want to get capital from
son-in-law works as an electrician and helps in their           other institutions such as banks and private individuals.
daily food and other expenses. Their household lives a          He stated that bank loans have very high interest rates
simple life. However, he ensures that his family eats           ranging from 16 per cent to 24 per cent per month. A
three meals a day.                                              micro-business, he said, will help sustain his family’s
   His wife, 59 years old worked as a nursing aid for 13        every day needs.
years until the clinic where she worked closed. She is             Since the respondents do not own the land where
supposed to receive a pension, worth around PhP2,000            their houses are constructed, the threat of demolition is
(US$40) a month, when she reaches 60 years old.                 constant. Demolitions are often violent.
Narciso says he is fortunate that he doesn’t have to rent          The residents along the railroad track in Sampaloc,
a house for his family. However, they constantly feel           Manila City are aware of the PNR’s plan to expand their
threatened by demolition as the government is reviving          tracks, in the process demolishing the houses along
its plans to establish government offices in the area.          them. In response, the residents are organising their
                                                                ranks to ask the PNR management to leave them where
      Jaime Linero, 27 years old, was born in the area.         they are. Most of the residents prefer to stay in the area
Together with his family, he lives in a small house his         since it is near a market, a church, schools, public
parents used to lease to other families. It has a living        hospitals, and public transport. Relocation areas often
room, kitchen, and a loft that serves as their bedroom.         lack services such as water and electricity. The respon-
   Jaime completed first year in college while his wife is a    dents are concerned that their economic activities will
high school graduate. They have a daughter and his wife         be severely affected with relocation to far-flung areas.
is seven months pregnant. He is the sole breadwinner,              Similarly, the government intends to push its plans to
working as a waiter in a restaurant in Quezon City. He          establish offices of various government agencies in
earns PhP6,000 (US$120) a month. He can barely make             Batasan Hills. A blueprint for the development of the
ends meet with his salary. While he ensures that his            area is already in existence and awaiting funds. Narciso
family has three meals a day and affords other necessary        is worried that once the government generates enough
expenses to sustain their basic needs, he laments that          funds for the project, the demolition of houses will be
the expenses are rising and he can barely cope with it.         initiated.
He hopes to work abroad so he can support his family.              Almost all of the respondents have lived in their
                                                                respective areas throughout their lives. However, they
       Jojo Mendez, a 35-year old NGO worker who                cannot claim ownership of the land. In the absence of
finished college with an engineering degree. He                 viable options, the constant threat of demolition and
constructed his house in 1997. It has a living room that        eviction has become part of daily living.
                                                                                                                              10
U N D E R S TA N D I N G S L U M S : C a s e St u d i e s f o r t h e G l o b a l R e p o r t o n H u m a n S e t t l e m e n t s 2 0 0 3
K. HOUSEHOLD INDICATORS As a percentage of income, this translates into a wide
range: from 0.6 per cent by military personnel to 25.44
Households in depressed areas are composed of per cent by domestic helpers. The latter is very high
nuclear families with an average household size of five compared to the mean of 12.5 percent, and may be
and extended families with an average household size attributed largely to the extremely low income of domes-
of nine. According to the respondents, more than half of tic helpers.
households in their 16
respective areas consist of
extended families . In the same interviews, it was
reported by the respondents that families in depressed Table 8. Monthly Household Expenditure (US$/month)
areas have lived in their localities for 15 to 20 years,
most households now being “owned” by second and Mean Median
third generation family members. The dwelling units had
Food 133.38 120
between 12 and 20 m2 of usable space with minimal or
no perimeter space. Housing 11.3 0
In Metro Manila, the birth rate in 1997 was reported at
Health 13.32 4.5
5.3, the fertility rate was 2.23 , and life expectancy for
females was 66.7 and for males 71.5. In 1994, 98 per Education 36 16.27
cent of the population ten years old and over had simple Recreation 8.12 2
literacy and 90.6 per cent was functionally literate.
Transport 20.46 9.8
Others 20.27 8.16
Loan payments 22.76 3
L. THE COSTS OF LIVING IN
SLUMS12 Utilities 33.22 27.75
Households in depressed settlements spend the bulk
of their income on food (45 percent)13 followed by next
highest expense on utilities14 and education that take up Table 9. Monthly Expenditure of Urban Household
10 and 6 per cent of income respectively. Expenditure
% Total Expenditure in
on housing is minimal. Urban poor households also
Expenditure US$
save, on average, 28 percent of their monthly incomes.
As a percentage of median monthly expenditure, Food 62.2 14
urban poor households spend 63 per cent, or PhP6,000
(US$120) on food (see Table 8). Transportation 13.6 3
Housing expenses primarily involve mortgages or
Electricity 4.7 1
rents but “squatters” typically spend nothing on a regu-
lar basis on housing. However, most squatters incur Schooling 4.1 .9
initial housing costs to pay for “land rights” and to build
Water 3.7 .8
their house.
A study of urban poor households conducted by Fuel 2.8 .6
Michael Alba in 1996 provides data on expenditures of
urban poor households (see Table 9). The net expendi- Health 2.0 .45
ture is low but the percentages of expenditure on vari-
Clothing 1.9 .44
ous items are consistent with recent surveys.
Households residing in more depressed zones have Rent 1.5 .33
different characteristics from the general squatter popu-
lation. Their household monthly incomes are lower than Household Goods 1.4 .30
the overall average, the median being less than half of
Recreation 1.3 .29
the overall corresponding value for depressed settle-
ments. As a result, even though their median expendi- Telephone 0.2 .15
ture on food is PhP5,850 (US$117) (less than the corre-
sponding overall value for squatters), this translates into Other Items 0.7
77 per cent of their total monthly expenditure.
Household Expenditure 22.7
Expenditure on housing15 per month varies by liveli- Household Income 29
hood, ranging from PhP53 (US$1) to PhP1,072
(US$21.44), the average being 12.5 per cent of income. Source: A Place To Call Home by Michael Alba, 1996
11Urban Slums Reports: The case of Manila, Philippines
M. ASSETS AVAILABLE TO SLUM programme, and therefore increases the number 16
of
DWELLERS modes of land acquisition offered under PD 1517 .
The Zonal Improvement Program (ZIP) is a commu-
The national average asset ownership, as recorded nity upgrading scheme whereby the government expro-
by the APIS, indicates that televisions are owned by 56 priates the land and resells it to the residents after
per cent of poor households and refrigerators by 37 per developing the site and introducing basic services and
cent. Other assets such as stereos, washing machines, facilities into the area (1984).
and other home appliances are observable in Since the UDHA is a very demanding policy, the
depressed areas. According to the same report, national government established a viable home financing
average income from salary and entrepreneurial activi- system, through the revival of home financing institu-
ties adds up to 72 per cent of total income. The follow- tions such as the National Home Mortgage Finance
ing table illustrates this further. Median asset value is Corporation (NHMFC), the Home Insurance Guaranty
approximately PhP53,400 (US$1,068). Corporation (HIGC), and the Home Development
Depressed households have average savings rang- Mutual Fund (HDMF) or Pag-IBIG. Funding for long-
ing from -2 to 18 per cent of monthly household income. term mortgages which would be affordable even to
On average only 57 per cent of depressed households those below the poverty line had to be sourced from
have access to formal sector loans with less than a insurance funds administered by the Social Security
quarter borrowing for housing needs. Most loans are for System (SSS), the Government Service and Insurance
establishing income-generating projects or for basic System (GSIS), and Pag-IBIG.
needs such as food, medicine, and education. The The Unified Home Lending Program (UHLP) was
mean household loan is estimated at PhP17,760 launched in 1987 with two innovations: focus on lower
(US$355.5) and the median PhP6,200 (US$124). income groups and full cost recovery. Restructuring of
Households access loans from government and government apparatus began in 1986 before UHLP was
private sector institutions, micro-credit associations, implemented. Executive Order 90 created the Housing
family and friends, as well as local moneylenders or and Urban Development Co-ordinating Council
“loan sharks”. Local money lenders charge extremely (HUDCC), which adapts the National Shelter Program
high rates, up to 20 per cent per day. (NSP), and streamlines the administrative structure.
Eventually, the same set-up was followed by the admin-
istration of Fidel Ramos.
Key housing agencies are now limited to the NHMFC,
N. SLUMS AND POVERTY: HIGC, the National Housing Authority (NHA) and the
THE POLICIES Housing and Land Use Regulatory Board (HLURB).
These agencies are linked to funding sources—SSS,
1. Policies and Actions Taken to Improve GSIS, and Pag-IBIG.
Slums and Alleviate Poverty Significantly, the Community Mortgage Program
(CMP), launched in 1987, was institutionalised under
1.1 Locational Targeting the UDHA and given a five-year, PhP12.7 billion
The bill of rights Philippine Constitution of 1987 grants (US$254 million) budgetary support by the
all citizens the right of access to affordable housing. Comprehensive and Integrated Shelter and Finance Act
Under the law, different modes of land acquisition are (RA 7835) of 1994. The CMP encourages the formation
open to the urban poor through various government of community associations (CAs) as a requirement for
programmes. accessing loans. It allows incremental site development
During the Marcos regime, Presidential Decree 1517 which means the loan amount can be held to a mini-
proclaimed urban land reform in the country and gave Table 10. Major Sources of Income
birth to five modes of land acquisition: land exchange,
joint venture, land consolidation or readjustment, land Income Source % of Income
banking and expropriation. It prescribed sale, lease,
exchange, neighbourhood ownership, residential free- Salary 47.4
hold, and tenure improvement as some of ways by
which land could be disposed to beneficiaries. Entrepreneurial activity 24.5
Corazon Aquino’s administration enacted a housing
Net share of crops 0.7
policy in 1986 that gave the government the role of
“enabler” and “facilitator”, and recognised the primacy of Family sustenance 1.3
the private sector in housing development. The Urban
Development and Housing Act (UDHA) or RA 7279 was Other sources 26.2
passed under this government. It provides for a compre-
Source: National Statistics Office National Level Data
hensive and integrated urban development and housing
12U N D E R S TA N D I N G S L U M S : C a s e St u d i e s f o r t h e G l o b a l R e p o r t o n H u m a n S e t t l e m e n t s 2 0 0 3
mum. The loans are accessed through the NHMFC and strategy’s framework for poverty reduction. These are (i)
may be used for the purchase of land, improvement of pro-poor sustainable growth, (ii) social development,
basic services, and/or construction of housing. and (iii) good governance. The Pasig River
The CMP has been hailed as an innovative land Environmental Management and Rehabilitation Project
acquisition program even as it faces administrative is a technical assistance programme that aims to revi-
problems such as the large number of applicants and talise and redevelop the areas along Pasig River and its
poor collection performance. tributaries under a comprehensive urban renewal
In the same way as NHMFC acts as a conduit under programme.
the Community Mortgage Program, the Land Tenure ADB also conducted a study entitled, “Institutional
and Assistance Program (LTAP), uses the National Strengthening of the Housing and Urban Development
Housing Authority as a conduit between the CA and the Sector”, which defined the role of the Department of
financing institutions offering subsidised funds for land Housing and Urban Development (DHUD) in policy and
acquisition. plan formulation, and in the over-all management of the
A popular programme for low-income families residing urban development process.
in high-density urban areas in Metro Manila is the As a joint undertaking with Australian Agency for
Medium Rise and Public Housing Program. This International Development (AusAID), the World Bank
programme is undertaken by the NHA with a trust fund (WB) has made a fifteen to twenty-year commitment
that is administered and controlled through an effective through the Land Administration and Management
instrument recovery scheme. The LGU assumes minimal Program (LAMP). The programme, currently piloting
participation through administration and maintenance. projects in five barangays in Quezon City, seeks to
The Group Land Acquisition and Development improve land titling, land records management, land
(GLAD) Program tasks the Home Development Mutual valuation, land laws and institutional structure.
Fund (HDMF) in a similar scheme to the CMP but with-
out the involvement of an external originator or devel- 1.2 Socio-Economic Targeting
oper. In this programme, potential beneficiaries are The Social Reform and Poverty Alleviation Act (RA
required to be HDMF members. 8425), passed by the Philippine Congress in 1997,
The LGC, UDHA, and the CISFA have all mandated created the National Anti-Poverty Commission (NAPC)
the LGUs responsibilities over the needs of the commu- as a co-ordinating body in poverty reduction. Its princi-
nities under their jurisdiction, among others, responsibil- pal objective is to “adapt an area-based sectoral and
ity in housing provision, and particularly in housing for focused intervention to poverty alleviation wherein
low-income groups. As a result, the LGUs have become every poor Filipino family shall be empowered to meet
the primary institutions involved with the provision of its minimum basic needs of health, food and nutrition,
basic services including social housing programmes for water and environmental security, shelter and decent
the poor and resettlement of informal settlers in their housing, peace and order, education and functional
localities. The LGUs have also been tasked to secure literacy, participation in governance, and family care and
public areas, including danger zones, from squatting. psycho-social integrity”.
Some LGUs have their separate programmes for It reports that as of February 2002, some 78,423
addressing the problem of land access and housing. housing units have been provided for workers and the
Many have also created units prioritising concerns of urban poor. Of these, 5,192 units are in Metro Manila
the urban poor, including housing and site development under the Community Mortgage Program (CMP) and
(e.g. Urban Poor Affairs Offices, Local Housing Boards, 9,206 units under NHA’s slum upgrading, medium rise
Local Shelter Offices). housing and land tenure program; 714 barangays have
Donor agencies have also extended technical assis- been provided with electricity, and 201,104 urban poor
tance in many forms. As a member country of the Asian families enrolled in the national health insurance
Development Bank (ADB), the government has programme (MMUSP 2000).
accessed loans, technical assistance, and policy advice In 1999, under the General Appropriations Act, the
relevant to slum improvement and poverty alleviation. Government allocated PhP2.5 billion (US$50 million) for
Two remarkable policy frameworks introduced by the the “Lingap Para sa Mahihirap” Fund to be used exclu-
ADB are: Urban Sector Strategy (July 1999) and the sively to satisfy the minimum basic needs of poor
Poverty Reduction Strategy (September 1999). The communities and disadvantaged sectors.
ADB Urban Sector Strategy prescribed a national strat-
egy in housing the poor through improving access to 1.3 Civil Society Initiatives
land and shelter rather than direct housing interven- Civil society groups have also undertaken several
tions. It made note of significant contributions of initiatives. The cases noted below are some of the docu-
genuine involvement of communities, the private sector mented NGO and PO efforts at maximising government
and LGUs. The Poverty Reduction Strategy, on the land acquisition schemes (Aberia 1997).
other hand, identifies key elements that are part of the
13Urban Slums Reports: The case of Manila, Philippines
Barangay Tanyag Homeowners Association Inc. Pantambayayong Foundation (PFI), and the Gregorio
(BATAHAI) Araneta Foundation (GASDF) for bridge financing when
The case presents an on-site land acquisition effort by several technical aspects of the project were over-
the CMP in Taguig, Metro Manila. looked. PAMANA’s experience caused a membership
The owner of a 1.9 hectare plot, Guillermo Tantoco, decrease from 182 households in 1990 to less than 100
designated Simeon Rodriguez, then barangay captain members upon the CMP loan take-out in 1994.
of Bagong Tanyag as caretaker of his land in the 1970s. Tatalon had a growing urban poor community even in
Tantoco initiated court proceedings after discovering the 1970s, but was only organised in the 1980s as
several squatters on his land. KALASAG. Due to internal problems, they were later
The residents solicited the help of Alfonso Saraoso, a reorganised into a smaller group called KAMTAN.
labour organiser, for the establishment of the Sitio de KAMTAN was supported by the Foundation for
Asis-Tanyag Homeowner’s Association (ASISTAN). Development Alternatives (FDA), an urban poor-
With ASISTAN, the residents were able to post a bond oriented NGO established in 1985, in their protests over
and to freeze Tantoco’s case against them. In 1984, NHA’s actions. With Corazon Aquino’s administration in
however, Saraoso announced that robbers stole the 1986, KAMTAN renewed their commitments to their
money put up by the residents to post the bond. purpose and started an organisational change process
Relations between Saraoso and residents soured and including a confidence vote for its leaders who would
ASISTAN collapsed. represent them in dealings with the government, partic-
That same year, local officials explained to the resi- ularly the NHA.
dents that the NHA had identified the area as part of the In 1990, the owner of the land on which most of the
ZIP, like the ZIP sites in nearby Bicutan. With the Tatalon urban poor communities are established offered
community already organised, the Parokyal 7 and 8 PhP12,000 (US$250) to each household that voluntarily
Association arose in 1984. The programme was, vacated the area. That same year, KAMTAN became
however, overtaken by the Edsa Revolution in 1986 and the current PAMANA, a change in name that projects a
was bogged down by internal problems. Parokyal then less belligerent stand toward government. From a
took advantage of opportunities offered under the new KAMTAN that earned the ire of the government,
administration. PAMANA tried to solicit the help of various government
With the CMP launched in 1987, NHA assisted the agencies.
Parokyal which had by then evolved into what is now PAMANA was given distinction as a model PO in a
called BATAHAI. After accreditation from the HIGC in nationwide contest sponsored by the ABS-CBN televi-
August 1989, BATAHAI’s bid for land ownership under sion network and the UGAT Foundation.
the CMP formally commenced.
BATAHAI’s experience led them to organisational Project Exodus
maturity. This experience included a negotiation of The case is an example of a negotiated sale, which
PhP250 per m2 from a PhP550 (US$11) per m2 price, was helped by the UHLP. It is also an NGO-initiated
the expulsion of 13 recalcitrant members who caused attempt at large-scale land and housing provision.
delay in the resolving the community approved physical The FDA assisted some 476 poor families to organise
development plan, and a delay of five years for the themselves in 1988 to finally resolve forced eviction
NHMFC to release their loan. threats in Sto. Rosario, Pasig City. Seven POs formed
into an alliance called the Alyansa ng mga Maralitang
Paninindigan ng Maralitang Nagkakaisa Tagalunsod sa Pasig (ALAMAT). Project Exodus was so
(PAMANA) named after the ALAMAT leaders presented with a frus-
This case highlights the operational problems of the trating unaffordable price and unhealthy site environ-
CMP based on an off-site effort in Novaliches, Quezon ment.
City, by an alliance based originally in Tatalon Estate. With the urgency of the Manggahan Floodway
The alliance, which evolved in name and in nature, grew Project, preparations for the upcoming Southeast Asian
from an urban poor community in the 1970s. Games, and other infrastructure works, the urban poor
The alliance was born in the interest of the POs to communities needed to relocate soon. The chosen site
strengthen their bargaining position vis-à-vis the was 48,000 m2 located some 10 km south-east of Sto.
government and the NHA. At that time, the NHA could Rosario, Pasig, sold to ALAMAT at PhP300 (US$6.25)
not acquire all of the lands occupied by the slum per m2.
dwellers, and were also disposing the properties not just CMP policies discouraged a large community such as
to the poor beneficiaries but also to the affluent families ALAMAT from participating in the programme, and
who were not legitimate residents in the area. instead encouraged the community to reorganise itself
The delay from tedious CMP processes had pushed into smaller groups. ALAMAT then opted to make use of
PAMANA to test its linkages with the FDA, Foundation the UHLP with FDUP as the legal holder under
for the Development of the Urban Poor (FDUP), NHMFC’s financing. In response to the requirements
14U N D E R S TA N D I N G S L U M S : C a s e St u d i e s f o r t h e G l o b a l R e p o r t o n H u m a n S e t t l e m e n t s 2 0 0 3
under UHLP, the target beneficiaries applied for Minimal amortisation during 1993 for 20 and 40 m2
membership with Pag-IBIG. house models amounted to PhP900 (US$19),
The project was to commence in two phases, with favourable enough in comparison to monthly rates.
Phase 2 commencing after the loan for the Phase 1 These projects were supported by the Private Sites and
homeowners had been taken out. A year after core Services Project Settlements, reducing financial
house construction was completed, 59 core houses still burdens that Freedom to Build would have shouldered.
remained vacant. Those who were assigned to these RA 7718 has also enabled these private sector projects
units were still finding difficulties raising the amount (Murphy 1993).
needed to start construction of their house structures. From initial difficulties, BATAHAI’s CMP project has
Those who had transferred organised themselves as progressed well through time, with road networks now
a homeowners’ association with specialised committees in order as well as a functional drainage system. Save
to address their community needs. This association The Children Foundation funded the erection of a two-
served as the implementing arm and administrative link storey multi-purpose centre. Many development agen-
to the community for FDUP and FDA. cies have supported BATAHAI’s livelihood programs.
In the end, the beneficiaries are generally satisfied Congressmen have funded infrastructure improvements
with the relocation options they received. for the site. It has become a testimonial instrument for
many politicians in the 1995 local elections as they
Damayan Community Center claimed to be a part of BATAHAI’s progress.
Damayan Community Center (DCC or Damayan) was Crucial to the success of the BATAHAI project has
established in 1972 by the Religious Order of the Good been their organisational development; how they coped
Shepherd Sisters as an outreach to the numerous fami- up with the external assistance and threats, how the
lies with large numbers of children, by providing them leadership was strengthened, and how their clout as an
with opportunities essential for their wholesome growth organisation grew over time. There is no doubt that the
and development. Damayan is derived from a Filipino government, NGOs, and the private sector have all
term whose meaning goes beyond the simple transla- provided valuable support to BATAHAI.
tion of its root word “damay” which means “assistance.” LGUs also have their share of potential best prac-
The centre is located in the heart of an urban poor tices. Marikina, for example, has pioneered the formula-
settlement straddling the towns of Malabon and the city tion of a Local Settlements Code (MMUSP 2002). The
of Caloocan, north of Manila City, where there are many Code has become a single reference document that
factories. This is one reason why there are so many summarises in chronological order all city ordinances
migrants from the different provinces in the area. affecting social housing. These include those financed
However, in spite of the presence of many factories, under the CMP. The codification has resulted in the
jobs are not available while those who are employed are resolution and harmonisation of conflicting provisions
being underpaid. embodied in the various ordinances; better understand-
Damayan’s beneficiaries do not own the land where ing of the rules and regulations affecting social housing
their houses are located. Many of them live in shanties. developments especially on the part of the community-
Some of the husbands of the beneficiaries are workers based organisations (CBOs) and the NGOs assisting
in nearby factories. They receive very low wages. Some the communities. Much remains to be done in the area
are pedicab drivers. The wives, on the other hand, are of implementation particularly in enhancing the capacity
left in their homes to look after the children, while the of the LGU staff to enforce the Code. A Settlements
children sell flowers. Code, however, is essential in the enforcement of social
housing standards as well as estate management rules.
MMUSPP aims to formulate a Model Settlements Code
which can guide the rest of the cities and municipalities
M. THE IMPACTS OF THESE within Metro Manila in the review of their ordinances
EFFORTS and preparation of their respective settlements code.
Like many urban poor based NGOs, the Damayan
1. Success Stories and Potential Best project livelihood programmes provide small capital
Practices loan assistance ranging from PhP300 to PhP3,000
(US$6 to $60). It was observed that small businesses
Freedom to Build, a non-profit organisation, is among thrive in communities, among these are rag-making,
the private developers in the 1990s that has worked on selling of roasted gizzards, sari-sari stores,
low-cost housing projects. Among their first major proj- Sampaguita-making, selling of orange juice, tailoring,
ects are the Horacio de la Cost Low Income Housing selling of tocino and longanisa, (popular foods) among
Projects in Barangka, Marikina and Novaliches. These others. Damayan charges 5 per cent interest per loan
built core houses and allowed the beneficiaries to finish for the whole three-month duration. According to
their houses according to their level of affordability. Damayan, this is necessary for the individual to exert an
15You can also read