Melrose Industries PLC - Half Year Results Six months ended 30 June 2021
←
→
Page content transcription
If your browser does not render page correctly, please read the page content below

Buy
      Improve
      Sell

                                                Strictly private and confidential

                Melrose Industries PLC
                Half Year Results
                Six months ended 30 June 2021
                2 September 2021

Buy
Improve
Sell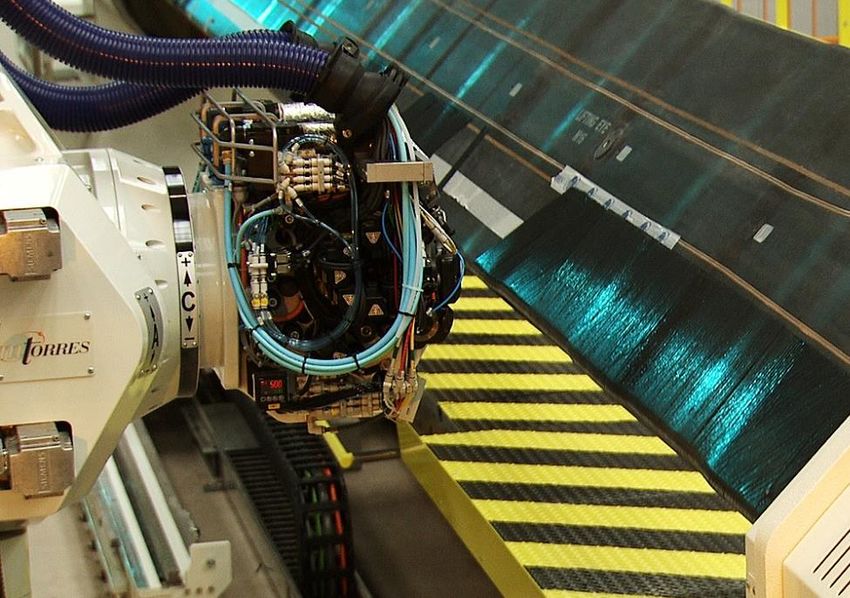
Contents

                 1 Highlights
                 2 Melrose key financial numbers
                 3 The results
                 4 Business update
                 5 Appendices

   Buy
   Improve   The revenue and profit numbers included in this presentation are shown in round millions and unless otherwise stated growth metrics are at constant currency
   Sell                                                                                                                                                                     2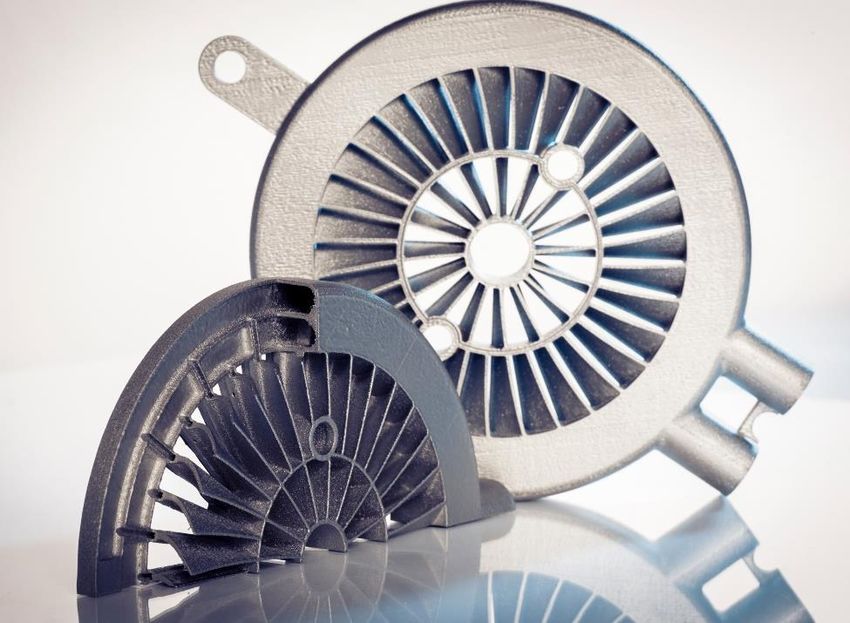
Buy
Improve
Sell

    Highlights

                 3
Highlights
                                                                                  Proforma1
                                                                                (post Return
                                                                                  of Capital)                   Adjusted2 results                        Statutory results
                                                                                          2021                2021                 2020                2021               2020
   Continuing operations                                                                   £m                  £m                   £m                  £m                  £m

   Revenue                                                                               3,828               3,828               3,624                3,540               3,386

   Operating profit/(loss)                                                                 223                  223                 (11)               (137)               (618)

   Profit/(loss) after tax                                                                 109                  109                 (80)               (151)               (585)

   Diluted earnings per share                                                             2.5p                 2.2p               (1.7)p              (3.1)p             (12.1)p

   Free cash flow2                                                                          75                  75                   29                 n/a                  n/a

   Net debt2                                                                             1,029                 300               3,399                  n/a                  n/a

   Leverage2                                                                              1.5x                 0.5x                 3.4x                n/a                  n/a

   Group
   ▪ Melrose is trading ahead of expectations, with better profit margins, better earnings per share and significantly lower net debt2; building
     the Group’s encouraging momentum

   ▪ The commitment, made on acquisition by Melrose, to improve significantly the funding of the GKN UK defined benefit pension schemes
     has been delivered ahead of schedule with the funding position of the schemes transformed for the better. The funding deficit of
     approximately £1 billion has currently reduced to approximately £150 million. Consequently the annual contribution halves to £30 million
     with no ongoing requirement to contribute from future disposal proceeds

   ▪ Net debt2 at 30 June 2021 was significantly lower at £300 million; proforma net debt2 at 30 June 2021 is £1,029 million after adjusting for
     the announced Return of Capital to be settled on 14 September 2021 (1.5x proforma leverage2)

   ▪ Free cash flow2 generation in the first half was £75 million; all the investment in restructuring costs, capital expenditure and sustainable
     technology has been self-funded from trading cash flows in the Period

   ▪ The Group recorded an adjusted2 earnings per share of 2.2 pence. Adjusting for the accretion post the announced Return of Capital and
     share consolidation, the Proforma EPS2 increases to 2.5 pence. The statutory loss per share was 3.1 pence

   ▪ The Nortek Air Management and Brush disposals both completed in the Period and Melrose has exchanged contracts for the sale of
     Nortek Control for $285 million, all of which are consistent with doubling shareholders’ money, or more, on each acquisition
  Buy
  Improve      1.    Proforma results are presented to give a meaningful measure of ongoing performance, adjusting for the announced Return of Capital and the associated share consolidation
  Sell         2.    Described in the glossary to the 2021 Interim Financial Statements, released on 2 September 2021                                                                           4
Highlights
   ▪ On 14 September Melrose is returning £729 million, 15 pence per share, to shareholders. In addition, the Melrose Balance Sheet has
     spare capacity for a significant further Capital Return next year

   ▪ An interim dividend of 0.75 pence per share (2020: nil) is declared

   Businesses

   ▪ Melrose businesses own world-leading sustainable technology which provides customers with solutions to significantly reduce their impact
     on the environment

   ▪ All businesses improved their adjusted1 operating margin in the Period compared to 2020 full year: Aerospace by +2.9 ppts; Automotive by
     +4.0 ppts; Powder Metallurgy by +6.9 ppts; and Ergotron by +0.8 ppts. Automotive and Powder Metallurgy are ahead of plan on their
     restructuring projects

   ▪ Aerospace is well positioned on many significant platforms; the civil aerospace business is now weighted more towards the faster
     narrowbody recovery and Defence demand remains strong. As previously indicated, significant restructuring is ongoing

   ▪ Automotive is well placed to benefit from the transition to electric vehicles. In the first half of this year over one third of new business
     bookings awarded were for pure electric platforms, over 50% if full hybrid platforms are included. Additionally, during the last 18 months
     Automotive has been awarded six major eDrive programmes for global and Chinese vehicle manufacturers. Automotive should grow at
     more than double the rate of light vehicle production over the long-term

   ▪ Powder Metallurgy is making clear market share gains, growing revenue at 43% in the first half, and with close to 70% of the business
     achieving more than 14% adjusted1 operating margins

   Justin Dowley, Chairman of Melrose Industries PLC, today said:
   “We are continuing to see recovery in all our businesses with trading ahead of expectations. Encouragingly, our Aerospace business is now
   weighted towards the expected narrowbody recovery. Our Automotive and Powder Metallurgy businesses are poised for strong growth as
   soon as the well publicised chip shortage abates and the progression in margins is ahead of plan with more to come. As with all its promises,
   Melrose has delivered its acquisition funding commitment to GKN pensioners early. We have scope on our balance sheet to return more
   money to shareholders next year and we are excited by the upcoming possibilities.”

  Buy
  Improve   1.   Described in the glossary to the 2021 Interim Financial Statements, released on 2 September 2021
  Sell                                                                                                                                              5
Buy
          Improve
          Sell

              Melrose key financial numbers

Buy
Improve
Sell                                          6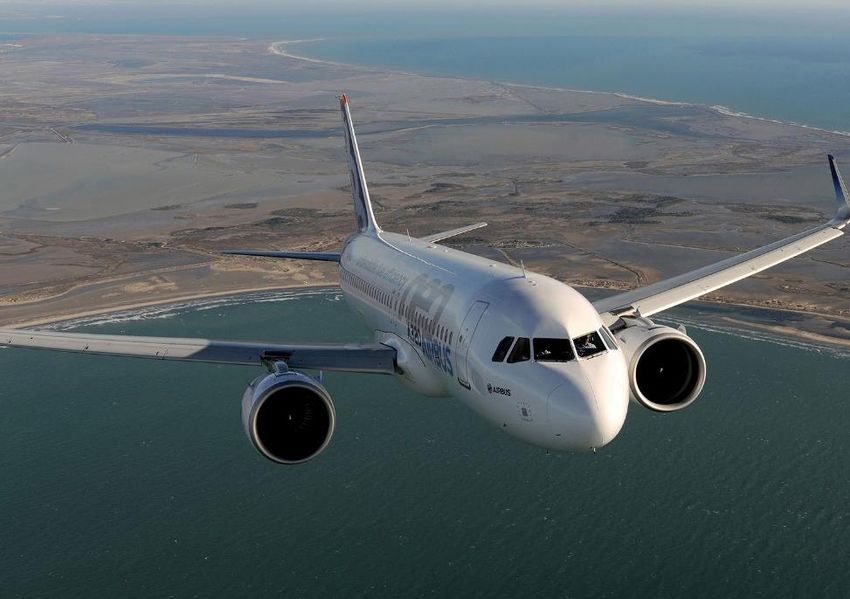
Melrose key financial numbers: ahead of expectations

    1. H1 2021 Proforma1 results: showing better profit margins, better earnings per share and
       significantly lower net debt1

                                     EPS1                                         Net debt1                          Leverage1
                                     2.5p                                         £1,029m                              1.5x

    ▪ Proforma EPS1 of 2.5p, calculated using the number of shares in issue following the Return of Capital and associated 9 for 10
      share consolidation. This is a measure of the run rate earnings

    ▪ Proforma net debt1 of £1,029 million and proforma leverage1 of 1.5x, including the £729 million Return of Capital (but excluding
      the Nortek Control proceeds)

   Buy
   Improve   1.   Described in the glossary to the 2021 Interim Financial Statements, released on 2 September 2021
   Sell                                                                                                                                  7
Melrose key financial numbers: increasing momentum

    2. Increasing momentum: significant upside potential in the continuing businesses

                                    Melrose margin target                                                             Based on 2020
                                                                                                                         revenue
                                                        Businesses sold in 2021 (average)3
                                                                                                                         2
                                                                                                                                          1 Continuing businesses (83%)
                                          Continuing businesses (average)                                                                 2 Businesses sold in 2021 (17%)3
                                                                                                                             1

                                                                      Average upside1                                        Resulting
                                                                             from H1                 Average sales       average profit
                                                                           margins to                  recovery to            potential
                                                                       margin targets                    2019 level             uplift2

                                   Continuing businesses                           c.5 ppts                   19%                c.2.5x

             ▪ Significant upside potential in the continuing businesses

             ▪ This keeps Melrose shareholders invested in high rates of return

   Buy         1.   Represents H1 2021 operating margins versus announced target margins
   Improve     2.   Represents uplift in profit required to reach target operating margins on 2019 sales
   Sell        3.   Includes Nortek Control (contracts exchanged on 23 August 2021)                                                                                          8
Melrose key financial numbers: good margin progression

    3. Margin progression: Automotive & Powder Metallurgy ahead of plan and restructuring fully
       underway

                                                   H1 2021                    Target           % of required
                                                  operating                operating         projects already
                                                   margins                  margins                underway
                                                                                                                       Half the required projects have started,
         Aerospace                                       3.4%                    10%1                      c.50%
                                                                                                                       the rest to commence in H2 this year
                                                                                                                       All required projects fully underway,
         Automotive                                      6.2%                    >10%                       100%
                                                                                                                       ahead of plan
                                                                                                                       All required projects fully underway,
         Powder Metallurgy                             11.2%                      14%                      100%2
                                                                                                                       ahead of plan

     ▪ All the required restructuring initiatives to achieve the target margins in Automotive and Powder Metallurgy are fully underway

     ▪ Half of the projects in Aerospace required to achieve the target margin are underway. The remaining c.50% of projects are
       identified, and due to commence in H2 2021

   Buy
   Improve    1.   Assuming only a partial market recovery, 12% assuming a full market recovery to 2019 sales levels
   Sell       2.   Projects required to achieve operating margin target in Powder Metallurgy, excluding the investment in Hydrogen Storage Technology             9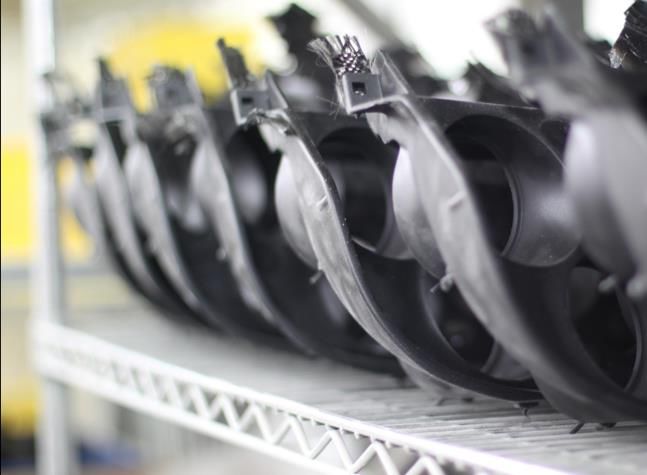
Melrose key financial numbers: GKN & Nortek both highly cash generative

    4.       Strong cash generation since the GKN acquisition from all businesses

    Total Melrose cash flows since GKN acquisition:
                                        Total cash inflow                                                                        Total cash inflow             £3.5bn
                                             £3.5bn
                                                                                                                                 Total paid to shareholders   (£1.1bn)
                                                                                                                                 Total debt reduction          £2.4bn
           At GKN
         acquisition              £2.5bn                                                                       At 30 June
                                 Disposals                                                                        2021
           (2018)                                      £1.0bn
                                                  Free cash inflow1

                                                                          £0.7bn           £0.4bn Dividends        £1.0bn
                                                                      Return of Capital                       Current proforma
                £3.4bn                                                                                            net debt1
               Opening
                                                                         Total paid to shareholders
               net debt1                                                           £1.1bn                        Proforma
                                                                                                                 leverage1
                                                                                                                    1.5x

              Leverage1
                c.2.5x

             ▪ £3.5 billion total cash inflow since GKN acquisition:
                ‒ £1.0 billion of free cash flow1 from the business post all costs (see next slide)
                ‒ £2.5 billion of disposal proceeds (excluding Nortek Control)
             ▪ Significant debt reduction and shareholder repayment made (see next slide)

   Buy
   Improve       1.   Described in the glossary to the 2021 Interim Financial Statements, released on 2 September 2021
   Sell                                                                                                                                                                  10
Melrose key financial numbers: GKN & Nortek both highly cash generative (continued)
4. Strong cash generation since the GKN acquisition from all businesses (continued)
Free cash inflow1 since GKN acquisition £1 billion:
▪ GKN has generated £1.7 billion of gross cash inflow
Central
costs, tax &
since ownership (120% profit conversion to cash post
£1.0bn capex) which has more than self funded its £0.5 billion
£0.8bn £0.6bn interest
of restructuring costs and £0.4 billion3 of pension
Total GKN Nortek2 £0.4bn
contributions, giving £0.8 billion of total net free cash
inflow from GKN in Melrose ownership so far
Total cash inflow
Use of £3.5 billion total cash generation since GKN acquisition:
▪ Melrose has generated £3.5 billion of total cash inflow
since the GKN acquisition, consisting of £1 billion of
free cash inflow and £2.5 billion of proceeds from
1
disposals (excluding Nortek Control)
1 Return to shareholders £1.1bn (31%)
2 Debt reduction £2.4bn (69%) Use of proceeds
2
▪ Currently debt reduction has been prioritised with £2.4
billion (69%) of the total cash inflow being used to lower
debt and £1.1 billion (31%) returned to shareholders.
There is room for a further Capital Return next year
Buy 1. Described in the glossary to the 2021 Interim Financial Statements, released on 2 September 2021
Improve 2. Nortek cash generation of £0.6 billion since GKN acquisition. During Melrose ownership Nortek has generated over £0.7 billion of cash after all costs
Sell 3. Includes £0.3 billion of contributions to GKN UK pension schemes and £0.1 billion to pension schemes in the rest of the world as at 30 June 2021 11Melrose key financial numbers: Balance Sheet currently more conservative than normal
5. The Melrose Balance Sheet has spare capacity for a further significant Return of Capital next year
Proforma1
Potential size of Capital Return next year
June 2021
based on various leverage scenarios (uses H1
Actual (post Return
2021 x 2 profits)2
June 2021 of Capital)
Pence per
Net debt1 £300m £1,029m Leverage1 £m share3
Current
leverage1 proforma1 1.5x 180 4p
0.5x 1.5x leverage1
position
1.75x 380 9p
2.0x 580 13p
Melrose life
time average 2.25x 780 18p
2.5x 980 23p
▪ Net debt1 at 30 June 2021 significantly reduced to £300 million, leverage1 of 0.5x EBITDA
▪ Proforma net debt1 at 30 June 2021 is £1,029 million and Proforma leverage1 at 30 June 2021 is 1.5x post announced Return of
Capital
▪ The Melrose Balance Sheet is currently more conservative than the life time average of 2.0x to 2.5x leverage1
Buy 1. Described in the glossary to the 2021 Interim Financial Statements, released on 2 September 2021
Improve 2. Calculated using H1 adjusted EBITDA for leverage covenant purposes, for the continuing Group of £403 million
Sell 3. Calculated using the number of shares in issue following the Return of Capital and associated share consolidation (4,372 million) 12Melrose key financial numbers: GKN pension commitment delivered ahead of schedule
6. GKN UK defined benefit pension scheme commitment has been delivered ahead of schedule
Funding deficit:
Significantly increased
Acquisition contributions in Melrose Improved investment
commitment ownership1 strategy and other Annual payment
halves to £30 million
‘Up to
£0.35 billion £0.45 billion
£1 billion’
No requirement for
future disposal
proceeds
▪ The Melrose pension commitment to GKN has been delivered ahead of time. The net funding deficit on acquisition was £938
million, this has been reduced to c.£150 million and the annual contribution now halves to £30 million with no ongoing
requirement to contribute from future disposal proceeds
Accounting deficit:
All acquisitions GKN UK
81% 102%1 81% 101%1
funded at funded after funded at funded
acquisition Melrose ownership acquisition so far
▪ All UK pension schemes much better funded under Melrose ownership
Buy
Improve 1. Including £64 million of contributions paid post 30 June 2021
Sell 13Melrose key financial numbers: Nortek delivering good returns for shareholders
7. Nortek: 87% complete (following Nortek Control exchange of contracts)
Nortek shareholder returns1
2.2x 21%
Return on equity2 IRR2
▪ Nortek Air Management disposal for gross proceeds of £2.6 billion ($3.6 billion), 12.5x 2020 adjusted3 EBITDA
▪ Nortek Control agreed to be sold for £0.2 billion in August 2021, just under 1x 2020 revenue
▪ At constant currency, Nortek is well on the way to doubling shareholders’ initial equity, and achieving an IRR of >20%
▪ At actual exchange rates Return on Equity is approximately 2.0x
Buy 1. Assumes Ergotron is at book value as at 30 June 2021
Improve 2. At constant currency and adjusting for the foreign exchange headwind since ownership of Nortek
Sell 3. Described in the glossary to the 2021 Interim Financial Statements, released on 2 September 2021 14Buy
Improve
Sell
The results
Trading ahead of expectations
Buy
Improve
Sell 15Summary of results
Proforma1
(post Return
of Capital) Adjusted2 results Statutory results
2021 2021 2020 2021 2020
Continuing operations £m £m £m £m £m
Revenue 3,828 3,828 3,624 3,540 3,386
Operating profit/(loss) 223 223 (11) (137) (618)
Profit/(loss) after tax 109 109 (80) (151) (585)
Diluted earnings per share 2.5p 2.2p (1.7)p (3.1)p (12.1)p
Free cash flow2 75 75 29 n/a n/a
Net debt2 1,029 300 3,399 n/a n/a
Leverage2 1.5x 0.5x 3.4x n/a n/a
▪ The Group is trading ahead of expectations, with better profit margins, better earnings per share and significantly lower net
debt2
▪ Proforma net debt2 of £1,029 million at 30 June 2021 and proforma leverage2 of 1.5x after the Return of Capital
Buy
Improve 1. Proforma results are presented to give a meaningful measure of ongoing performance, adjusting for the Return of Capital and the associated share consolidation
Sell 2. Described in the glossary to the 2021 Interim Financial Statements, released on 2 September 2021 16Reconciliation between statutory and adjusted1 results
Cash
Continuing operations spent in
£m Total 2021
Statutory operating loss (137)
Amortisation of intangible assets acquired in business combinations 226 -
Restructuring costs 85 92
Exchange movements not hedge accounted 44 -
Net release of fair value items (9) -
Other 14 -
Adjustments to statutory operating loss 360 92
Adjusted1 operating profit 223
Continuing operations £m
Statutory revenue 3,540
Share of equity accounted investments 288
Adjusted1 revenue 3,828
Statutory results Income Cash
Restructuring costs Statement spent in
▪ The IFRS measure of results includes certain items which are significant in £m charge period
size or volatility or by nature are non-trading or non-recurring, or are items Aerospace 26 44
released to the Income Statement that were previously a fair value item
booked on an acquisition Automotive 52 34
Powder Metallurgy 3 11
Adjusted1 results
Other Industrial - -
▪ The Melrose Board considers the adjusted results to be an important
Corporate 4 3
measure to monitor how the businesses are performing because they
achieve consistency and comparability when all businesses are held for the Total 85 92
complete reporting periods
Buy
Improve 1. Described in the glossary to the 2021 Interim Financial Statements, released on 2 September 2021
Sell 17Cash generation in the period: net debt significantly reduced
Free cash flow2 Reconciliation of opening to closing net debt2
Cash flow from continuing operations Group Reconciliation of net debt2 Group
£m 2021 £m 2021
Adjusted1 EBITDA 404 Net debt2 brought forward (2,847)
Lease obligation payments (29) Net cash flow from acquisition and disposal related activities3 2,401
Positive non-cash impact from loss-making contracts (23) Free cash inflow in the Period 75
Reduction in working capital 6 Discontinued operations 56
Adjusted operating cash flow (pre-capex)2 358 Payments to shareholders (36)
Net capital expenditure (104) Foreign exchange and other 51
Net interest and tax paid (113) Net debt2 at 30 June 2021 (300)
Defined benefit pension contributions – ongoing contributions (12)
Proforma net debt reconciliation
Dividend income from equity accounted investments 26 £m
Trading net other 12 Net debt2 at 30 June 2021 (300)
Adjusted free cash flow 2 167 Return of Capital (15 pence per share) (729)
Restructuring (92) Proforma net debt at 30 June 2021 (1,029)
Free cash flow2 75
▪ Adjusted free cash flow2 from continuing operations of £167 million, 43% higher than 2020 for these businesses, prior to £92 million of
restructuring costs
▪ A further £56 million free cash flow2 was generated from discontinued businesses in the Period
▪ Melrose continues to reduce net debt2 whilst still investing in the businesses
▪ Net debt2 of £300 million at closing exchange rates of US $1.38 and €1.16
Buy 1. Calculated excluding EBITDA from equity accounted investments
Improve 2. Described in the glossary to the 2021 Interim Financial Statements, released on 2 September 2021
Sell 3. Includes tax paid of £32 million following the extraction of Ergotron and Nortek Control from the Nortek tax group and specific pension contributions of £39 million paid prior to 18
the disposals of Nortek Air Management and BrushBuy
Improve
Sell
Business update
Clear momentum to target margins
Buy
Improve
Sell 19Melrose business portfolio
Aerospace Automotive Powder
Metallurgy
▪ Leading global tier one supplier ▪ #1 in Driveline with technology ▪ #1 in supply of precision
leadership powder metal parts
Strong market ▪ Strong positions on major civil
position and defence platforms ▪ Supplies 90% of OEMs, 50% ▪ #2 in powder metal production
of global vehicles
▪ Civil market recovering, led by ▪ Sales currently constrained by ▪ Sales currently constrained by
narrowbody demand semi-conductor shortage semi-conductor shortage
Recovering
▪ Defence demand remains ▪ Strong underlying consumer ▪ Strong industrial demand and
markets strong demand, especially for EVs auto recovery expected
▪ Around half of required ▪ All restructuring projects ▪ All restructuring projects
Margin restructuring underway underway underway
expansion ▪ Momentum for significant ▪ Transformation opportunity ▪ Focused in few remaining non-
opportunity operational gains (quality, greater than expected on performing areas
delivery, productivity) acquisition
▪ Improving existing fleet ▪ Leading EV drive system ▪ Compact and safe hydrogen
efficiency technology storage solutions
Sustainable
▪ Developing next generation of ▪ Significant investment into full ▪ Commercialising additive
technology greener aircraft range of eDrive system manufacturing
capabilities
Plus Ergotron, a leading manufacturer of digital display mounting, furniture and mobility products
Buy
Improve
Sell 20Business results: improved performance
Adjusted1 results
H1 2020 H1 2020
Continuing operations Operating Operating H1 2020 Operating Operating
£m Revenue profit/(loss) margin Revenue profit/(loss) margin
Aerospace 1,219 41 3.4% 1,580 54 3.4%
Automotive 1,965 121 6.2% 1,541 (64) (4.2%)
Powder Metallurgy 535 60 11.2% 396 (3) (0.8%)
Other Industrial 109 27 24.8% 107 22 20.6%
Central - (26) - - (20) -
Total 3,828 223 5.8% 3,624 (11) (0.3%)
▪ Adjusted1 revenue up 12%2 on H1 2020
▪ Group adjusted1 operating margin increases from (0.3%) to 5.8% highlighting continuing cost savings
▪ Aerospace revenue down 18%2 due to ongoing COVID-19 impact; profitability retained
▪ Automotive and Powder Metallurgy good recovery tapered by supply shortages of semi-conductors; margins up strongly
▪ Further operational improvements and restructuring benefits to come through in H2 2021
Buy
Improve 1. Described in the glossary to the 2021 Interim Financial Statements, released on 2 September 2021
Sell 2. Calculated at constant currency 21GKN Aerospace 32% of Melrose1 Buy Improve 1. Based on adjusted H1 2021 revenue for all continuing businesses Sell 22
Aerospace: overview

                                                   Adjusted1             Adjusted1         ▪ Markets remain impacted by COVID-19 with sales down 33%2 on H1
                                                     results               results           2019 and 18%2 on H1 2020
   £m                                               H1 2021               FY 2020

   Revenue                                               1,219                 2,804       ▪ Modest sequential sales growth of 4%2 versus H2 2020 linked to initial
   EBITDA                                                  112                     163
                                                                                             recovery

   EBITDA margin %                                       9.2%                     5.8%     ▪ Encouraging earnings momentum with margins up +2.9ppts
   Operating profit                                         41                      14
                                                                                           ▪ Significant restructuring ongoing, more benefits to come
   Operating margin %                                    3.4%                     0.5%

                     Revenue by platform                                            Revenue by product type                                Revenue by source

                                  1 Defence (46%)                                                        1 Airframes (53%)                            1 OE (91%)
                                  2 Civil: narrowbody (21%)                                              2 Engines (33%)               2              2 Aftermarket (9%)
            4                                                                       3
                                  3 Civil: widebody (19%)                                                3 Components (14%)
                                                                                                                                                            4 RoW (1%)
    3                    1        4 Civil: other (14%)
                                                                                                 1
                                                                              2

            2                                                                                                                               1

     Balanced portfolio, well positioned for                              Broad range of products, systems and                Predominantly OE driven, with increasing
            narrowbody recovery                                                  advanced technologies                           opportunity in attractive aftermarket

  Buy
  Improve       1.     Described in the glossary to the 2021 Interim Financial Statements, released on 2 September 2021
  Sell          2.     Calculated at constant currency                                                                                                                     23
Aerospace: portfolio
Mix Product Demand Technology
Civil
airframes & components
▪ Narrowbody 39% Provides main Primarily driven by OE Excellent position on
structures for all major civil build rates (>50% sustainable aircraft
▪ Widebody 27%
civil OE players Airbus) (e.g. Wing of
▪ Regional 34% Tomorrow and Alice)
Engines
▪ Civil 63% Produces key Linked to new build, Leading additive
components for all OE aftermarket and manufacturing and
▪ Defence 37%
engine manufacturers services/spares development of
(including RRSP) alternative power (e.g.
H2GEAR)
Defence
airframes & components
▪ Fighters 48% Provides structures and Linked to new build plus Developing next
components for all increasing aftermarket generation aircraft (e.g.
▪ Rotorcraft 33%
major defence primes and spares/repair US advanced
▪ Other 19% (~30% F35) programmes), plus
composite breakthroughs
Increasing emphasis on higher margin “design to build” positions,
plus Engines and Defence aftermarket growth
Buy
Improve
Sell 24Aerospace: improvement actions
Progress to date Future actions
▪ Reduced exposure to legacy onerous ▪ Continued/accelerated renegotiation
contracts by >60% or exit
Commercial
▪ Renegotiated or exited some ▪ Focus growth in attractive
Commercial
mix mix unattractive business aftermarket and repair
▪ Sold non-core, low margin businesses ▪ Selective bidding, concentrated on
in The Netherlands design to build
▪ Ongoing deployment of lean operating ▪ Major focus on further reducing
model costs of quality
Operational
gains ▪ Quality delivered to customer ▪ Driving productivity as demand
improved by 39%1 recovers
▪ Productivity up by 7% in H1 ▪ Preparing for ramp-up in civil OE
▪ Significant demand led headcount ▪ Accelerated execution of
reduction linked to COVID-19 impact restructuring underway
(approximately 50% of projects)
Restructuring ▪ Structural projects underway in
Europe (e.g. Kings Norton and ▪ Starting new restructuring projects
Nordics) in H2, including in North America
Actions underpin delivery of 10% margins on partial market recovery
Buy
Improve 1. As measured by quality escapes: parts shipped to customers that do not meet full quality requirements
Sell 25Aerospace: highlights
Global tier one leader in civil and defence
▪ Balanced portfolio covering airframes, engines and components
▪ Established positions on all high volume platforms - e.g. A320, B737, F35
▪ Expanding ‘design to build’ capability
▪ Growth in engines and components aftermarket
Well positioned to benefit from market recovery
▪ Good exposure to expected civil narrowbody ramp-up to >2019 levels
▪ Engines RRSPs and aftermarket set to generate strong margins and cash as flying hours increase
Underway with transforming the business, clear path to 10% profit on partial market recovery
▪ Actions taken are reading through to improved margins ahead of recovery
▪ Significant further work underway to drive operational gains in quality, delivery and productivity
▪ Around 50% of structural projects started, others to commence in H2 2021
Ongoing focus to maintain technology leadership and develop sustainable aviation
▪ Improving efficiency of existing aircraft – e.g. less drag wing design, lighter components and lower energy manufacturing methods
▪ Developing next generation of aircraft – e.g. Eviation Alice, H2GEAR and selective UAM platforms
▪ Building differentiated capability through global technology centres – e.g. UK, The Netherlands, Sweden and USA
Buy
Improve
Sell 26GKN Automotive 51% of Melrose1 Buy Improve 1. Based on adjusted H1 2021 revenue for all continuing businesses Sell 27
Automotive: overview

                                                  Adjusted1             Adjusted1
                                                    results               results
   £m                                              H1 2021               FY 2020              ▪ Approximately 9% annualised sales growth (2x H1 2021 versus FY
                                                                                                2020 at constant currency)
   Revenue                                              1,965                 3,797

   EBITDA2                                                238                     322         ▪ Strong margin progress from 2.2% to 6.2%
   EBITDA2 margin %                                    12.1%                  8.5%
                                                                                              ▪ Improvement actions reading through, ahead of plan
   Operating profit                                       121                      82

   Operating margin %                                    6.2%                 2.2%

                  Revenue by product type                                               H1 new business bookings                              Revenue by destination

                                     1 Driveline (70%)                                                      1 BEV                                        1 Europe (37%)
             34                      2 All Wheel Drive (24%)                                                2 Full hybrid                 4              2 North America (30%)
                                                                              4
                                     3 eDrive (4%)                                              1           3 Mild hybrid          3                     3 Asia (29%)
        2                                                                                                                                          1
                                     4 Cylinder Liners (2%)                                                 4 ICE                                        4 RoW (4%)

                          1
                                                                              3
                                                                                          2                                              2

    A trusted partner for 90% of global OEMs,                                   Over one third of the new business                     A truly global presence with a long
         content on 50% of vehicles sold                                       bookings in H1 were on pure electric                       established position in China
                                                                             platforms; over 50% including full hybrid
                                                                                             platforms

  Buy
  Improve    1.       Described in the glossary to the 2021 Interim Financial Statements, released on 2 September 2021
  Sell       2.       Including depreciation and amortisation from equity accounted investments                                                                            28
Automotive: highlights
Global leader in drive systems
▪ #1 in Driveline, with clear technology leadership and over 40% market share in its core product
▪ Increased torque and power requirements of electric vehicles benefits GKN Automotive’s core product strengths
Structural growth in core products
▪ Sales are currently constrained by ongoing semi-conductor supply chain shortages, underlying consumer demand higher
▪ GKN Automotive’s long-term outlook is to grow at a rate of more than double global light vehicle production
Well positioned to capture incremental electrification growth
▪ eDrive strategy enables flexibility to supply either components or integrated systems depending on OEM outsourcing strategy
▪ Full drive system portfolio expands content per vehicle with electrification
▪ In the last 18 months Automotive has been awarded six major eDrive programmes for global and Chinese vehicle manufacturers and
has a strong pipeline for the future
▪ Over one third of the new business bookings in H1 were on pure electric platforms; over 50% including full hybrid platforms. Wins
include a major new 3-in-1 system for a leading German OEM
Transforming the business, with a clear path to >10% profit
▪ Ahead of plan on transformation, all restructuring projects necessary to achieve the target margin are already underway
▪ Tight control of costs and restructuring actions means small profit impact from global supply issues; 8% decremental margin in H1
versus H2 2020, holding margin at 6.2%
Driving a cleaner, more sustainable world
▪ Leading technology contributes to the decarbonisation of the industry
▪ Developing lighter, more efficient EV powertrains for the volume automotive market
Buy
Improve
Sell 29GKN Powder Metallurgy 14% of Melrose1 Buy Improve 1. Based on adjusted H1 2021 revenue for all continuing businesses Sell 30
Powder Metallurgy: overview

                                                     Adjusted1             Adjusted1
                                                       results               results
   £m                                                 H1 2021               FY 2020          ▪ Growing faster than the market due to share gains, annualised sales up
                                                                                               25% (2x H1 2021 versus FY 2020 at constant currency)
   Revenue                                                   535                   905

   EBITDA2                                                    92                   110       ▪ Excellent margin progress from 4.3% to 11.2%
   EBITDA2 margin %                                       17.2%                 12.2%
                                                                                             ▪ Improvement actions benefitting results and expected to be substantially
   Operating profit                                           60                    39         complete by the end of the year
   Operating margin %                                     11.2%                  4.3%

                     Revenue by segment3                                                 Revenue by destination                                Revenue by market type3

                     4                  1 OneSinter (69%)                                4                   1 North America (42%)                           1 Automotive
            3                                                                      3                                                       4
                                        2 Non-performing (10%)                                               2 Europe (37%)                                    components (33%)
                                                                                                   1                                                 1
                                                                                                                                                             2 Transmission (25%)
                                        3 Powder (19%)                                                       3 Asia (19%)
        2                                                                                                                                                           4 RoW
                                                                                                                                                             3 Engine (23%)(1%)
                                        4 Additive (2%)                                                      4 RoW (2%)                3
                              1                                                                                                                              4 Industrial (19%)
                                                                                   2
                                                                                                                                                 2

        Non-performing segment has reduced                                             #1 global leader – well spread                Good exposure to recovering automotive
          from 16% to 10% of the business                                                     geographically                         sector, increasingly powertrain agnostic,
                                                                                                                                          and general industrial market

  Buy           1.       Described in the glossary to the 2021 Interim Financial Statements, released on 2 September 2021
  Improve       2.       Including depreciation and amortisation from equity accounted investments
  Sell          3.       Excluding non-performing plant sold in the Period                                                                                                        31
Powder Metallurgy: highlights
Global leader in Powder Metallurgy
▪ #1 global producer of precision powder metal parts – 17% market share
▪ #2 global producer of powder metal – 24% market share
Growth in the core business with market share gains
▪ Growing faster than the market due to share gains – 43% year on year H1 sales growth exceeds 29% increase in light vehicle
production by 14 ppts
▪ £120 million of annual sales won in attractive segments with continued good momentum in H1
A clear path to improve to 14% operating margin
▪ Approaching 70% of sales already above 14% margins. H1 operating margin of 11.2% (12.0% excluding hydrogen start-up costs)
▪ Three non-performing sites; one sold, one announced to close and the third plant is under an intensive operational improvement
programme
▪ All restructuring projects necessary to achieve the target margin are already underway, non-performing segment reduced from 16% of
the business to 10%
▪ Restructuring largely complete by the end of this year
Incremental high growth from exciting and sustainable new technologies
▪ Hydrogen storage business launched and in development – safe and reliable method for storing green and rapidly growing energy
source
▪ Additive growth in H1, +15% year on year, improving efficiency of manufacturing and reducing material waste
ADDITIVE
Buy
Improve
Sell 32Other Industrial 3% of Melrose1 Buy Improve 1. Based on adjusted H1 2021 revenue for all continuing businesses Sell 33
Other Industrial: highlights

                                                   Adjusted1             Adjusted1
                                                     results               results
    £m                                              H1 2021               FY 2020

    Revenue                                                 109                  217

    EBITDA                                                   28                   56

    EBITDA margin %                                      25.7%                25.8%

    Operating profit                                         27                   52

    Operating margin %                                   24.8%                24.0%

    Overview

    Following the disposal of Brush and the reclassification of Nortek Control to held for sale, both are shown as discontinued and Ergotron is
    the remaining business in Other Industrial

    Ergotron

    ▪ Positive sales momentum as office sales recover, new products gain traction and digital channels grow

    ▪ Business returned to premium operating margins

    ▪ Planned exit of low profitability business and focus on higher margin, higher value-add products well underway

   Buy
   Improve    1.       Described in the glossary to the 2021 Interim Financial Statements, released on 2 September 2021
   Sell                                                                                                                                           34
Sustainable technology
Aerospace Automotive Powder Metallurgy
Improving efficiency and Producing driveline solutions Commercialising additive
sustainability of current aircraft: tailored to electric vehicles: manufacturing (AM) across sectors:
Wing of Tomorrow High efficiency, high Intricate metal powder
torque, low NVH AM
sideshaft
Additive manufacturing Forecast 3D plastic
air cases Developing a range of eDrive systems
AM
for electric/hybrid vehicles:
Developing next generation of
alternative power aircraft: Developing breakthrough
2-in-1 eDrive system
sustainable storage solutions:
Alice electric aircraft
GKN Hydrogen
3-in-1 eDrive system
H2GEAR hydrogen
propulsion
Providing focus and investment to make our businesses sustainable and valuable
Buy
Improve
Sell 35Buy
Improve
Sell
Appendices
36Pensions
Pension schemes
Accounting
30 June 2021 surplus/ Movement in
£m Assets Liabilities (deficit) the period
UK 2,959 (3,006) (47) 71
Europe 24 (557) (533) 43
USA 197 (303) (106) 31
Rest of World 32 (39) (7) -
Total pension schemes 3,212 (3,905) (693) 145
▪ Of the £145 million movement in the Period a £56 million net surplus was sold as part of the Nortek Air Management and
Brush disposals
▪ Since the half year £64 million has been paid into the GKN UK schemes
▪ European schemes represent 77% of the Group deficit, largely “pay as you go” schemes
Accounting deficit by region
UK (7%)
4 1
3
Europe (77%)
USA (15%)
RoW (1%)
2
Buy
Improve
Sell 37Foreign exchange → forward looking
H1 2021 H1 2020 FY 2020
Exchange rates USD EUR USD EUR USD EUR
Average rates 1.39 1.15 1.26 1.14 1.28 1.13
Closing rates 1.38 1.16 1.24 1.10 1.37 1.12
Income Statement volatility – Translational impact Balance Sheet volatility
Impact on adjusted1 operating profit of a 10% strengthening2 of: Impact on debt of a 10% strengthening2 of:
£m USD EUR CNY Other3 £m USD EUR
Movement in adjusted1 operating profit 29 11 8 12
Increase in debt 85 47
% impact on adjusted1 operating profit 6% 2% 2% 2%
▪ Transactional FX hedges taken out to provide appropriate short and medium-term cover:
− Next 12 months: c.90% covered
− 12 to 24 months: c.60% to 80% covered
▪ Group debt drawn in UK, US and Euro currencies to protect leverage, based on a mix of approximately 52% USD, 28% EUR and 20% GBP
Buy 1. Described in the glossary to the 2021 Interim Financial Statements, released on 2 September 2021
Improve 2. 10% strengthening against all currencies
Sell 3. Assuming all other currencies strengthen against Sterling by 10% at the same time 38Some helpful data for H1 2021
Continuing operations Income Statement Cash Flow
Item H1 2021 adjusted1 results H1 2021 adjusted1 results
Adjusted1 operating profit £223 million N/A
£26 million (includes a divisional
Central costs (£16 million)
LTIP charge of £10 million)
Adjusted1 free cash flow1 N/A £167 million
Underlying effective tax rate 22% N/A
Finance costs:
- Bank and loan related (£65 million)
- Lease obligation related (£7 million)
- Amortisation of debt arrangement costs (£5 million) (£73 million)
- Pension interest (£4 million)
- Other (£1 million)
Depreciation and amortisation (£209 million) £209 million
Capital expenditure N/A (£104 million)
Pension payments – ongoing contributions (global) N/A (£12 million)2
Restructuring costs (£85 million) (£92 million)
Non-controlling interest £1 million £nil
Number of shares in issue at 30 June 2021 4,858 million N/A
Number of shares in issue post Return of Capital 4,372 million N/A
Weighted average number of shares in 2021 4,695 million N/A
H1 adjusted1 EBITDA for leverage covenant purposes £403 million N/A
Buy
Improve 1. Described in the glossary to the 2021 Interim Financial Statements, released on 2 September 2021
Sell 2. Ongoing pension contributions will include £30 million per annum payable to the GKN UK pension schemes 39You can also read