March 13-April 30, 2020 online review - Colorado Parks and Wildlife DRAFT
←
→
Page content transcription
If your browser does not render page correctly, please read the page content below
West Slope Mountain Lion Plan- DRAFT for online review

           March 13-April 30, 2020 online review
             Colorado Parks and Wildlife DRAFT
    COLORADO WEST SLOPE MOUNTAIN LION (Puma concolor)
                   MANAGEMENT PLAN
                          Northwest and Southwest Regions

                                          Spring 2020

                         Colorado Parks and Wildlife

                                                 Approved by the Parks and Wildlife Commission on xx

                                                 1
West Slope Mountain Lion Plan- DRAFT for online review

                                      Executive Summary

Colorado Parks and Wildlife’s (CPW) aim for mountain lion management on the West Slope of
Colorado is to preserve, protect, enhance and manage mountain lions for the use, benefit,
and enjoyment of the state’s citizens and visitors. CPW strives to ensure that mountain lions
continue to exist in relatively stable numbers in western Colorado for current and future
generations to enjoy through hunting, occasional observation, and for their scientific,
ecological and aesthetic value. This mountain lion management plan provides the framework
for how CPW will achieve this goal in the Northwest and Southwest CPW Administrative
Regions and replaces all existing West Slope Data Analysis Unit (DAU) lion management plans.

This West Slope Mountain Lion Management Plan operates with the assertion that CPW’s
thirteen DAU plans in western Colorado, each written in 2004 to describe a single lion
population, are too small in spatial scale to properly manage solitary, low-density, wide-
ranging carnivores like mountain lions. In many cases, sample sizes of mountain lion mortality
data have been too small to reduce uncertainty in management conclusions and have not
effectively informed past DAU objectives. This plan increases the size of the management
unit at which analysis and evaluation will occur to a more appropriate scale: the CPW
Administrative Northwest and Southwest Regions. As under recent lion management, hunter
harvest will continue to be allocated across groups of Game Management Units (GMUs), but
the size of each of these groups will be increased.

This plan incorporates recent developments in mountain lion research that have been
published in the peer-reviewed literature over the last 16 years. Many of these advancements
are discussed in this document and some provide integral parts of the framework of this plan.
The monitoring thresholds included in this plan are supported by a strong body of research
and management citations. In addition, this plan outlines the process of annual review,
evaluation, and adjustment to management.

Regional Objectives: The management objective in both Regions is to maintain a relatively
stable mountain lion population. This replaces current objectives in the thirteen individual
DAUs, two of which are managed for suppression of the population. Allocating allowable
harvest mortality across the Region provides local managers flexibility in distribution of
harvest limits, while Regional thresholds ensure the maintenance of population stability at
the larger scale.

Regional Annual Data Collection and Monitoring Thresholds
Two annual monitoring thresholds are established in this plan and will be evaluated
independently for each West Slope Region:
   1) Adult Female Harvest Composition Threshold: Adult female composition in total
      harvest will not exceed 22% in any year in each Region, excluding the Glenwood
      Special Management Area

                                                 2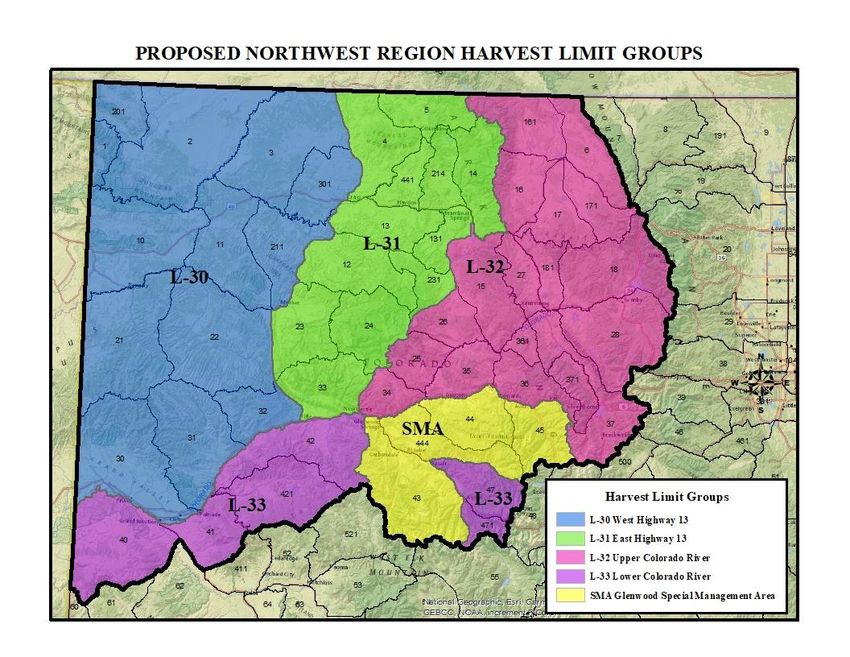
West Slope Mountain Lion Plan- DRAFT for online review

   2) Total Human-Caused Mortality: The 3-year average of total human-caused
      mortality will not exceed 17% of the extrapolated abundance index from the
      resource selection function for each Region, excluding the Glenwood Special
      Management Area

   The following totals do not include the Glenwood Special Management Area

   Northwest Region total human-caused mortality threshold: 269 lions
   Southwest Region total human-caused mortality threshold: 284 lions

   Proposed 2021-2022 Northwest Region harvest objective: 243
   Proposed 2021-2022 Southwest Region harvest objective: 185

   Historic 2018-2019 Northwest Region harvest limits: 317
   Historic 2018-2019 Southwest Region harvest limits: 194

Annual evaluation of adult female harvest composition allows assessment of what the
population trajectory might be based on the selective nature of hound hunting and the
proportional abundance of each age/sex class on the landscape. Limiting adult female
harvest also acts to protect the component of the population responsible for reproduction.
Use of a total human-caused mortality threshold acknowledges the biological importance
of other human-caused lion mortality factors beyond harvest and sets a ceiling for that
maximum acceptable mortality that interacts with information derived from adult female
composition evaluations.

By complementing different aspects of our understanding of mountain lion population
performance in each Region, these monitoring thresholds are designed to interact and
modulate each other during annual analysis. If either threshold is exceeded, this plan lays
out clear and supportable steps that will be taken with harvest management to return the
population trajectory to a stable one. Additionally, as part of the West Slope plan, CPW
will begin the initiation of a mark-resight lion density monitoring program. Survey areas
on the West Slope would be used to confirm and align observed lion densities with
abundance index projections generated from Regional resource selection function output.

Exceptions to Monitoring Thresholds: Retaining viable mountain lion populations for future
generations, like with any other big game species, does not require populations to exist at
their maximum potential. In GMUs 43, 44, 45 and 444 near Glenwood Springs, human safety
and social tolerance levels is a higher management priority than lion abundance. This is
balanced with the overarching goal, at the much larger Northwest Regional scale, of
maintaining a stable lion population. Consequently, this plan establishes the Glenwood
Special Management Area (SMA) with its own management objectives where the Regional
monitoring thresholds will not be applied.

                                                 3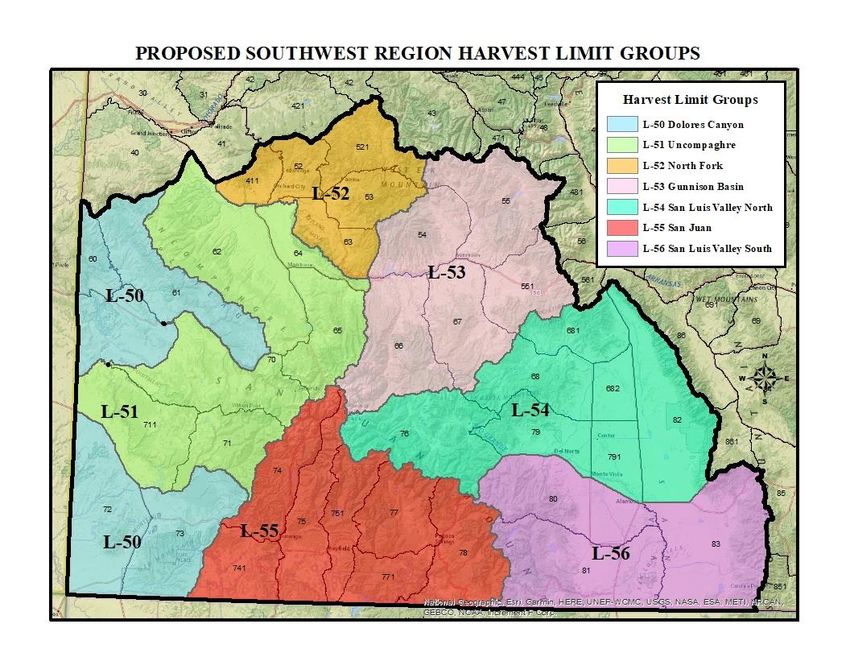
West Slope Mountain Lion Plan- DRAFT for online review

Management Plan Public Involvement:
In developing this plan, CPW gathered input from the public through several channels. To
inform elements of the plan specific to the Northwest and Southwest Regions, CPW held 12
public meetings on the West Slope and will hold 3 on the Front Range in addition to direct
public outreach by staff. This plan was also posted on the CPW webpage for 30 days to
collect additional public comments. Additional meetings and public input are occurring
during the time this draft plan is online for review. CPW will update and summarize public
input from all aspects of the initial drafting of this plan following the 30 day review period.
That will be included as Appendix E of the West Slope plan.

Appendices to this plan should be referenced for comprehensive explanations on the following
topics:
Appendix A: Mountain Lion Life History, Ecology and Monitoring
Appendix B: Mountain Lion Management History in Colorado and the West Slope
Appendix C: Mountain Lion Resource Selection Function model
Appendix D: Literature Cited and References
Appendix E: Public Outreach Process and Results (to be developed after 30 day review period)

Acknowledgments: The development of this West Slope Mountain Lion Management Plan
involved the active participation of many people, whose professional expertise, knowledge,
experience, and perspectives were invaluable for critical review and numerous suggestions to
improve the content including Area Wildlife Managers, District Wildlife Managers, Terrestrial
Biologists, Regional Managers, Terrestrial Section Staff, Researchers and Human Dimensions
Specialists, and many others too numerous to individually mention here. All of the above
professionals had many other projects and activities that were shuffled, juggled, shifted and
some, perhaps, remained unfinished for the time everyone applied to reviewing and
improving this plan. Colorado Parks and Wildlife thanks all of you.

                                                 4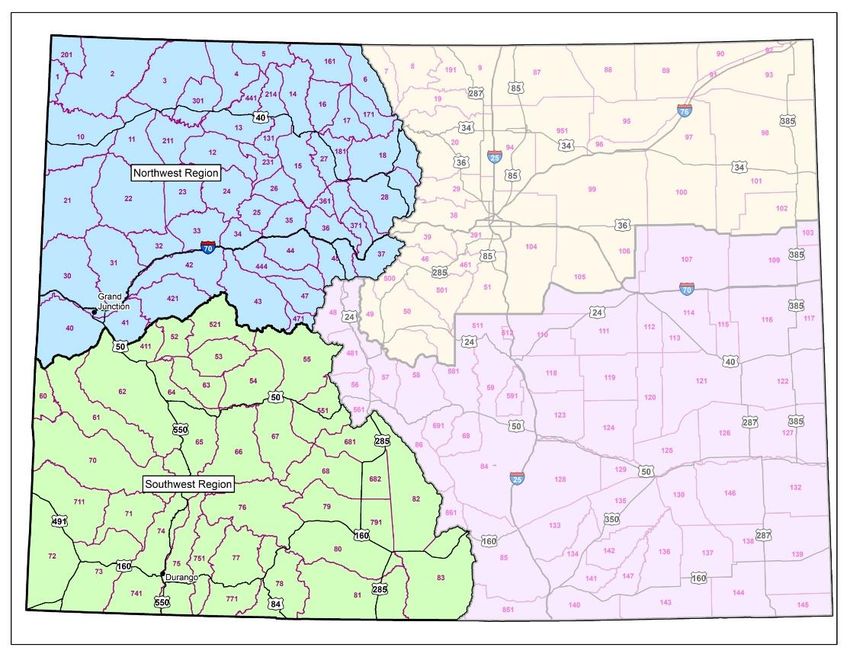
West Slope Mountain Lion Plan- DRAFT for online review

Colorado West Slope Mountain Lion Management Plan

Table of Contents
     I. West Slope Lion Management Plan Goal and Strategy -------------------------------- 6
     II. Lion Harvest Terminology, Regulations Process, and Hunting Seasons-------------6
            Harvest Limit Groups--------------------------------------------------------------------6
            Regional Harvest Objectives and Harvest Limit-------------------------------------7
            Annual Lion Regulation Process ------------------------------------------------------ 7
            Lion Hunting Seasons ------------------------------------------------------------------ 8
            Methods of Take ------------------------------------------------------------------------ 8
     III. Regional Data Collection Scales and Monitoring Thresholds-------------------------9
            West Slope Mule Deer Strategy & Lion Plan Relationship--------------------------9
            Regional Data Analysis Units----------------------------------------------------------10
            Annual Data Collection----------------------------------------------------------------11
            Adult Female Composition Threshold ---------------------------------------------- 12
            Total Human-caused Mortality Threshold------------------------------------------ 14
     IV. Annual Management Thresholds ------------------------------------------------------- 17
             Voluntary Female Harvest Reduction Outreach-----------------------------------18
             Harvest Limit Reductions-------------------------------------------------------------19
     V. Lion Population Resiliency -------------------------------------------------------------- 19
             Resiliency to High Mortality----------------------------------------------------------19
             Source Population Refuges-----------------------------------------------------------20
             Zone Management---------------------------------------------------------------------22
     VI. West Slope Regional Summaries--------------------------------------------------------23
             Northwest Region--------------------------------------------------------------------- 23
             Southwest Region--------------------------------------------------------------------- 30
     VII. Management Plan Update and Revision Process ------------------------------------ 34
     VIII. Lion Density Monitoring and Future Research Needs------------------------------ 35

Appendix A….Mountain Lion Life History, Ecology, and Monitoring
Appendix B….History of Mountain Lion Management in Colorado
Appendix C….Colorado Resource Selection Function
Appendix D….Literature Cited and References
Appendix E….Public Outreach Process and Results

                                                     5
West Slope Mountain Lion Plan- DRAFT for online review
I. West Slope Mountain Lion Management Plan Goal and Strategy
On the West Slope of Colorado, Colorado Parks and Wildlife’s (CPW) aim for lion management
is to preserve, protect, enhance, and manage mountain lions for the use, benefit, and
enjoyment of the citizens of Colorado and its visitors. The broad goal laid forth in this plan by
CPW in both the Northwest and Southwest Administrative Regions is to manage for relatively
stable mountain lion populations, while allowing for management flexibility at smaller
scales.
This plan puts forth a strategy to allow management flexibility at smaller geographic scales
(harvest limit groups) while managing for viable and stable lion numbers at the larger
Regional geographic scale. At small scales, lions experience great variation in rates of
abundance, survival, mortality, immigration, and emigration and therefore while
management assumptions about those parameters are quite important, they can be
inaccurate. At larger scales however, it is more likely that differences in initial population
density assumptions result in relatively small changes in population growth rate, and
uncertainty about dispersal may not be as influential (Robinson et al. 2015). A review of these
and other aspects of lion biology and ecology is provided in Appendix A. With implementation
of this plan, we will transition from current lion Data Analysis Units (DAUs) on the West Slope
to the CPW Administrative Regions (Southwest and Northwest) as the management unit of
interest, analysis and reporting.
The need for this West Slope plan is demonstrated as follows:
Larger management scales (such as Regions) are most relevant to lion biology and most
appropriately support current management inferences from mortality and composition
data
Significant advancements in geographic information systems (GIS) modeling, lion
monitoring metrics, density estimation and population trajectory information have
been published in the realm of peer-reviewed literature over the last 15 years, and
need to be incorporated into current and future management.
Existing lion management plans are outdated as all but one West Slope lion DAU have
plans over 15 years old and this plan will leverage updates into one plan.
Without updated West Slope lion management plans, managers setting annual harvest
limits are challenged with aligning metrics and objectives in historic plans against
concerns over various aspects of plans that many have deemed to have lost relevance.
II. Lion Harvest Terminology, Regulations Process and Hunting Seasons
Harvest Limit Groups: The term to describe the pool or grouping of West Slope Game
Management Units (GMUs) that are joined together under one harvest limit will be called a
“harvest limit group”. In the past, harvest limit groups have been as small as one GMU or up
to 5 or 6 GMUs. Under this plan, the size of harvest limit groups will increase, as each group
will include more GMUs than under past plans.
6West Slope Mountain Lion Plan- DRAFT for online review
Regional Harvest Objectives and Harvest Limit: CPW will establish annual “Regional
harvest objectives” for the Northwest and Southwest Regions independently. However, the
term harvest objective makes less sense and could create confusion at the smaller harvest
limit group scale. Therefore, at the harvest limit group scale, we will continue to use the
term “harvest limit” to describe the distribution of the Regional harvest objective across
smaller geographic areas of the Region on an annual basis. In this context, the sum of the
harvest limits within each Region is equal to the Regional harvest objective. Regional
summaries included later in this plan provide further discussion on specific recommendations
for the first 3 years of the plan.
As with current lion regulations, the annual harvest limit accounting begins on April 1 and
ends on March 31 (license year). Only hunter harvest (lions associated with take on a lion
license) will be counted and deducted from the harvest limit. During the Regional harvest
objective and harvest limit setting process, wildlife managers consider the estimated amount
of non-harvest mortality that contributes to total human-caused mortality. While Regional
harvest limits and harvest limit group composition are reviewed annually, it is CPW’s intent
that both will be largely static for the first 3 years of this plan on the West Slope. An
exception to this stability in harvest limits would be if management thresholds are exceeded
and management action is needed. Maintaining these new lion harvest limits for periods of ≥3
years will allow sufficient time for any management efforts to yield results. For example, if
efforts are applied to decrease lion abundance in a local zone, Anderson and Lindzey (2005)
suggest that a 3-year period is necessary to detect results. Other studies suggest that a 3-5
year time period is the minimum time for recovery of previously suppressed populations
(Logan and Sweanor 2001, Anderson and Lindzey 2005, Stoner et al. 2006, Robinson and
DeSimone 2011).
Annual Lion Regulations Process: This West Slope Mountain Lion Management Plan continues
to follow CPW’s current regulatory process and timeline. The annual regulatory cycle for
mountain lions occurs in two stages. The first stage includes regulations related to season
dates, open GMUs or harvest limit groups, method of take, and harvest reporting
requirements. The second stage involves the establishment of annual harvest limits by harvest
limit groups.
Mountain Lion Regulation Development Process for Seasons, Method of Take, Other
Provisions:
July-September: internal considerations, conceptual development, regional review
meetings
October: issues considered at internal regulation review meetings
November: issues/draft regulations presented for consideration at the Parks and Wildlife
Commission meeting
December: regulation language modified pursuant to November meeting outcomes
January: final adoption action by the Parks and Wildlife Commission
7West Slope Mountain Lion Plan- DRAFT for online review
Mountain Lion Regulation Development Process for Harvest Limits:
June-July: analysis of harvest and total mortality, adult female harvest composition and
Glenwood SMA lion management objectives
September-November: internal development of harvest limit recommendations, regional
review meetings, harvest limits by harvest limit group considered at internal regulation
review meetings
January: final adoption action by the Parks and Wildlife Commission on harvest limits
along with final approval of all other lion provisions
February: publication of on-line mountain lion brochure
Every 5 years, CPW’s big game season structure is re-evaluated. During this structural review
process, public input is solicited, with three hearing stages that include issue identification
and examination, drafting of regulations, and final structure and approval by the Parks and
Wildlife Commission. The approved 2020-2024 big game season structure is compatible with
all aspects of this West Slope Mountain Lion Management Plan.
Lion Hunting Seasons: Currently, two distinct seasons occur during the April 1- March 31
license year. Both seasons will be maintained in this plan. The two seasons have different
purposes, but each will operate within the context of a harvest limit system with an
additional season in the Glenwood Special Management Area.
1. April Lion Season: The season will run from April 1-30 annually. The use of dogs as a
hunting aid is allowed. This is primarily an additional opportunity season in locations
where harvest limits may not be routinely achieved during the regular season. If
conflicts with other resource management issues are anticipated or if harvest
opportunity is not compatible with other management considerations, then an April
season will not be initiated. The utilization of an April season is determined annually
for each harvest limit group.
2. Regular Lion Season: Begins the day after the close of 4th rifle deer and elk season
through March 31 annually. The use of dogs as a hunting aid is allowed. The bulk of
lion harvest is expected during this time and the majority of hunter days will occur in
this season. Lion hunting opportunity is unlimited during each license year until
harvest limits are reached in each harvest limit group, at which point that harvest
limit group will be closed for the remainder of the license year.
Glenwood Special Management Area: A mountain lion season concurrent with regular deer
and elk rifle seasons in GMUs 43, 44, 45, and 444 is outlined under the NW Regional plan
summary later in this document.
Methods of Take: The use of dogs shall be allowed as an aid to take lions as prescribed
within the foregoing seasons. The use of mouth-operated predator calls is allowed. Legal
rifles, shotguns, crossbows, handguns, and archery weapons are allowed. Under specific
8West Slope Mountain Lion Plan- DRAFT for online review
circumstances, as outlined in the SW and NW Regional summary sections, electronic calls will
be legal in certain harvest limit groups.
III. Regional Data Collection Scales and Monitoring Thresholds
Lions occupy large spatial scales in terms of home ranges and dispersal patterns. They
regularly live, move, and disperse across previously used DAU boundaries, CPW Administrative
Region boundaries and even state lines. Consequently, monitoring mortality and female
composition at small scales is hampered by small sample sizes and large amounts of annual
variation. At the current DAU scales on the West Slope, the difference between a few animals
of different gender or age classes could alter harvest composition and conclusions about
management trajectory in some units. For example, from 2016-2018, annual total lion
mortality was less than 40 animals for 9 out of 13 previous West Slope DAUs. When samples of
each individual DAU’s harvest were divided among the four age/gender classes (adult female,
subadult female, adult male, and subadult male) the composition of any one class often
would be represented by only 4 or 5 individual lions, causing year to year compositional
proportions to commonly vary by 20-30%. This amount of variation in harvest composition
confounds data interpretation, making it difficult for wildlife managers to evaluate the
effects of different harvest levels on mountain lion population trajectories at the previous
DAU scale.
Many lion biologists across the West suggest managing lion populations with respect to source-
sink dynamics (CMGWG 2005, Cooley et al. 2009a, Robinson and DeSimone 2011, Jenks et al.
2011, Logan 2019). Source areas are managed for the production of dispersers that move to
other source areas and into sink areas where management objectives call for greater lion
mortality. Thus, source areas retain a capacity for population resiliency region-wide. This
approach allows for considerable flexibility in applying variable harvest rates spatially and
temporally. This would be in contrast to a management framework with little flexibility
where harvest is attempted to be apportioned evenly across the landscape as outlined by
Beausoleil et al. (2013). The West Slope plan incorporates source-sink dynamics by allocating
lion harvest mortality across the Northwest and Southwest Administrative Regions at a level
appropriate for a stable population objective, while allowing harvest pressure to vary within
more local areas defined by harvest limit groups.
West Slope Mule Deer Strategy and Lion Plan Relationship
Due to recent declines in mule deer populations across the West Slope, CPW embarked on a
comprehensive public engagement and planning effort in 2014 to develop a West Slope Mule
Deer Strategy to guide future management actions to help western deer herds increase
towards objectives. The goal of the West Slope Mule Deer Strategy states that together with
the public and stakeholders, CPW will work to stabilize, sustain and increase mule deer
populations in western Colorado and, in turn, increase hunting and wildlife-related
recreational opportunities. Relative to mountain lions, one of the seven strategies outlined in
the Mule Deer Strategy is to implement lion reductions where predation has been shown to be
limiting deer survival. This West Slope lion plan provides the flexibility, if needed, to allocate
9West Slope Mountain Lion Plan- DRAFT for online review
lion harvest at the harvest limit group scale within a Region to implement higher local harvest
rates consistent with the priorities of the Strategy, while still managing to the Regional
objective.
Regional Data Analysis Units
The history of mountain lion management in Colorado, and more specifically on the West
Slope, is provided in Appendix B. This appendix includes an overview of harvest management,
methods of hunting, game damage, and a human-lion conflict discussion all within the
historical DAU-specific management structure. A map showing the 13 historic mountain lion
DAUs is also included in Appendix B.
Under this new plan, the West Slope will be comprised of two Data Analysis Units,
corresponding to the CPW Northwest and Southwest Administrative Regional boundaries
(Figure 1). The Northwest (NW) Region lion DAU is comprised of the previous lion DAUs of L-1,
L-2, L-3, L-5, L-6, L-7 along with GMU 40 (previously in L-22) and GMUs 41, 42 and 421
(previously in L-9). The Southwest (SW) Region lion DAU is comprised of the previous lion
DAUs of L-20, L-21, L-23, L-24, L-25 along with GMUs 52, 53, 63, 411 and 521 (previously in L-
9), GMUs 60, 61, 62, 64, 65 (previously in L-22), GMU 82 (previously in L-16) and GMU 83
(previously in L-19). This West Slope plan will monitor lion populations at the CPW
Administrative Region geographic scale (NW DAU and SW DAU) instead of the historic DAU
scale.
The 13 historic DAUs have existing management plans that were written in 2004, with the
exception of L-3, which was originally written in 2004 but amended in 2012. Eleven of the 13
plans have DAU population objectives of maintaining a “stable” lion population. Two of the
plans, DAUs L-7 (White River) and L-9 (Grand Mesa/ North Fork), have “suppression”
objectives that were largely implemented to reduce lion populations due to high rates of
game damage (livestock depredation). The new NW and SW Regional management objectives
will replace all historic DAU objectives in the areas governed by those 13 historic plans.
10West Slope Mountain Lion Plan- DRAFT for online review
Figure 1. The location of the two West Slope Regional monitoring areas within Colorado.
Annual Data Collection
All known lion mortalities in Colorado are recorded during a mandatory check process. In the
case of harvest mortalities, every hunter is required to report their harvest within 48 hours
and present the hide and head for inspection within 5 days. During this mandatory check,
biological data is collected including sex, evidence of past nursing/breeding status, and age
information, including extraction of a premolar for cementum aging (Table 1).
Table 1. Cementum (premolar tooth) aging guidelines
Cementum Age Age Class
0-12 months Kitten
1 year or 2 years old Subadult
3 years and older Adult
Female of any age that shows evidence of past nursing Adult
Lion mortality data are used to evaluate age and sex composition of harvest, distribution of
harvest and non-harvest lion mortalities, indices of population trajectory, and to account for
and set harvest limits. Due to standard time delays in cementum analysis, the current harvest
composition analysis is always retrospective information, lagging one harvest year behind
regulatory cycles.
11West Slope Mountain Lion Plan- DRAFT for online review
Harvest data can be used in many different ways. The age of reproductive females can be
useful to examine the reproductive potential of lion populations (Stoner 2004, Anderson and
Lindzey 2005). Populations maintaining older-age females have higher reproductive potential,
and thus resiliency, than populations where adult female survival is lower.
Additionally, recording the distribution of lion harvest and other human-caused mortalities
allows assessment of potential source areas where little or no lion mortality occurs, and sink
areas where lion mortalities may be relatively high. This kind of spatial analysis may be used
to help inform harvest limits that are established by harvest limit groups.
As recommended by Beausoleil (2017), we approached all demographic metrics referenced in
this management plan with standardization in mind. Since most recent literature focuses on
metrics defined by “independent” lions, that is the common standard we have used in all
data, thresholds, and models presented in this plan. Independent lions are defined as animals
that are not dependent on their mother; this includes subadult lions and adult lions. See
Appendix A for details on mountain lion life history. Kittens are considered dependent lions,
and as such are not legal for harvest and are not included in demographic metrics.
Adult Female Composition Threshold
Both the survival rate and relative abundance of adult female lions, as the reproductive
component of a population, are important considerations for managers. Recent research
findings are presented below reviewing adult female harvest composition and population
trajectory.
Wildlife managers, through the use of hunting harvest, have the ability to limit lion
population growth (Robinson and DeSimone 2011). On the Uncompahgre Plateau, Colorado,
during the 5-year lion hunting phase of a research project, adult females comprised 23% of
the total cumulative harvest. In this study, lion harvest was considered additive mortality and
lion survival rates and independent lion abundance declined when compared to the preceding
reference phase with no lion hunting (Logan 2015, Logan and Runge 2020).
In the Garnet Mountains of Montana, lion hunting harvest was found to be an additive source
of mortality, not a compensatory one. During an un-hunted period, 71% of the growth rate in
the population was related to reproduction (maternity and kitten survival), while adult
female survival accounted for only 22% of the population growth rate. When hunting was
added, only 17% of the growth rate in the population was related to reproduction, while adult
female survival became more influential and accounted for 40% of the population growth
rate. Monitoring and population modeling efforts in this population indicated that when
accounting for all forms of known human-caused mortality, adult female mortality greater
than 20% is likely to cause a decrease in the resident lion population level (Robinson and
DeSimone 2011).
In southern Idaho and northern Utah, Laundre et al. (2007) tested the effects of changes in
prey abundance on lion population dynamics. Through their monitoring of the change in
12West Slope Mountain Lion Plan- DRAFT for online review
population size and social-age class structure, they suggest that an annual harvest of 15 to
20% of resident (adult) females would not reduce a population.
Anderson and Lindzey (2005) conducted an experimental population reduction and recovery in
the Snowy Range of Wyoming to examine how various gender and age classes are exposed in
hunter harvest when a population is increasingly exploited. Because of the differences in daily
movement distances it was assumed that under equal gender ratios, males are more
vulnerable to hound hunting, which relies on discovery of tracks in snow. Increasing hunting
pressure exposes different genders and age classes until they are relatively less available,
subsequently exposing the next most vulnerable age class. Sex and age classes of lions exhibit
different and relatively predictable movement patterns, where males move longer distances
than females and subadults generally move longer distances than adults (Barnhurst 1986,
Anderson 2003). Conceptually, the likelihood of a specific sex or age class of lion being
harvested would reflect its relative abundance in the population and its relative vulnerability
based on daily movement patterns. The least vulnerable individuals (adult females) should
become prominent in the harvest only after the population has been reduced in size by
removal of more vulnerable/available lions. Harvest progression of a higher density
population would be expected to shift from subadults to adult males and finally to adult
females as more vulnerable or targeted individuals are removed and the population is reduced
in size (Anderson and Lindzey 2005). Selectivity in harvest where hunters select males over
females or perhaps subadults is possible from experienced hunters using hounds by examining
track characteristics or live animals prior to harvest. Selective harvests may delay or change
the order of expected harvest progression, but this relationship should still hold as larger
males are removed and the least vulnerable and most biologically important compositional
class (adult females) becomes exposed as abundance of other more selected age/sex classes
decline. Anderson and Lindzey (2005) tested these predictions by applying varying levels of
hunter harvest and found harvest composition to be predominantly subadults for a high-
density population with low harvest levels, shifting to adult males as harvest levels increased,
and then a shift from adult males to adult females with continued high harvest as the
population declined. Likewise, Cooley et al. (2009b) noted that adult females increased in
harvest composition when hunting increasingly removed other age/sex classes in a population.
When harvest levels were reduced, the composition of the harvest returned to primarily
subadults. The male segment of the reduced population recovered within 2 years, primarily
due to male immigration from other populations and the female segment within 3 years from
an increased number of females producing young within the population (Anderson and Lindzey
2005). They concluded that the population appeared to support a harvest composed of 10-15%
adult females. When adult female composition in hunter harvest reached approximately 25%,
the population declined.
The results of these studies suggesting that setting Regional composition thresholds of
between 20-25% adult females in hunter harvest will maintain the Region goals of managing
for a stable population. A threshold of 22% adult female harvest composition was selected
because it represents a mid-range value based on 4 independent research efforts. Using
cementum data and breeding status to classify adult females, we can infer that if our
13West Slope Mountain Lion Plan- DRAFT for online review
threshold is exceeded, the population in question would likely begin a decline. Because the
goal is to not exceed this threshold and risk moving into a decline phase, adult female harvest
composition will be examined annually and management actions will be enacted to reduce
female and/or overall harvest if this threshold is exceeded in any single year.
Currently, at our new Regional monitoring scales, the composition of adult females in total
harvest over the last 6 years has ranged from 9-20% in the NW Region and 14-18% in the SW
Region (Table 2). These statistics suggest that even under increasing harvest levels over this
period, neither Regional population has undergone a decline. In accordance with this plan,
data will be evaluated annually to inform Regional management, but voluntary female and
overall harvest reduction steps will be required only if the monitoring threshold of 22% is
exceeded. The Glenwood SMA, described in greater detail in the NW Summary section, is the
only area excluded from the annual harvest composition analysis in either Region.
Table 2. Northwest and Southwest Regional adult female harvest composition and
sample size of interpreted age class (N) for the last 6 years (2013-2018). Data include
all legal harvest mortalities for lions of known sex/age for all GMUs in each region.
2013 2014 2015 2016 2017 2018
Adult Female
Northwest Composition in Total
Region Harvest 20% 9% 16% 17% 19% 17%
N 172 163 172 201 203 205
Adult Female
Southwest Composition in Total
Region Harvest 14% 14% 18% 17% 16% 16%
N 107 118 115 141 125 131
It should also be noted that less selective methods of harvest are likely to result in harvest
composition that reflects the relative abundance of the 4 age-gender classes. Consequently,
significant use of non-selective methods at any broad scale will confound harvest composition
analysis. Hound harvest relies on a portion of hunters selecting against taking females based
on track size or identification while bayed, but non-selective methods take lions of each
compositional class in the same relative abundance that they are encountered, so much
higher rates of female harvest would be expected. Because of this, we conclude that any
other season or method of take besides hound hunting (such as electronic calls) that is largely
non-selective of age-gender classes should be reserved only for areas where substantially
increased harvest and population impact is desired. This would include the Glenwood SMA or
areas where control removals are high but hound hunter harvest has not been successful due
to limited snow. The use of concurrent deer and elk rifle season hunters in the Glenwood SMA
would also likely increase adult female harvest, as this non-selective hunting method has
been shown in Oregon and Washington to have higher female harvest rates when compared to
hound hunting. A further discussion on these implications is presented in the “Methods of
mountain lion hunting” section in Appendix B.
14West Slope Mountain Lion Plan- DRAFT for online review
Total Human-Caused Mortality Threshold
Clarification of terminology is an important precursor to the discussion of the total human-
caused mortality threshold. Natural forms of mortality (drowning, starvation, disease,
intraspecific strife, injury etc.) are sometimes documented by our mandatory check system,
but such natural mortality will not be included in the total human-caused mortality analysis.
The primary human-caused mortality factors includes hunter harvest, removal of depredating
lions by CPW, landowner, and federal Animal and Plant Health Inspections Service/Wildlife
Services agents (APHIS/WS), and lions killed by vehicles. The single human-caused mortality
exception for inclusion in the summation of mortality is for lions that are killed because they
are determined to be dangerous lions pursuant to CPW Administrative Directive W-20. Our
reasoning for not including these kills in our calculations related to mortality thresholds is
that regardless of lion population trajectory or any other management condition, CPW as a
matter of policy would always take lethal action on lions that are determined to be a threat
to public safety. Therefore, including them in calculations of total mortality thresholds is
irrelevant. Additionally, the number of lions that are killed because they are determined to
be dangerous is typically a very small number. For example, from 2016-2018 less than 10 lions
annually were reported killed statewide as a result of having attacked or exhibited
threatening behavior towards people. Lions removed in accordance with Administrative
Directive W-20 are specifically documented as such to ensure conflict lion mortalities with
this classification are clearly enumerated, as they will be excluded from analysis in all
mortality totals.
Comparing the rate of population growth against population reduction from harvest can give
managers information on what mortality levels would maintain a stable population. Recent
research findings are presented below that helped inform CPW’s total human-caused
mortality threshold.
The growth rate for a population, or intrinsic rate of population growth, can be described as
the rate biologists expect a population to grow in the absence of additive human-caused
mortality. In Washington, the intrinsic growth rate for 3 different lion populations (Selkirk
Mountains, Kettle Falls, and Cle Elum) was 14% (+-2%) (Beausoleil et al. 2013). In Montana,
the expected intrinsic growth rate of a modeled population through 2 years was 15% when
the results from a protected area and an adjacent hunted area were combined (Robinson and
DiSimone 2011). Laundre et al. (2007) observed a lion population increase 7% during a growth
phase that correlated with an increasing deer population on the border of Idaho and Utah. In
New Mexico, Logan and Sweanor (2001) observed population growth rates of 5% and 17% for
two 4-year periods, averaging 11% for the entire 7-year period for a lion population segment
protected from hunting. Furthermore, Logan and Sweanor observed higher growth rates of
21% to 28% for an experimentally manipulated population segment that was substantially
reduced in abundance and then protected to allow it to increase. Their research indicates
that lion population growth rates are highly variable and most likely density dependent
(Logan and Sweanor 2001).
15West Slope Mountain Lion Plan- DRAFT for online review
Examined differently in Wyoming, experimental control and recovery of a population
determined that a harvest rate of 18% of independent lions allowed recovery of the
population that had been intensively harvested in two previous years (Anderson and Lindzey,
2005). On the Uncompahgre Plateau in Colorado, a lion population that was protected from
hunting for five years and subsequently subjected to regulated hunting for five years yielded
evidence that the marked lion population grew during the non-hunting period when total
human-caused annual mortality was 7% or less and began to decline when total human-caused
annual mortality was 27% and continued to decline at rates of 24-29% (Logan and Runge 2020;
these are preliminary results and will be finalized at publication). The discrete threshold at
which population decline began could not be measured.
Although growth rates and mortality or harvest rates in expanding populations may act as
surrogates for determining maximum sustained yield (the highest sustainable annual rate of
removal), caution should be applied in this comparison. Stochastic events can change the
assumed population size and may result in over-harvest, and thus are falsely assumed to be
supported over the longer term (Caughley and Sinclair 1994).
Whether one looks specifically at Colorado data or examines the span of the 6 reported
population growth rates and 3 reported mortality thresholds, a 16-17% annual total mortality
rate is an appropriate range to manage for population stability. Therefore, this plan will use a
maximum human-caused mortality threshold of 17% of Colorado’s projection of possible lion
abundance. This extrapolated lion abundance index is based on a resource selection function
(RSF) model that was applied to each Region (Table 3 and Appendix C) to generate an initial
representation of how many lions could be in the population.
Adjustments to this human-caused mortality threshold is informed by the adult female
compositional threshold. Direction of population trajectory as indicated by annual
compositional evaluation provides a feedback mechanism to modify the common currency of
human-caused lion mortality, which are harvest limits.
The RSF model that Colorado has developed provides a probability of lion presence across
areas of each Region and allows application of various densities to those probability classes to
generate a projection of possible lion abundance. The abundance index extrapolation that is
generated is not a representation of actual population size of lions in Colorado, but rather the
relative probability of resource selection by a lion population. It provides a method to derive
a maximum mortality threshold, which if exceeded, would lead to the reasonable conclusion
that lion populations are experiencing a decline in trend at selected monitoring scale. The
numerical value that is derived as a threshold from this analysis will not be exceeded on a 3-
year running average in either Region. While not necessarily a management target, the total
mortality threshold represents the amount of human-caused mortality that should not be
exceeded annually in each Region. For more information about the abundance index
extrapolation and the supporting RSF model as applied to the NW and SW Regions, see
Appendix C.
16West Slope Mountain Lion Plan- DRAFT for online review
Table 3. Regional total human-caused mortality thresholds in relation to 2016-2018 total human-caused
mortality data. The Regional mortality threshold for the NW Region does not include lion population or
mortality contributions from the Glenwood Special Management Area (GMUs 43, 44, 45, 444). Historic
mortality data for the SMA is provided on a separate line.
17% Annual 3-year
Total 2016 Total
Human- Total 2017 Total 2018 Total Human-
Caused Human- Human- Human- Caused
Mortality Caused Caused Caused Mortality
Monitoring Area Threshold Mortality Mortality Mortality Average
Northwest Region 269 228 232 245 235
Glenwood SMA NA 27 11 22 20
Southwest Region 284 180 168 184 177
The total mortality thresholds in Table 3 may or may not change over the lifespan of this
West Slope Mountain Lion Management Plan. Thresholds may change during the course of
revisions based upon new scientific evidence, density estimates that refine the RSF or related
updates that may occur during periodic plan review. Colorado Parks and Wildlife hopes to be
able to prioritize lion density estimation in future work planning to allow validation and
refinement of densities applied to the RSF. The Glenwood SMA, which is described in greater
detail in the Northwest Region Summary section, will be the only area excluded from annual
threshold requirements in either Region. More specific historic data on harvest and non-
harvest mortality is available in the Regional Summary sections of this document and in
Appendix B; History of Mountain Lion Management in Colorado.
IV. Annual Management Thresholds
The West Slope Lion Management Plan initiates a new management framework that evaluates
annual lion mortality data against selected thresholds that are scientifically supportive of a
stable lion population. The NW and SW Administrative Regions will be independently
managed, and the Glenwood Special Management Area is excluded from evaluation against
the NW thresholds. The following mortality monitoring thresholds will be evaluated in an
interactive manner:
1. Proportion of adult female (cementum age of 3 years or older, or any age with
evidence of nursing) composition of total hunter harvest will not exceed 22% in any
single year.
2. Total human-caused mortality will not exceed 17% of the extrapolated abundance
index (see RSF in Appendix C and Table 3) based on a 3-year running average.
17West Slope Mountain Lion Plan- DRAFT for online review
3. The adult female composition threshold and total human-caused mortality threshold
are intended to interact and inform each other. Therefore:
a. If the 22% adult female threshold is exceeded in any single year (suggesting a
decline in the population) the Regional harvest limit objective (and mortality
threshold) used in that year will be reduced by 1% of the extrapolated
abundance index. This represents a decrease from 17% to 16% of the RSF or 16
lions in the NW Region and 17 lions in the SW Region. This is required and
implemented in Regional harvest objective setting in the following year.
b. If the 22% adult female threshold is exceeded in any single year, CPW will also
enact a voluntary female harvest reduction outreach process that includes:
i. Publishing a request for hunters to voluntarily reduce female harvest in
the CPW Mountain Lion Hunting brochure.
ii. Notifying hunters using the online Available Harvest Limit Report to
identify harvest limit groups where CPW is voluntarily asking for
reductions in female harvest.
iii. Contacting lion hunters directly to inform them of the voluntary
request.
4. If the total human-caused mortality threshold is exceeded or the 22% compositional
threshold (subsequent to steps 3a and 3b the first year) continues to be exceeded,
then a 5% reduction in the Regional harvest objective will be implemented the
following year. The human-caused mortality threshold continues to be independent of
the female composition threshold.
5. Each time a reduction in Regional harvest objective is triggered by exceeding
thresholds, the broad intention is that this reduction will be maintained for a minimum
of 3 years. In some cases, if the annual female composition or 3-year average total
mortality return to levels below the thresholds before that time, increases may be
considered.
Annual Regional harvest objectives, explained in the West Slope Regional Summaries section
of this plan, incorporate projected non-harvest human-caused mortality using previous 3-year
averages in development of acceptable harvest mortality levels so as not to exceed
thresholds. As such, Regional harvest objectives will always be lower than total human-caused
mortality thresholds and will likely fall in or near the annual harvest range of 12-16%,
bracketing the 14% harvest off-take level as recommended by Beausoleil et al. (2013).
Voluntary Female Harvest Reduction Outreach
If the adult female composition threshold of 22% is exceeded, the first action should be to
reduce adult female harvest. While differentiating subadult females from adult females before
harvest may be difficult, Colorado’s lion hunters have a proven track record of being able to
decrease harvest pressure on females when CPW has provided the outreach and information
accompanying voluntary female reduction requests.
18West Slope Mountain Lion Plan- DRAFT for online review
From 2005-2007, CPW, in collaboration with hound hunting groups, conducted training
workshops about the biology and life history of mountain lion as well as the importance of
females to sustaining populations. The lion regulation brochure also provided similar written
information. In the 2007-2008 lion season, CPW implemented a mandatory mountain lion hunter
education requirement. This course provides training information to hunters about mountain
lion ecology and hunters must pass an exam demonstrating the ability to identify lion gender
characteristics. Subsequently, the average total female composition in harvest declined from
about 44% in the 10 years before 2005 to about 37% in the 14 years since. It is important to note
this was a reduction in all female age classes, not just adults. As part of this West Slope plan,
CPW intends to engage with lion hunters via the brochure, the online harvest limit report, and
make informal field contacts to request voluntary reductions in female harvest if and when
Regional annual adult female composition exceeds the 22% threshold. It would not be practical
to ask for reductions just in adult females since age class determination in the field is much
more challenging than gender determination. This outreach would likely decrease overall
female harvest (all ages), but adult females would be part of that reduction, and we expect
this to move composition trajectory in the desired direction.
Harvest Limit Reductions
Harvest limit reductions of 5% will be applied to the Regional harvest objective total in the
regulatory cycle immediately following management thresholds being exceeded, as outlined
above. Any such reduction in Regional harvest objective due to exceeding either threshold,
outside of the Glenwood SMA, is mandatory and is a reduction minimum. Each time a reduction
is applied to the Regional harvest objective, it will generally be maintained for 3 years. There
may be cases where the 3-year total mortality or annual adult female compositional proportion
returns below the management threshold before that time where increases in Regional harvest
objectives will be considered. Nothing precludes managers from implementing larger reductions
of Regional harvest objectives and limits that are determined desirable or necessary to
accelerate the lion population response.
The management steps CPW will take are based on empirical data in previously observed
populations and on models developed in Colorado. The following section presents an
evaluation quantifying Regional areas of minimal lion mortality and outlining the extent of
source areas (Figure 2) and large-scale lion resiliency to harvest. Further, the application of
monitoring thresholds is appropriate to guard against longer term impacts to populations on
the West Slope and ensure population stability at that scale.
V. Lion Population Resiliency
Resiliency to High Mortality
Mountain lions have biologically hardwired behaviors in dispersal for maximizing genetic
interchange that also serve to make populations resilient against high exploitation or rates of
removal. Natural replacement of mortalities or otherwise vacated home ranges occurs
differently between male and female lions. Vacated ranges of resident females are typically
re-occupied by their independent-age daughters, adjacent resident females, and some
19West Slope Mountain Lion Plan- DRAFT for online review
immigrant females (Laing and Lindzey 1993, Logan and Sweanor 2001). In contrast, male
dispersal from natal areas appears to occur regardless of resident adult male densities
(Hemker et al. 1984). Consequently, vacated ranges of resident males are typically re-
occupied by immigrant males, some coming from long distances. Logan and Sweanor (2001)
noted this in New Mexico and numerous studies have noted the long distances of dispersing
lions as well as the sex bias in dispersal distance (Anderson et al. 1992, Ken Logan, CPW,
personal communication 2018).
Source Population Refuges
In several studies, lion populations subjected to temporary intensive exploitation by > 40%
over 1 to 6 year periods have been demonstrated to recover within 3 to 5 years (Ashman
1976, Logan and Sweanor 2001, Anderson and Lindzey 2005, Robinson et al. 2008, Logan
2015). In two such studies, the lion populations were completely protected from hunting
(Logan and Sweanor 2001, Logan 2015). It is also important to understand that in addition to
reductions in human-caused mortality, recovery was facilitated by immigrants coming from
proximal source areas (Logan and Sweanor 2001, Anderson and Lindzey 2005, Robinson et al.
2008, Cooley et al. 2011). These results confirm that with adequate source populations in
sufficient proximity to provide dispersal immigration combined with native recruitment, lion
populations can be resilient when localized harvest rates exceed recruitment (Anderson and
Lindzey 2005, Robinson et al. 2008, Cooley et al. 2009a, Cooley et al. 2011). These
observations about lion resiliency and ability to rely on adjacent source populations are
derived from research areas that range in size from the average GMU in Colorado (~1,500 km2)
to the largest GMU at about 7,500 km2. The management thresholds of this plan will be
monitored at a large, regional scale; therefore, if the thresholds are exceeded and are
unmitigated, then longer-lasting negative impacts to the lion population should be expected.
At this scale, male immigration is likely to be capable of re-occupying vacant habitat. In
contrast, female immigration would likely occur initially along the boundary with adjacent
Regions or adjacent states if intensive lion mortality is not also occurring in those locations.
Some amount of female immigration may occur also from refuge areas within Regions (ie.
areas of high quality lion habitat with limited harvest as a result of land ownership or other
restrictions of access), but this alone may not be sufficient to support continued mortality in
excess of sustainable levels.
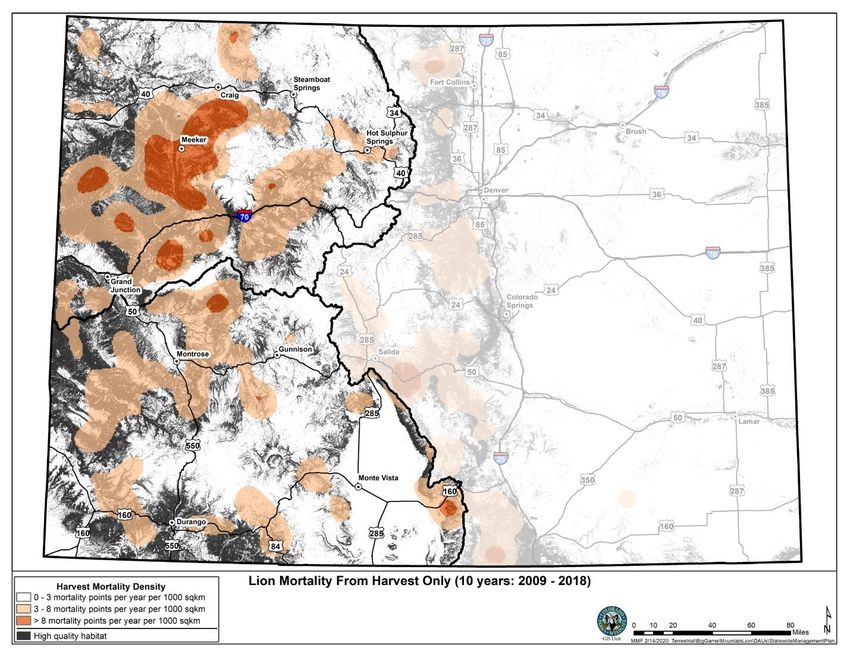
The following map of Colorado’s West Slope (Figure 2) shows what could be considered refuge
zones or source areas where lion harvest is low to non-existent. Using the same RSF (Appendix
C) habitat model employed within this document in developing Regional total mortality
thresholds, we compared the top 50% of lion habitat in the NW and SW Regions to the most
recent 10 years of lion harvest mortality. All lion harvest mortalities from 2009-2018 were
mapped and a mortality surface was created using ArcGIS, delineating a surface with more
than 3 harvest mortalities per 1,000 km2 per year. Areas of the West Slope that fell below this
threshold were considered as having no significant level of harvest (0-3 harvested
lions/1,000km2/year)(Table 3). For comparison, Wyoming’s statewide management plan
considers a “source” hunt area to have an annual human-caused mortality level of below 5
lions/1,000 km2, and defines a “stable” hunt area as having annual human-caused mortality
20West Slope Mountain Lion Plan- DRAFT for online review
between 5-8 lions/1,000 km2(Wyoming Game and Fish Department, 2006). As shown in Figure
2 and Table 4, only a small fraction of lion habitat on the West Slope exceeds an annual
harvest of 8 lions/1,000 km2. In fact, less than 15% of the high-quality habitat in the NW
Region and only 1% of the high-quality habitat in the SW Region meet the qualification that
Wyoming uses to classify a population “sink” (>8 lions/1,000 km2/year). Even if this analysis
expands to consider all mortality sources beyond harvest, the proportions in each
classification do not change significantly.
The 46,844 km2 of higher quality lion habitat as generated from the top two strata in the RSF,
was overlayed with a harvest mortality surface to evaluate the total amount of quality lion
habitat on the West Slope of Colorado where no significant lion harvest occurs. The area of
quality habitat with modeled moderate to higher lion densities and yet a low or non-existent
level of harvest totaled 22,850 km2 or over 5.6 million acres across the NW and SW Regions
(Figure 2 and Table 4). This includes high-quality habitat within National Parks and
Monuments, Bureau of Land Management Wilderness areas, protected municipality open
spaces and natural areas, areas with little significant snowfall making lion harvest difficult,
and large tracts of unhunted private land.
Table 4. Comparison of high quality lion habitat in each Region and harvest density.
Total High Quality Total High Quality
Habitat with ≤ 3 Habitat with >8
Total High harvested harvested
Quality lions/1000 lions/1000
Lion km2/year km2/year
Total Area Habitat “source zone” “sink zone”
Northwest
Region: 58,910 km2 24,234 km2 9,265 km2 3,576 km2
Southwest
Region: 64,678 km2 22,610 km2 13,585 km2 261 km2
21You can also read