Management's Discussion & Analysis - Financial period ended January 31, 2021 Containing information as of March 12, 2021 - Newfoundland ...
←
→
Page content transcription
If your browser does not render page correctly, please read the page content below
Management’s Discussion & Analysis
Financial period ended January 31, 2021
Containing information as of March 12, 2021
-2-

Caution Regarding Forward-Looking Information
Certain of the statements made and information contained herein and in the financial statements
are “forward-looking information” or “forward-looking statements” within the meaning of the
Securities Act (British Columbia). This includes statements by the Company concerning
exploration results, including deposit size, quantities, grades and contained metals, which are
generally based on estimations and extrapolations from a limited number of samples, drill holes
and assays. These estimations and extrapolations are subject to uncertainties, which include but
are not limited to uncertainties in evaluating a deposit until the deposit has been extensively drilled
on closely spaced intervals. Should one or more of these underlying estimations or extrapolations
prove incorrect, actual results may vary materially from those described in forward-looking
statements.

Forward-looking statements contained herein also include the Company’s future operating costs
and exploration plans at its mineral properties. These involve known and unknown risks,
uncertainties and other factors which may cause the actual results, performance or achievements
of the Company to be materially different from any future results, performance or achievements
expressed or implied by such forward-looking information. Forward-looking information is subject
to a variety of risks and uncertainties which could cause actual events or results to differ from
those reflected in the forward-looking information, including, without limitation, the ability of the
Company to continue to be able to access the capital markets for funding necessary for operating
costs, to acquire and maintain exploration properties and to carry out its desired exploration
programs; difficulties in executing exploration programs on the Company’s proposed schedules
and within its cost estimates, whether due to weather conditions in the areas where it operates,
increasingly stringent environmental regulations and other permitting restrictions, or the
availability of essential supplies and services; and factors beyond the capacity of the Company to
anticipate and control, such as the marketability of minerals, government regulations relating to
health, safety and the environment, and the scale and scope of royalties and taxes on production.
Should one or more of these risks or uncertainties materialize, actual results may vary materially
from those described in forward-looking statements.

Accordingly, readers are advised not to place undue reliance on forward-looking information.
Except as required under applicable securities legislation, the Company undertakes no obligation
to publicly update or revise forward-looking information, whether because of new information,
future events or otherwise.

Description of Business
Great Thunder Gold Corp. (the “Company” or “Great Thunder”) is a junior exploration company
incorporated under the laws of the Province of British Columbia, Canada and whose common
shares are listed on the Canadian Securities Exchange. Its principal business is the exploration
for minerals and the development of its gold and lithium projects located in Quebec, Canada and
British Columbia. Great Thunder is in the exploration stage and has not yet determined whether
these properties contain mineral reserves that are economically recoverable.

The following discussion and analysis of the operations, results and financial position of Great
Thunder should be read in conjunction with the condensed interim financial statements as of and
for the period ended January 31, 2021 and the notes thereto (the “financial statements”). The
financial statements are incorporated herein by reference.
-3-

The financial statements have been prepared in accordance with International Financial Reporting
Standards (“IFRS”) and unless otherwise cited, references to dollar amounts are Canadian
dollars. The financial statements were prepared on a going concern basis, which presumes the
realization of assets and the discharge of liabilities in the normal course of business for the
foreseeable future. The Company had working capital of $4,416,943 as of January 31, 2021 and
has accumulated losses of $15,393,574 since incorporation. The Company’s ability to meet its
obligations and maintain its operations is contingent upon additional financing or profitable
operations in the future.

Overall Performance and Discussion of Operations
Third Quarter Results
During the third quarter of its 2021 financial year, the Company experienced a net loss of
$333,798. This represents an increase of $155,131 over the $178,667 loss in the same quarter
last year. This increase was caused primarily by a $193,664 increase in investor relations costs
as a result of a comprehensive promotional campaign initiated to introduce investors to the
Company and its exploration projects in Quebec (see Description of Properties). In addition,
consulting fees and legal fees increased by $49,076 and $30,917, respectively, over the same
period last year. Offsetting this increase in expenses somewhat was a decrease in the loss on
the settlement of debts of $118,860 not repeated in the current year.

Nine-Month Results
During the first nine months of its 2021 financial year, the Company had a net loss of $2,055,319.
This represents a $1,798,750 increase over the $256,569 loss during the same period last year.
The bulk of this change was caused by a $1,241,078 increase in non-cash share-based
compensation expense in respect of stock options granted during the period. The Company
utilizes the Black-Scholes Option Pricing Model to compute the fair value of stock options and
during periods of high historical volatility in stock prices, this valuation method is known to yield
extraordinary results. Management does not expect this to recur in the foreseeable future. In
addition, consulting fees increased by $259,466 during the period and investor relations costs
increased by $316,698. Tempering this increase somewhat, was a $115,205 increase in non-
cash flow-through recovery relating to the derecognition of a flow-through share premium and a
decrease in the loss on the settlement of debts of $118,860.

Cash Flow
As of January 31, 2021, the Company had cash and cash equivalents of $4,546,909 as compared
with cash of $1,608,454 at the beginning of the financial year, an increase of $2,938,455. During
the nine-month period, the Company used $1,675,239 of cash for its operations and $396,427 for
the acquisition and exploration of its exploration and evaluation assets, and received $5,010,121
from four private placements undertaken during the period. A breakdown of exploration
expenditures for the period on a property-by-property basis, as well as for the preceding financial
year, is provided in note 7 to the financial statements.

General
As of January 31, 2021, the Company had no contractual obligations, such as long-term debt,
capital lease obligations, operating leases or purchase obligations, except as described in the
financial statements, nor did it have commitments for capital expenditures. Refer to note 12 to the
financial statements.

Despite recent volatility, gold prices are historically strong and equity markets remain positive for
exploration companies like Great Thunder. Management expects gold prices to stabilize in the
-4-

medium term and rise in the long-term, so the Company plans to aggressively explore its core
portfolio of mineral properties.

Current global uncertainty with respect to the COVID-19 pandemic and its effect on the Canadian
economy and financial markets may have significant and still-unpredictable effects on the
Company. While the impact remains unknown, spread of the virus may have a material adverse
effect on economic activity and could affect exploration plans, disrupt metals and financial
markets, and affect other factors relevant to the Company.

Summary of Unaudited Quarterly Results
                                        2021                                           2020                            2019
                           3rd Quarter 2nd Quarter 1st Quarter    4th Quarter 3rd Quarter 2nd Quarter 1st Quarter   4th Quarter
Revenue                    $         -$          -$          -    $         - $         - $         - $         -   $         -
Loss for the period         (333,798) (1,521,157) (200,364)        (148,774) (178,667)       (53,184) (24,718)       (105,066)
Loss per share                  (0.01)      (0.05)      (0.01)         (0.01)      (0.01)      (0.00)      (0.00)        (0.01)
Total comprehensive loss    (333,335) (1,521,764) (197,904)        (149,227) (178,224)       (53,200) (24,193)       (105,197)

Variations in loss from quarter to quarter typically result from increases or decreases in
exploration and business activity. During periods of greater activity, such as the first three quarters
of 2021 and the fourth quarter of 2020, consulting fees, investor relations expense, office and
administrative costs, and regulatory approval costs will typically increase.

In the first two quarters of 2020, losses declined because of measures taken by management to
reduce costs. However, during the third quarter of 2020, the loss for the period increased when
the Company recorded a $118,861 non-cash loss on the settlement of debts. During the second
quarter of 2021, the Company recorded a $1,241,078 non-cash share-based compensation
expense relating to the grant of stock options.

The differences between loss for the period and total comprehensive loss are the result of non-
cash unrealized gains and losses on investments and reclassification to profit and loss upon
realization.

The quarterly results summarized herein were prepared in accordance with International Financial
Reporting Standards and are expressed in Canadian dollars.

Liquidity and Capital Resources
The Company does not yet generate positive cash flow from operations and is therefore reliant
upon the issuance of its own common shares to fund its operations.

As of the January 31, 2021 period end, the Company was adequately funded for the short- and
medium-term. Mineral exploration is capital intensive, and to carry out its longer-term exploration
plans the Company must raise additional equity capital, though there is no certainty that such
financings will be completed.

The Company is able to meet all of its ongoing financial obligations as they become due. It has
no debt obligations and no commitments other than as described herein and in its financial
statements. Management believes that the Company has sufficient working capital to fund
operating costs through at least January 2022.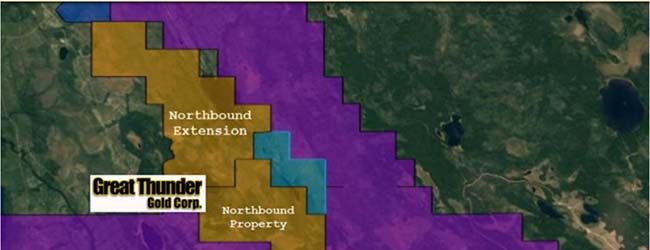
-5-
Description of Properties
Northbound Property
In February 2020, the Company optioned the Northbound gold property and in March and July
2020 expanded the property by purchasing additional, adjoining claims. In September 2020, the
Company exercised its option and acquired a 100% interest in the Northbound property.
The Northbound gold
property, contiguous to the
northwest of the Wallbridge
Mining Company Ltd. Fenelon
Gold Deposit, is located
approximately 85 kilometres
northwest of the town of
Matagami in northern Quebec,
Canada. The Northbound
property totals 56 mineral
claims covering approximately
3,076 hectares.
The Northbound property is
underlain by Jeremie Pluton,
an intrusive body becoming
increasingly important at the
contiguous Wallbridge
Fenelon property. Wallbridge
exploration in 2019 tested strike extensions of known mineralization from the metasediments and
metavolcanics and gabbro into the Jeremie pluton. Wallbridge drilling to date has confirmed the
extensions of the gold-bearing mineralized zones well into the pluton and the zones appear to be
open further into the pluton. Great Thunder cautions investors that mineralization on the
Wallbridge Fenelon property is not necessarily indicative of similar mineralization on the Great
Thunder Northbound property.
The Northbound property optionors recently completed a Long Wave InfraRed (“LWIR”) survey
over the Northbound property. LWIR utilizes the long wave infrared bands on the Aster Satellite
to penetrate through vegetation into the top 30 to 60 centimetres of the earth’s surface. While the
long wave data is readily available, the algorithms to process the data are proprietary. The survey
measures the individual mineral reflectance spectroscopy of the various constituent minerals
against known standards to highlight anomalies within the area surveyed. The Aster data comes
in predetermined sheets, so the data included much of the surrounding area including the ground
underlying the Wallbridge Fenelon property.
The resulting plots for each of the 16 end members identified in the survey were examined for
anomalies on the Northbound property. Anomalies were also examined on the Wallbridge
Fenelon property to compare and contrast against the Northbound property. Three key
conclusions were drawn from the LWIR:
While the Fenelon deposit shows a rather muted response under the LWIR, at least one of
the key minerals share similar responses at Fenelon and on the Northbound claim block,
hematite.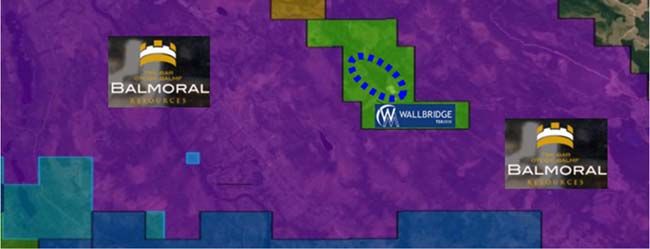
-6-
The LWIR is suggesting a multi-element area of anomalous responses in the southern portion
of the Northbound claim block: chalcopyrite, quartz and to a lesser extent alunite and
pyrrhotite.
The pyrrhotite and the tourmaline responses also appear to show coincidental major and
lesser anomalies within the Northbound claim block as well.
The strong coincidental chalcopyrite, quartz and alunite anomalies within the southern portion of
the Northbound block are a high priority target and will form the initial focus of the Great Thunder
exploration program.
Great Thunder cautions that coincident LWIR anomalies on both the Northbound property and
the Wallbridge Fenelon property are not necessarily indicative of similar mineralization on the
Northbound property.
In July 2020, the Company completed an airborne survey of the Northbound Property. A total
distance of 853 line-kilometres of airborne magnetic survey was flown on 50-metre line spacings.
Airborne magnetic was chosen on these property areas to target magnetic responsive structures
representing shear zones with quartz. The geophysical data is being analyzed and interpreted for
further exploration.
R. Tim Henneberry, P.Geo. (British Columbia), a consultant to Great Thunder Gold Corp., is the
qualified person who has reviewed and approved the technical content herein on behalf of the
Company.
Southern Star Property
In June 2020, the Company purchased the Southern Star property located approximately 70
kilometres northwest of the town of Matagami in northern Quebec, Canada. The property consists
of 222 mineral claims covering approximately 12,322 hectares near the Company’s Northbound
Property.
The Southern Star property is mainly underlain by the Brouillan-Fenelon geological group, which
is made up of felsic to mafic volcanosedimentary rocks. The Bapst Fault marks the contact
between the Brouillan-Fenelon Group and the Brouillan intrusive in the southwest portion of the
property. The Grasset Fault also crosses in part to the northeast of the property.
The Bapst Fault runs northwest-southeast through the southwest part of the property. In the
southwest section of the property, there was a historic silver intercept (SG3-1) along the Bapst
Fault. The intercept returned 5.6 g/t silver over 1.4 metres and 5 g/t silver over one metre within
drill holes (Mercier et al., 1996). This silver intercept was targeted within an area of conductor
anomalies and a VTEM target identified by Midland Exploration in 2017.
There are two additional distinct electromagnetic (“EM”) targets located on this property and it
covers 11 kilometres along the extension of the Lower Detour Fault. There has been little historical
work to test these different targets on the property, yet.
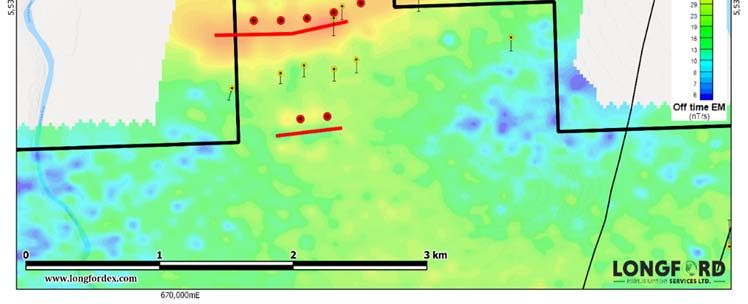
In July 2020, the Company completed an airborne survey of the Southern Star Property. A total
distance of 1,496 line-kilometres of airborne magnetic and electromagnetic survey was flown on
100-metre line spacing. The geophysical data was analyzed and interpreted by Mr. Joel Dubé, P.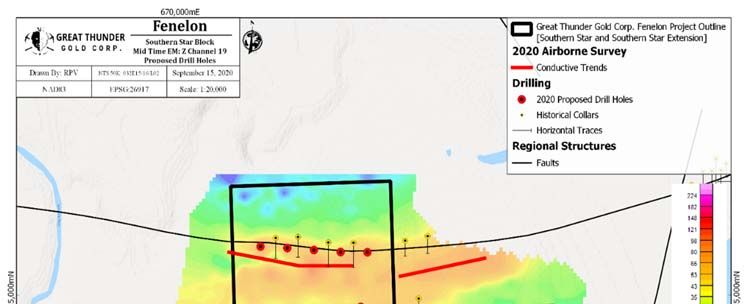
-7-

Eng., a geophysics specialist of Dynamic Discovery Geoscience Ltd., and a detailed target
characteristic report was compiled.

In February 2021,
the Company signed
a drilling contract
with Diafor Inc. of
Abitibi, Quebec. The
contract is for a
minimum of 2,000
metres and may be
extended if required.
This reconnaissance
drill campaign is
targeted to follow up
on three parallel
electromagnetic
conductors identified
in 2020’s airborne
survey.

The targets are in
the north part of the
Southern           Star
Property and that
area has seen only
limited drilling. The
targets to be drilled are located approximately 9 kilometres south of Wallbridge Mining’s Tabasco
and Area 51 gold zones.

Donald Théberge, P.Eng., M.B.A., a Qualified Person within the meaning of National Instrument
43-101, has reviewed and approved the technical contents herein.

Valentine Mountain Gold Project
The 100%-owned Valentine Mountain property consists of 25 cell mineral claims covering 7,188
hectares and two overlying cell placer tenures covering 43 hectares. One of the claims is subject
to a 5% net smelter returns royalty capped at $1,000,000.

The Valentine Mountain property surrounds Valentine Mountain, which has an elevation of 974
metres, is located 20 kilometres northwest of Sooke, British Columbia on southern Vancouver
Island and is accessible by forestry roads. The property area is underlain entirely by high-grade
metamorphic rocks of the Pacific Rim Terrane, which hosts several minor past producers of gold,
silver and copper, including the historic Leech River gold placer gold district, located just to the
east of the Property.

The property hosts the Valentine Mountain gold quartz vein prospect, for which a mineral resource
estimate is summarized as follows:
-8-
Gold (g/t) Gold (g) Gold (g/t) Gold (g)
Zone / Vein Tonnes Uncut Uncut Cut Cut Category
Discovery C 22,663 33.8 765,814 16.8 381,103 Indicated
Discovery B 32,100 4.1 130,344 3.7 129,352 Indicated
Total 54,763 16.4 896,158 9.3 510,455 Indicated
Discovery E 8,485 4.2 35,468 4.2 35,468 Inferred
Disc. West C 12,215 35.4 432,278 35.4 432,278 Inferred
Total 20,700 22.6 467,746 22.6 467,746 Inferred
Average gold intercepts for each zone were tabulated, and values calculated for uncut grade,
multiplied by true width for each intercept. Based on geo-statistical modeling for each
corresponding vein in each zone with significant values, statistical mean values were used as the
upper thresholds to cut higher gold values and arrive at the “cut” mineral resource values. Refer
to the entire text of the technical report, entitled Technical Report on the Valentine Mountain
Property, Southern Vancouver Island, British Columbia, Canada and dated March 27, 2013
available at www.sedar.com, for further information and the key assumptions, parameters and
methodology used, as well as risk factors.
The practice of “cutting” or reducing exceptionally high-grade assays when estimating mineral
resources for gold deposits, particularly in vein deposits, is historically industry standard practice,
primarily to make the estimates more conservative. The gold quartz veins at Valentine Mountain
contain erratically distributed gold, which could cause the estimated grade to vary materially from
the actual grade. For completeness, both uncut and cut averaged grades are shown, but the cut
grades should be used in evaluating the resource. Mineral resources that are not mineral
reserves do not have demonstrated economic viability.
This technical information was prepared under the supervision of Jacques Houle, P.Eng., an
independent Qualified Person as defined by National Instrument 43-101.
Chubb and Bouvier Lithium Project
In 2016, the Company optioned the Chubb and Bouvier lithium project located near Val d’Or,
Quebec. In 2017, it exercised that option and acquired 100% of the claims, subject to a 1% net
smelter returns royalty which can be repurchased for $200,000 and a 2% gross metal royalty.
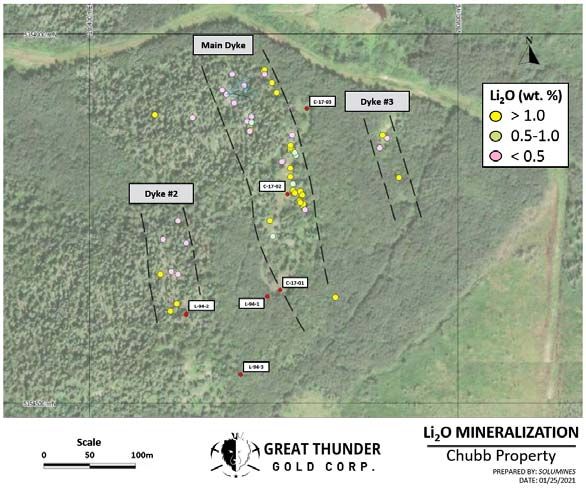
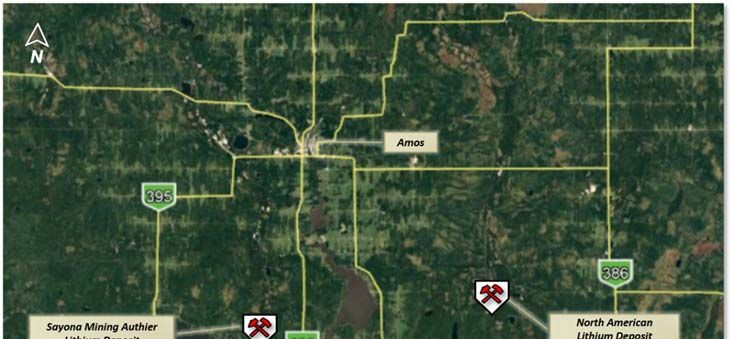
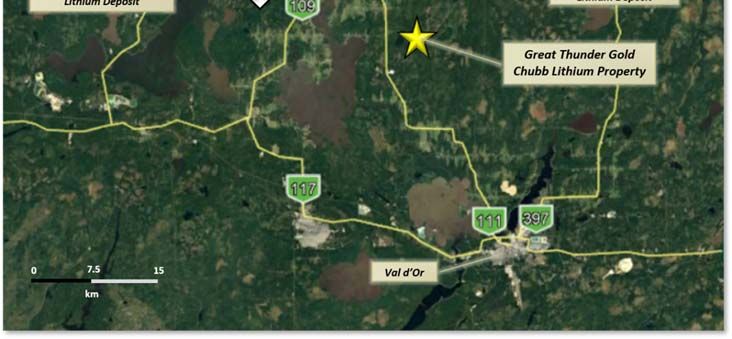
The Chubb Property
The Chubb Lithium property is located 25 kilometres north of the mining community of Val d’Or,
Quebec (Figure 1). It is hosted within the La Corne Pluton which is also host to North American
Lithium’s deposit with reported proven and probable reserves of 17.06 Mt grading 0.94% Li2O and
measured and indicated resources of 33.24 Mt grading 1.19% Li2O. The Chubb Lithium property is
also close to the Authier Lithium Deposit of Sayona Mining (ASX: SYA) which is estimated to contain
measured and indicated resources of 17.18 Mt grading 1.01% Li2O and inferred resources of 3.76
Mt grading 0.98% Li2O.-9-
The Chubb Lithium
property consists of 35
contiguous mineral
claims for a total area
of 1,509 hectares. The
property geology is
dominated by quartz
monzodiorite and
metasomatized quartz
diorite (tonalite). A
swarm of spodumene-
rich pegmatite dykes
intrude fractures and
small faults within the
plutonic rocks. The
pegmatite dykes are 1
to 6 metres thick so far,
oriented northwest
and vary in length from
25 to 250 metres. The
pegmatites are
composed of quartz,
albite and/or
cleavelandite, K-
feldspar, muscovite,
with 5% to 25%
spodumene. There
Figure 1: Regional location of the Chubb Lithium Property within the La Corne Pluton
are three important
pegmatite dykes containing spodumene mineralization (Main Dyke, Dyke #2 and Dyke #3) (Figure
2).
Great Thunder drilled 3 holes totalling
306 metres in 2017 on the Property.
Highlights included 1.33% Li2O over
5.3 metres in hole C-17-01. Diamond
drilling by Wrightbar Mines in 1994
intersected 3.7 metres grading 1.68%
Li2O, 2.74 metres grading 1.00% Li2O
and 2.4 metres grading 1.25% Li2O.
The Company filed an updated
National Instrument 43-101
Technical Report relating to its
Chubb Lithium property. The
complete technical report, entitled
“NI 43-101 Technical Report, Chubb
Property, Preissac-Lacorne
Townships, Quebec, Canada, Val
d’Or Mining Camp for Great Thunder
Gold Corp.” and dated February 1,
Figure 2: Pegmatite dyke swarm at the Chubb Lithium Property
2021, is available on SEDAR.- 10 - In February 2021, the Company engaged Diafor Inc. to undertake a 12-hole drilling program for a total of 2,000 metres aimed at the definition of the Main Dyke, Dyke 2 and Dyke 3 at depth and laterally. The Bouvier Property The Bouvier property is located within the Preissac-Lacorne plutonic complex of the Abitibi Greenstone Belt, in the Saint-Mathieu municipality of Figuery Township (NTS map sheet 32D08). The geological setting and structure of the volcano-sedimentary assemblages form an ideal host for lithium-rich pegmatites being located between the Northern Manneville Deformation Zone and the northern edge of the fertile Lacorne monzogranite pluton. The Bouvier property consists of 16 contiguous recorded mineral claims for a total area of 692 hectares or 6.92 square kilometers. The southern Bouvier property contains several exposures of biotite±muscovite monzogranitic plutonic rocks intruding metasediments and injected by granitic pegmatite and aplite dykes that constitute nearly 20% of the rock. Many granitic pegmatites contain beryl and tantalite, but very few have spodumene. To the north, the metasediments are in structural contact with the metavolcanic rocks of the Malartic and Harricana groups, with the Manneville Deformation Zone marking the contact between the metasedimentary and metavolcanic formations. Spodumene-bearing granitic pegmatite dykes occur only south of the Manneville Fault and were emplaced principally in metasediments. The dykes are oriented parallel to the Manneville Fault and can reach 100 meters in length and 10 meters in apparent thickness. Most granitic pegmatites are zoned, some having quartz cores and border zones of aplite. They are composed of quartz, albite and/or cleavelandite, K-feldspar, muscovite, with 5% to 25% spodumene. Accessory minerals are beryl, tantalite, garnet, bismuthine and molybdenite. The Bouvier property was submitted to sporadic mining exploration from the early 1950s to 1979, which included geological mapping, rock sampling, trenching and diamond drilling. A bulk sample taken by Teck Corporation and reported in their 1979 Annual Report, returned an average grade of 1.39% Li2O and an estimated “possible” historical resource of 907,000 tons. 1 In 2010, Mineral Hill Industries Ltd. carried out an exploration program involving line cutting, a magnetic and IP survey, trenching and panel and grab rock sampling, the work unearthed east-west oriented spodumene-bearing granitic pegmatites parallel to the Manneville Deformation Zone. The main dyke displayed an average lithium concentration of 1.51 Li2O wt. % (n=20). Donald Théberge, P.Eng., M.B.A., an independent qualified person as defined in National Instrument 43-101, has reviewed, and approved the technical contents herein on behalf of the Company. Urban Thunder Gold Project In March 2017, the Company acquired the Urban Thunder Project, which comprises 20 contiguous cell mineral claims covering approximately 1,127 hectares located 12 kilometres northwest of Metanor Resources Inc.’s Barry gold deposit, 15 kilometres west of Osisko Mining Inc.’s Windfall Lake gold deposits, and 18 kilometres west-northwest of BonTerra Resources Inc.’s Gladiator gold deposit. These Abitibi-type gold deposits are hosted in a variety of Archean age metavolcanic and intrusive rocks associated with magnetic high responses within a Z-shaped pattern of major east trending structures and offsetting northeast trending structures. The Urban Thunder Project lies in a similar structural setting as the Gladiator gold deposit
- 11 -

underlain by rocks similar to the Windfall Lake and Barry gold deposits. Management believes
that the geological setting of the property is very favourable to hosting similar deposits and plans
an intensive and systematic exploration program as funds permit.

The Company completed a soil geochemistry survey on its Urban Thunder property in October
2017. The survey was undertaken on GPS lines 400 metres apart with sampling every 100
metres. A total of 301 samples were drawn, to the extent possible, from the B soil horizon and
were sent for analysis at ALS Canada’s laboratory in Val d’Or, Quebec.

The samples were analyzed using ALS codes Au-ICP-21 and ME-ICP41. Au-ICP21 consists of
analysis of gold by fire assay with an ICP-AES finish on 30-gram samples. The detection limits of
this method are from 0.001 g/t to 10 g/t gold. The samples were then submitted to the second
analytical method – ME-ICP41 – where elements are estimated using aqua regia digestion
followed by analysis using ICP-AES. Included in this package of 35 elements are silver, arsenic,
copper, nickel and zinc.

A preliminary evaluation of the results revealed several gold anomalous results up to 24 ppb,
mainly obtained on the northern part of the property.

The technical contents of the soil geochemistry survey were approved by Donald Théberge,
P.Eng., MBA, an independent Qualified Person as defined by National Instrument 43-101.

Outstanding Share Data
As of the date hereof, the Company has 34,843,511 common shares issued and outstanding.

The Company has outstanding options which, as of the date hereof, may be exercised to purchase
a total of 2,050,000 shares. Of this total, 250,000 options may be exercised at $0.20 per share
until June 9, 2022 and 1,800,000 options may be exercised at $0.75 per share until October 9,
2025. The Company has, as of the date hereof, outstanding warrants which may be exercised to
purchase a total of 2,542,341 shares. Of this total, 2,462,341 warrants may be exercised at $0.85
per share until August 13, 2022 and 80,000 warrants may be exercised at $0.85 per share until
October 16, 2022.

Transactions Between Related Parties
During the nine-month periods ended January 31, 2021 and 2020, compensation costs for key
management personnel were:
                                                                                  2021          2020
Management fees paid to a corporation controlled by the Company’s
  Chief Executive Officer                                                   $   56,000     $        -
Management fees paid to the Company’s former Chief Executive Officer            19,000         22,500
Management fees paid to a corporation controlled by the Company’s
  Chief Financial Officer                                                       98,275         38,752
Consulting fees paid to a director                                               7,000              -
Fair value of stock options to purchase 1,500,000 shares of the Company
   at $0.75 per share to two officers and three directors                    1,034,232            -
                                                                            $1,214,507     $ 61,252

In July 2020, the Company entered into a consulting agreement with a corporation controlled by
its Chief Executive Officer whereby that corporation will provide consulting services for a fee of
- 12 - $8,000 per month. Severance fees of $192,000 are payable by the Company upon a change of control of, or termination without cause by, the Company. In February 2013, the Company entered into a consulting agreement with a corporation controlled by its Chief Financial Officer whereby that corporation will provide consulting services at its standard rates. The agreement may be terminated by the Company without cause upon payment of three months of fees as severance. Changes in Accounting Policies Including Initial Adoption The following standard was adopted by the Company effective May 1, 2020, but had no material impact on the financial statements: Amendments to IFRS 3: Business Combinations Amendments to IFRS 3: Business Combinations assist in determining whether a transaction should be accounted for as a business combination or an asset acquisition. It amends the definition of a business to include an input and a substantive process that together significantly contribute to the ability to create goods and services provided to customers, generating investment and other income, and it excludes returns in the form of lower costs and other economic benefits. Financial Instruments and Other Instruments The Company’s financial instruments consist of cash, investments, reclamation bonds, and accounts payable and accrued liabilities. The Company’s financial instruments are exposed to certain financial risks, including credit risk, liquidity risk and market risk. Credit Risk Credit risk is the risk that one party to a financial instrument will cause a financial loss for the other party by failing to discharge an obligation. In the opinion of management, none of the Company’s financial assets were exposed to significant credit risk as of January 31, 2021. Liquidity Risk Liquidity risk is the risk that the Company will encounter difficulty in satisfying financial obligations as they become due. The Company manages its liquidity risk by forecasting cash flows required by operations and anticipated investing and financing activities. The Company had cash as of January 31, 2021 in the amount of $4,546,909 in order to meet short-term business requirements. On January 31, 2021, the Company had current liabilities of $870,806. Accounts payable have contractual maturities of approximately 30 days or are due on demand and are subject to normal trade terms, and amounts due to related parties are without stated terms of interest or repayment. Market Risk Market risk consists of interest rate risk, foreign currency risk and other price risk. These are discussed further below. Interest Rate Risk Interest rate risk has two components: a) To the extent that payments made or received on the Company’s monetary assets and liabilities are affected by changes in the prevailing market interest rates, the Company is exposed to interest rate cash flow risk.
- 13 -

b) To the extent that changes in prevailing market rates differ from the interest rate in the
   Company’s monetary assets and liabilities, the Company is exposed to interest rate price risk.

The Company’s cash is currently held on deposit at a major bank. Management considers the
interest rate risk to be minimal.

Foreign Currency Risk
Foreign currency risk is the risk that the fair value or future cash flows of a financial instrument
will fluctuate due to changes in foreign exchange rates. The Company is not exposed to material
foreign currency risk.

Other Price Risk
Other price risk is the risk that the fair value or future cash flows of a financial instrument will
fluctuate due to changes in market prices, other than those arising from interest rate risk or foreign
currency risk. The Company is exposed to other price risk with respect to its investments as they
are carried at fair value based on quoted market prices.

Other Information
Additional information relating to the Company is available from the Company’s website at
www.greatthundergold.com and on SEDAR at www.sedar.com .

ON BEHALF OF THE BOARD

/s/ Blair Naughty
Blair Naughty
Chief Executive Officer
You can also read