Lower Savannah River Watershed Protection Plan - July 2019 i - SCDHEC
←
→
Page content transcription
If your browser does not render page correctly, please read the page content below
Lower Savannah River
Watershed Protection Plan
                      July 2019

                              i
Acknowledgements
This plan was prepared by the Lowcountry Council of Governments in association with
Geoscience Consultants, LLC, and subconsultant BMI Environmental Services, LLC. The project
was funded by the South Carolina Department of Health and Environmental Control’s Water Quality
Division.
The Lower Savannah River Watershed Protection Plan is the result of the input and
contributions of many individuals and agencies in the community, who are listed in the plan.
Ginnie Kozak, Lowcountry Council of Government’s planning director, served as the project
manager.

                                                                                                  ii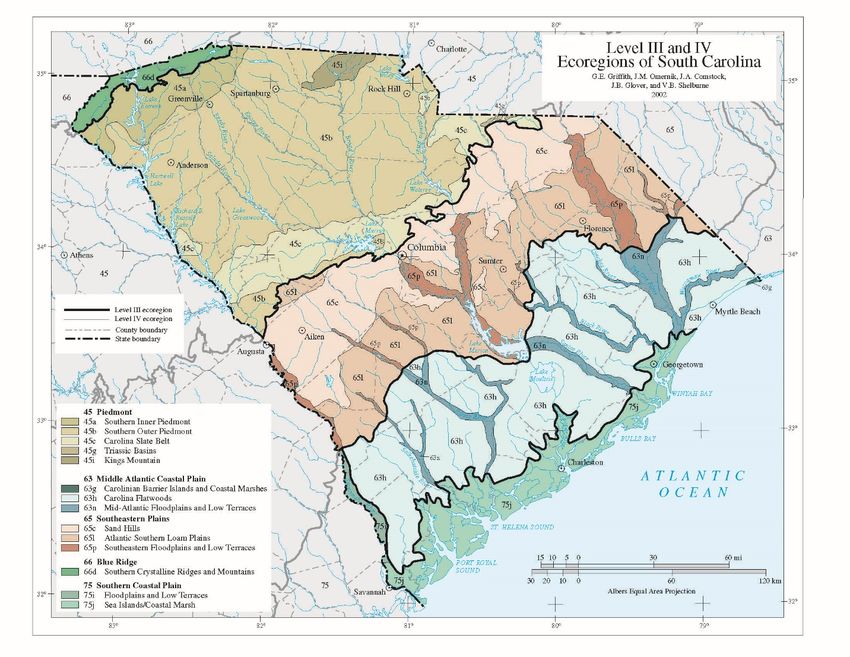
Table of Contents

Acknowledgements..........................................................................................................................ii
Table of Contents ............................................................................................................................. i
  List of Figures ..............................................................................................................................iv
   List of Tables ................................................................................................................................v
Acronyms and Definitions ................................................................................................................ i
Executive Summary.........................................................................................................................iii
  Setting and Purpose ....................................................................................................................iii
       Report Intent and Stakeholders..............................................................................................iv
   Assessments Results ...................................................................................................................vi
       Nutrients ................................................................................................................................ vii
       Total Suspend Solids and Sediment ....................................................................................... vii
       Urban Inputs .......................................................................................................................... vii
   Highlighted BMPs....................................................................................................................... vii
       Forestry ................................................................................................................................. viii
       Agriculture ............................................................................................................................ viii
       Development......................................................................................................................... viii
       Land Conservation and Protection ....................................................................................... viii
       Targeted BMP Approach ....................................................................................................... viii
   Structure of the Watershed-Based Plan ..................................................................................... ix
Section 1: Introduction ................................................................................................................... 1
  Introduction ................................................................................................................................ 1
   Lower Savannah River Watershed Study Area ........................................................................... 1
   Previous Work in Study Area ...................................................................................................... 3
   Stakeholders ............................................................................................................................... 3
       Project Staff Expertise............................................................................................................. 5
Section 2: Study Area Characterization .......................................................................................... 6
  Environmental Setting ................................................................................................................ 7
       Geography............................................................................................................................... 8
       Ecoregion ................................................................................................................................ 8
                                                                                                                                                     i

                                                                                                                                     i|Page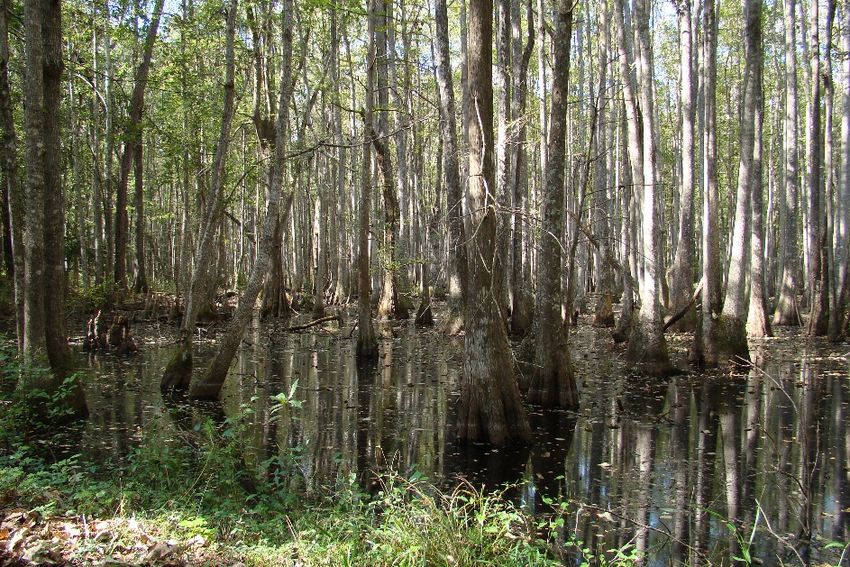
Lower Savannah River Watershed Study Area ....................................................................... 9
   Physical Features ...................................................................................................................... 10
      Topography ........................................................................................................................... 10
      Soils ....................................................................................................................................... 10
      Geology ................................................................................................................................. 12
      Climate and Precipitation ..................................................................................................... 14
      Habitats ................................................................................................................................. 15
   Land Use and Population Characteristics ................................................................................. 15
      Land Use and Land Cover Data ............................................................................................. 15
      Land Use Changes and Future Growth ................................................................................. 17
      Demographics ....................................................................................................................... 19
   Water Quality............................................................................................................................ 20
      Water Quality Standards....................................................................................................... 20
      Water Quality Monitoring Stations ...................................................................................... 21
   Pollutant Sources and Watershed Existing Conditions............................................................. 24
      Nitrogen ................................................................................................................................ 25
      Phosphorus ........................................................................................................................... 26
      Total Suspended Solids ......................................................................................................... 26
      Fecal Coliform Bacteria ......................................................................................................... 27
Section 3: Watershed Data and Analysis ...................................................................................... 28
  Summary of Available Data....................................................................................................... 29
      BJWSA Intake ........................................................................................................................ 29
   Water Quality Analysis.............................................................................................................. 30
      Models .................................................................................................................................. 30
   Presentation of Results ............................................................................................................. 31
      Nutrients ............................................................................................................................... 32
      Assessing Future and Human Impacts .................................................................................. 39
   Other Water Quality Parameters.............................................................................................. 43
      Total Dissolved Solids............................................................................................................ 43
      Sediments ............................................................................................................................. 46
   Monitoring Recommendations ................................................................................................. 48

                                                                                                                                                    ii

                                                                                                                                    ii | P a g e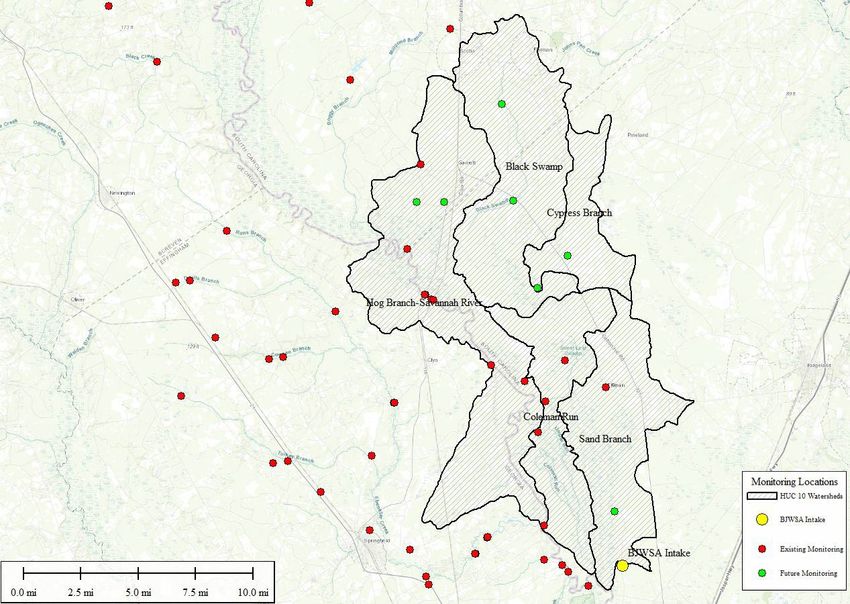
Summary of Results .................................................................................................................. 50
       Overview ............................................................................................................................... 50
Section 4: Best Management Practices ........................................................................................ 53
  BMP Overview ............................................................................. Error! Bookmark not defined.
       Structural BMPs .................................................................................................................... 54
       Nonstructural BMPs .............................................................................................................. 54
   Land Use and BMPs .................................................................................................................. 54
       Forestry Land Use and BMPs ................................................................................................ 55
       Agriculture Land Use and BMPS ........................................................................................... 57
       Development and Urbanization Land Use and BMPs ........................................................... 58
   BMPs for Lower Savannah River Study Area ............................................................................ 59
       Forestry ................................................................................................................................. 59
       Agriculture ............................................................................................................................ 60
       Development......................................................................................................................... 60
       Land Conservation and Protection ....................................................................................... 60
   Targeted/Holistic BMP Approach ............................................................................................. 60
       Conservation Easements/Load Reduction ............................................................................ 61
       Cover Crops ........................................................................................................................... 62
       Critical Area Planting............................................................................................................. 63
       Septic..................................................................................................................................... 63
       Total Load Reductions........................................................................................................... 64
Section 5: Management, Implementation and Funding Strategies.............................................. 66
  Management Strategies............................................................................................................ 66
       Short-Term Management Strategies (1-2 Years) .................................................................. 67
       Long-Term (2-5) Years........................................................................................................... 67
   Education and Outreach ........................................................................................................... 68
   Implementation Timeline and Milestones ............................................................................... 70
   Funding ..................................................................................................................................... 71
Section 6: References.................................................................................................................... 72

                                                                                                                                                  iii

                                                                                                                                   iii | P a g e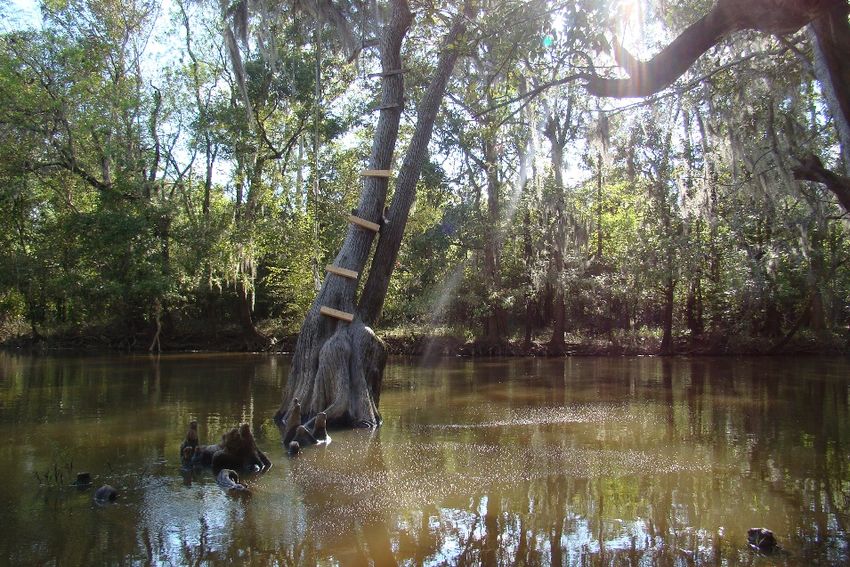
List of Figures
Section 1
Figure 1- 1. Stakeholders in the Lower Savannah River Watershed Study Area ...........................................................4

Section 2
Figure 2- 1. Overview of the Lower Savannah River Watershed study area .................................................................7
Figure 2- 2. Location and closeup of Lower Savannah Watershed ................................................................................7
Figure 2- 3. A digital elevation model (DEM) depicting the elevations in study area (NAVD 88). ...............................10
Figure 2- 4. Soils data was sourced from NRCS and populated with specific fields for use in the NSPECT model. .....11
Figure 2- 5. Surficial geology types ..............................................................................................................................13
Figure 2- 6. Average yearly precipitation in the study area.........................................................................................14
Figure 2- 7. Potential increases in future extreme rain events. ..................................................................................15
Figure 2- 8. Potential increase in future overall precipitation. ....................................................................................15
Figure 2- 9. Hybrid Land Cover product developed for study area .............................................................................16
Figure 2- 10. Categories of forest land cover change (loss to) ....................................................................................18
Figure 2- 11. Categories of urban land cover change (gained from) ...........................................................................18
Figure 2- 12. Areas of conversion to development (green) between 1996 and 2010 .................................................18
Figure 2- 13. Areas of loss of forest in red and gain in green (1996-2010) .................................................................18
Figure 2- 14. Percent of the study area population by race and ethnicity ..................................................................20
Figure 2- 15. Primary water quality monitoring locations in watershed .....................................................................23

Section 3
Figure 3- 1. BJWSA Nitrogen samples ..........................................................................................................................30
Figure 3- 2. BJWSA Phosphorus samples .....................................................................................................................30
Figure 3- 3. Subwatersheds with 125% of Nitrogen and Phosphorus average for entire study area from PLOAD. ....34
Figure 3- 4. Modeled nitrogen concentration in rivers................................................................................................35
Figure 3- 5. Nitrogen in streams with greater than 110% concentration compared to BJWSA intake location from
NSPECT.........................................................................................................................................................................36
Figure 3- 6. Modeled phosphorus concentrations. .....................................................................................................37
Figure 3- 7. Streams with greater than 110% phosphorus concentration compared to BJWSA intake location from
NSPECT.........................................................................................................................................................................38
Figure 3- 8. Streams with at least 170% of baseline phosphorus load. Grey streams have 170% and red streams are
up to 200% of baseline loads (kg). ...............................................................................................................................39
Figure 3- 9. Locations with concentrations (ratio) of phosphorus over baseline model runs of more than 1.0. ........40
                                                                                                                                                                             iv

                                                                                                                                                            iv | P a g e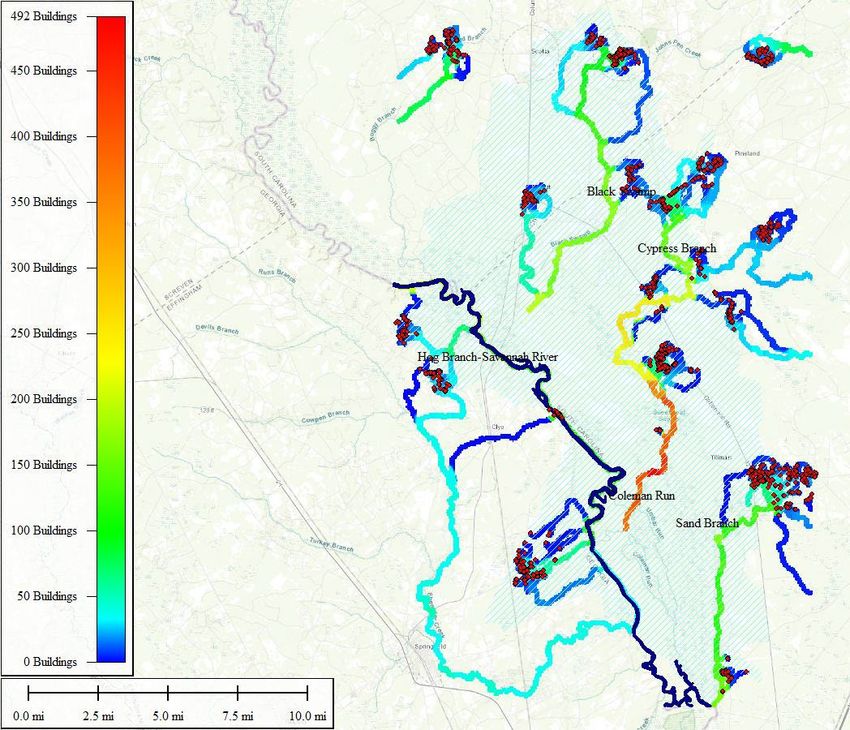
Figure 3- 10. Buildings in poor draining soils and number of buildings draining to each stream. ..............................42
Figure 3- 11. Watersheds with 25% more TSS than the average ................................................................................44
Figure 3- 12. Streams with concentrations greater than 110% of those at BJWSA intake location ............................45
Figure 3- 13. Streams with greater than 150% (green) of baseline TSS loads. Red colors are over 200%. .................46
Figure 3- 14. Sediment loads from low (blue) to high (red) in watersheds .................................................................47
Figure 3- 15. Areas of increased (greater than 120%) erosion and sediment in streams from increased rainfall. .....48
Figure 3- 16. Proposed (green) monitoring locations to improve coverage and watershed modeling capabilities....49
Figure 3- 17. Existing SC Adopt-a-Stream locations in the southeastern portion of the state ....................................50

List of Tables
Section 2
Table 2- 1. Lower Savannah River Watersheds ...........................................................................................................10
Table 2- 2. Land cover statistics for the study area .....................................................................................................17
Table 2- 3. Watershed population and housing statistics ...........................................................................................19
Table 2- 4. Impaired waters in the study area .............................................................................................................21
Table 2- 5. Pollutants and sources ...............................................................................................................................25

Section 3
Table 3- 1. Mean and median calculation of nutrients at BJWSA intake over approximately 10-year period ............29
Table 3- 2. STEPL results in study area........................................................................................................................33
Table 3- 3. Buildings and population in poor soils ......................................................................................................43
Table 3- 4. Potential nutrient loads and most probably number (MPN) of E. coli from failing septic systems ..........43
Table 3- 5. E. coli loads from human use ....................................................................................................................43
Table 3- 6. Overview of Modeling Results ...................................................................................................................51

Section 4
Table 4- 1. Forestry related BMPs ...............................................................................................................................56
Table 4- 2. Agricultural BMPs ......................................................................................................................................57
Table 4- 3. Development BMPs ...................................................................................................................................59
Table 4- 4. Loading Estimates from 100 acres of mixed agriculture and development land use and the load
reductions from conserving those areas in the forested land cover class. .................................................................62
Table 4- 5. Load reductions calculated for Cover Crops on 1000 acres .......................................................................63
Table 4- 6. Load reductions calculated for Critical Area Planting on 350 acres of pasture and barren lands .............63
                                                                                                                                                                    v

                                                                                                                                                   v|Page
Table 4- 7. Calculated load reductions reaching rivers and streams from fixing 50 septic systems based on an 80%
success rate .................................................................................................................................................................64
Table 4- 8. Summary of BMP costs and load reductions .............................................................................................65

Section 5
Table 5- 1. Education and outreach strategy ...............................................................................................................68
Table 5- 2. Implementation Timeline and Milestones .................................................................................................71

                                                                                                                                                                            vi

                                                                                                                                                           vi | P a g e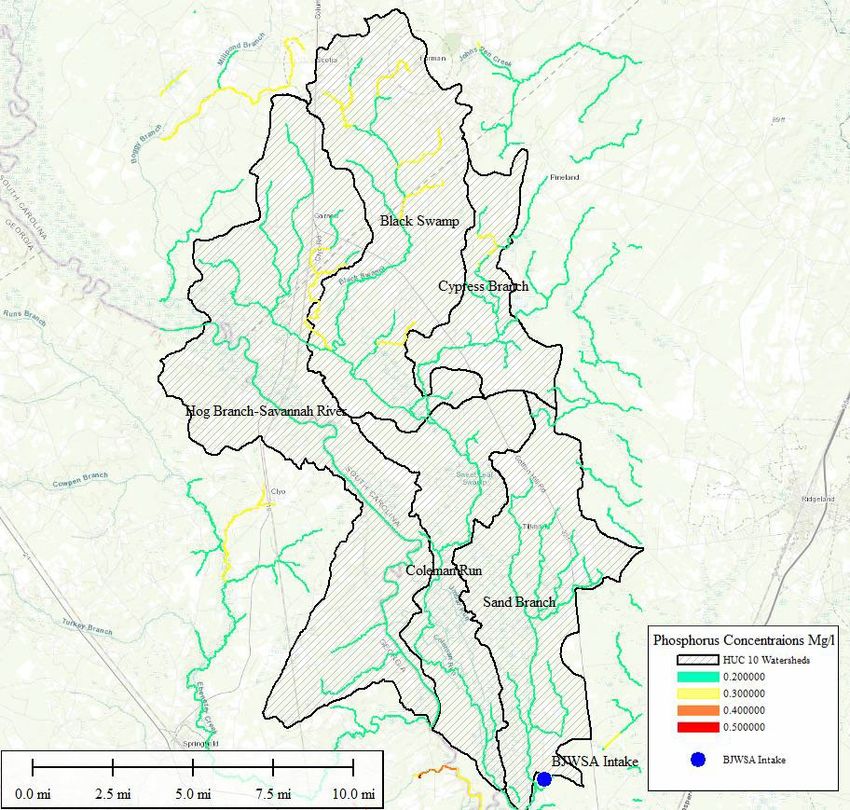
Acronyms and Definitions
BOD         Biological Oxygen Demand
BJWSA       Beaufort-Jasper Water and Sewer Authority
BMP         Best Management Practice
DEM         Digital Elevation Model
DO          Dissolved Oxygen
E. coli     Escherichia coli
EMC         Event Mean Concentration
EPA         Environmental Protection Agency
FIB         Fecal Indicator Bacteria
HSG         Hydrologic Soil Group
HUC         Hydrologic Unit Code
Lbs./acre   Pounds per Acre
LID         Low Impact Development
LCOG        Lowcountry Council of Governments
mg/L        Milligrams per Liter
MS4         Municipal Separate Storm Sewer System
NOAA        National Oceanic and Atmospheric Administration
NPS         Nonpoint Source
NRCS        Natural Resources Conservation Service
NSPECT      Nonpoint Source Pollution and Erosion Comparison Tool
PLOAD       Pollutant Loading Estimator
SoLoCo      Southern Lowcountry Regional Board
SC          South Carolina
SCDHEC      South Carolina Department of Health and Environmental Control
SFI         Sustainable Forestry Initiative
SLR         Sea Level Rise
SMZ         Streamside Management Zone
SRCWF       Savannah River Clean Water Fund
STEPL       Spreadsheet Tool for Estimating Pollutant Load
                                                                                     i

                                                                            i|Page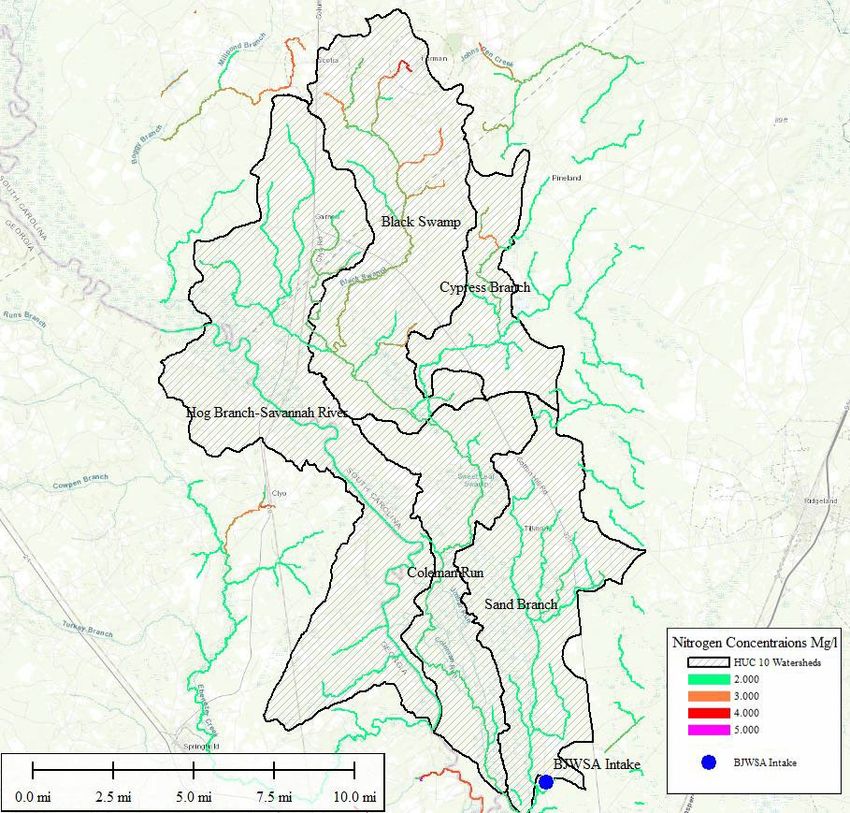
SWCD   Soil and Water Conservation District
TDR    Transfer of Development Rights
TMDL   Total Maximum Daily Load
TN     Total Nitrogen
TP     Total Phosphorus
TSS    Total Suspended Solids
USDA   United States Department of Agriculture
USGS   United States Geological Survey
WQM    Water Quality Monitoring

                                                            ii

                                                 ii | P a g e
Executive Summary
Setting and Purpose
The study area, shown on the following page, includes portions of Jasper and Hampton
counties in South Carolina and Effingham County in Georgia that drain into the Savannah River.
The study area’s mostly undeveloped stretches of wetlands, forests and farms play a critical
role in maintaining the region’s drinking water supply. Through surface water intakes along the
Savannah River directly south of the study area, Beaufort-Jasper Water and Sewer
Authority (BJWSA) serves more than 150,000 residents and the City of Savannah distributes
potable water to various industrial, commercial and residential customers. The purpose of this
plan is to evaluate current water quality conditions within the study area and develop
strategies for managing identified pollutants. These tasks were completed with the primary
goal of protecting a major source of drinking water for thousands of residents in South Carolina
and Georgia.
The need to protect water quality in the Savannah River has become even more urgent in
recent years. While the study area itself is rural, it is situated near rapidly growing urban
centers in a region experiencing intense development pressure. The City of Hardeeville, located
slightly south of the study area’s boundary, has grown about 121% from 2,952 residents in 2010
to 6,515 residents in 2018 (U.S. Census Bureau, 2018). Further downstream, the Town of
Bluffton’s population grew 84% to 23,097 residents, the Town of Hilton Head Island grew 7% to
39,639 residents and the City of Savannah grew 7% to 145,862. The influx of residents and
accompanying development downstream make interventions to improve water quality in the
study area increasingly important.
iii
iii | P a g eReport Intent and Stakeholders
In late 2017, South Carolina Department of Health and Environmental Control (SCDHEC) awarded
the Lowcountry Council of Governments (LCOG) a grant to develop a watershed-based
plan. The overall goal of the Lower Savannah River Watershed Protection Plan is to evaluate
current water quality conditions within the study area and develop a plan to manage identified
pollutants. The water quality parameters for the plan are Phosphorus, Nitrogen, Dissolved
Oxygen, Fecal Coliform and Turbidity. SCDHEC considers the watershed impaired but a Total
Maximum Daily Load (TMDL) for pollutants has not been developed.
iv
iv | P a g eThe success of a watershed-based plan largely depends on the participation and commitment
from community members, businesses, agencies and nonprofit organizations operating within
the watershed. Stakeholders from the region helped define this plan’s goals, provided feedback
on watershed assessment results and assisted in developing recommended strategies. The
stakeholder group, which grew over time, based on recommendations from other members,
included representatives from the organizations shown below.
v
v|PageAssessments Results
Water quality in the study area was mostly assessed using spatial models because of the lack of
water quality monitoring station data. These models, which rely heavily on remotely sensed
and GIS data, found water quality in the study area is good overall. However, the results
suggest certain watersheds in the study area have a higher propensity for nonpoint source
(NPS) pollution contributions than others.
Models were also run to assess how water quality in the study area could be affected by
increased precipitation and rainfall voracity associated with climate change. While the exact
conditions used in these modeling scenarios may or may not occur, they are important
considerations for evaluating BMPs and other interventions.
vi
vi | P a g ePollutant Most Affected Watershed Potential Causes Future Changes
Higher Ag, Urban Land Higher
Total Nitrogen Black Swamp
Covers Concentrations
Total Higher Ag, Urban Land Higher
Black Swamp
Phosphorus Covers Concentrations
Suspended Soil Types, Slopes, Ag Land
None, Localized Higher Loads
Solids Cover
Increased Soil
Fecal Coliform Cyprus Branch Soil Types, Development
Saturation
Topography, Land Cover,
Sediment Black Swamp, Coleman Run Increased Erosion
Soil
Nutrients
Monitoring and baseline modeling information suggest nitrogen and phosphorus loads in the
study area are not currently a major water quality issue. However, certain watersheds, such as
Black Swamp, have physical attributes that theoretically could lead to degraded water quality in
the Savannah River and at the surface water intakes.
The results of the climate change scenario do not suggest a drastic increase in nutrients loads
overall, but show loads could increase about 50% in certain areas.
Total Suspend Solids and Sediment
The amount of areas showing high TSS levels relative to the BJWSA intake is less pronounced
than the nutrient results. However, climate change may have a larger effect on TSS than
nutrients. Sediment from erosion appeared to be mainly from the South Carolina side of the
Savannah River with higher values from the Black Swamp watershed, which also had a higher
increase in the climate scenario.
Urban Inputs
Wastewater discharge from non-functioning septic systems was the primary NPS input assessed
from developed areas. Based on an accounting and spatial analysis there is the potential for E.
coli bacteria counts (MPN) of around 70 trillion per year entering the waters in the study area.
The area of highest concern is with Cyprus Creek.
Highlighted BMPs
A stormwater Best Management Practice (BMP) is a technique, measure or control used to
manage the quantity and improve the quality of stormwater runoff in the most cost-effective
vii
vii | P a g emanner. This plan identifies several structural and nonstructural BMPs that could be effective at
addressing the issues identified during the assessment of the study area.
Forestry
The South Carolina Forestry Commission (SCFC) Forestry offers detailed BMPs guidance for
forestry activities, including streamside management zones (SMZs), stream crossings and forest
road construction. This plan recommends implementing SCFC BMPs and maintaining existing
forestry lands through land protection. Conservation easements requiring low impact
development (LID) and uses, and those that tie together protected parcels are recommended
for the study area.
Agriculture
Black Swamp watershed is primarily agricultural and has the highest levels of modeled nutrient
loads in the study area. Cover crops and other conservation activities identified by the Natural
Resources Conservation Service (NRCS) are recommended as BMPs. This plan also recommends
critical area plantings in pastures and barren areas.
Development
There is little development in the study area, which largely benefits water quality. However, a
disadvantage to the rural character is the lack of sanitary sewer services available for the homes
and businesses located there. All waste water is treated ‘on-site’ by various techniques with
little oversight, which presents avenues for degraded surface water quality. Stakeholders
recommended increased education and funding for on-site septic system repair and
maintenance. Several areas with poorer soil conditions could be targeted, however, Cyprus
Creek, which is fed by the Cyprus Branch and Coleman Run watersheds, has the potential to
have the biggest influx of septic related NPS pollution.
Land Conservation and Protection
The quality of surface water in the study area is directly related to the land surface conditions
and NPS discharges to surface water. Acquisition and protection of high-priority lands for
conservation and management has been shown to be an effective BMP to protect surface
water quality, and many stakeholder groups have been working for years to protect land in the
study area. This plan recommended building upon their efforts to protect critical lands.
Targeted BMP Approach
Analysis of the Lower Savannah River Watershed study area, and its subwatersheds, suggests a
targeted list of land use-focused BMPs, coupled with land conservation, could have a more
pronounced water quality management effect than “random acts of conservation kindness.”
Four primary techniques were assessed as mechanisms to realistically maintain and improve
water quality in the study area: septic repairs and pumping in developed areas; cover crops in
agricultural lands; critical area planting in pastures and barren areas, and conservation
viii
viii | P a g eeasements in forested lands. Cost estimates and load reductions associated with these four
techniques are included in Section 4.
Structure of the Watershed-Based Plan
This plan has been developed in accordance with the guidelines developed by SCDHEC and
addresses the nine watershed-based planning elements required by SCDHEC and the EPA. The
table below describes the nine elements and identifies where in this watershed-based plan
each element is addressed.
Watershed-Based Plan Elements Crosswalk with LSR-WBP
Document
EPA-WBP Element SC-WBP Abbreviated Element
Location
1. An identification of all of the causes and sources or groups of
similar sources that will need to be controlled to achieve the load
reductions estimated in this watershed-based plan (and to achieve
any other watershed goals identified in the watershed-based
plan), as discussed in item (b) immediately below. Sources that Element A-Identification of pollutant Yes
need to be controlled should be identified at the significant sources and their causes. (Section 2)
subcategory level with estimates of the extent to which they are
present in the watershed (e.g., X acres of row crops needing
improved nutrient management or sediment control; or X linear
miles of eroded streambank needing remediation).
2. An estimate of the load reductions expected for the Element B-Estimated load reductions
management measures described under paragraph (c) below from management measures identified in Yes
(recognizing the natural variability and the difficulty in precisely (c). (May also include overall pollutant
predicting the performance of management measures over time). reduction needed as found in a TMDL (Section 2)
Estimates should be provided at the same level as in item (a) document.)
above (e.g., the total load reduction expected for row crops or 4
eroded streambanks).
3. A description of the management measures that will need to be Element C-Management measures (Best
implemented to achieve the load reductions estimated under Management Practices, or BMPs) needed
paragraph (b) above (as well as to achieve other watershed goals in order to eliminate or control Yes
identified in this watershed-based plan), and an identification pollutant(s) (Sections 4 & 5)
(using a map or a description) of the critical areas in which those
measures will be needed to implement this plan.
Element D-Identification of funding and
4. An estimate of the amounts of technical and financial assistance
technical assistance needs as well as
needed, associated costs, and/or the sources and authorities that
potential sources. Example: Watersheds
will be relied upon, to implement this plan. As sources of funding,
with agricultural sources would most Yes
States should consider the use of their Section 319 programs,
likely require the expertise of USDA
State Revolving Funds, USDA’s Environmental Quality Incentives (Section 5)
Natural Resources Conservation Service
Program and Conservation Reserve Program, and other relevant
staff and could potentially utilize
Federal, State, local and private funds that may be available to
Environmental Quality Incentive Program
assist in implementing this plan.
funds for implementation.
ix
ix | P a g eWatershed-Based Plan Elements Crosswalk with LSR-WBP
Document
EPA-WBP Element SC-WBP Abbreviated Element
Location
5. An information/education component that will be used to Element E-Outreach strategy that is
enhance public understanding of the project and encourage their targeted towards members of the public Yes
early and continued participation in selecting, designing, and that are impacted by the project and the
implementing the NPS management measures that will be management measures from (c). (Section 5)
implemented.
Element F-Timeline of implementation Yes
6. A schedule for implementing the NPS management measures
events that proceeds in a logical and
identified in this plan that is reasonably expeditious. (Section 5)
efficient manner.
7. A description of interim, measurable milestones for determining Element G-List of milestones for keeping
whether NPS management measures or other control actions are plan implementation progress on track.
being implemented.
Element H-A set of criteria that can be
used to determine whether loading
8. A set of criteria that can be used to determine whether loading reductions are being achieved over time
reductions are being achieved over time and substantial progress and substantial progress is being made
is being made towards attaining water quality standards and, if towards attaining water quality standards Yes
not, the criteria for determining whether this watershed-based and, if not, the criteria for determining (Section 5)
plan needs to be revised or, if a NPS TMDL has been established, whether this watershed-based plan needs
whether the NPS TMDL needs to be revised. to be revised or, if a NPS TMDL has been
established, whether the NPS TMDL
needs to be revised.
9. A monitoring component to evaluate the effectiveness of the Element I-Monitoring strategy to Yes
implementation efforts over time, measured against the criteria determine effectiveness of plan
established under item (h) immediately above. implementation. (Section 5)
x
x|Pagexi xi | P a g e
Section 1: Introduction
Introduction
A watershed is an area of land draining to a common point, such as a creek or river. Watersheds
are characterized not only by their physical features, including hydrography and topography,
but also by the people and land use activities occurring within the watershed’s boundaries. The
social, economic and political forces associated with human settlements combine with the
area’s physical characteristics to create a specific set of issues, challenges and opportunities for
each watershed.
In the United States, the Clean Water Act regulates water quality and the United States
Environmental Protection Agency (EPA) delegates to states the authority to set quality
standards and manage water resources. The Section 319 grant program offers local and state
stakeholders the opportunity to assess conditions in a watershed and develop an
implementation plan for site-specific tasks designed to improve water quality. A watershed
assessment is a background investigation that may include reviewing water quality monitoring
station data, conducting field surveys and employing various models to estimate
how certain locations and activities affect water quality. The results of the watershed
assessment are shared with stakeholders who use the information to recommend strategies for
improving water quality and develop an implementation plan. After a watershed-based plan is
approved by the South Carolina Department of Health and Environmental Control (SCDHEC)
and the EPA, public bodies and organizations are eligible to apply for additional grant money to
implement specific projects and outreach activities recommended in the plan.
The watershed-based plan is a living document. The findings and recommendations in this
document can and should evolve as conditions change, new information becomes available and
stakeholder groups transform over time.

Lower Savannah River Watershed Study Area
The Lower Savannah River Basin covers 16 watersheds stretching from Edgefield County
eastward to the Atlantic Ocean (SCDHEC). The project study area covers portions of two of
these watersheds, the 10-digit hydrologic unit code (HUC) 0306010901 and 0306010903
watersheds.
The study area is mostly rural, covering parts of Jasper and Hampton counties in South Carolina
and Effingham County in Georgia. The study area includes portions of the Town of Scotia
(population 201) and the Town of Furman (population 217) (U.S. Census Bureau, 2018). While
the study area itself is rural, it is situated near rapidly growing urban centers in a region
experiencing intense development pressure. The City of Hardeeville, located slightly south of

                                                                                                  1

                                                                                        1|Page
the study area’s boundary, has grown about 121% from 2,952 residents in 2010 to 6,515
residents in 2018. Further downstream, the Town of Bluffton’s population grew 84% to 23,097
residents, the Town of Hilton Head Island grew 7% to 39,639 residents and the City of Savannah
grew 7% to 145,862. Although the influx of residents and accompanying development does not
immediately threaten the study area, it makes maintaining water quality in the Savannah River
an urgent need.
The study area covers about 188 square miles and has five 12-digit HUC watersheds. Hog
Branch-Savannah River, the largest watershed, crosses the Georgia-South Carolina border to
cover the western portion of the study area. Black Swamp and Cypress Branch watersheds
cover the northern and northeastern portions of the study area, while Coleman Run and Sand
Branch watersheds span the southern and southeastern areas of the study area.
The study area mostly consists of wetlands, forests and small agricultural farms. There are
pockets of development in the towns of Scotia and Furman, as well as the unincorporated
communities of Tillman, Tarboro, Robertville, Pineland and Garnett. However, the overall study
area is sparsely populated and falls far outside Municipal Separate Storm Sewer System (MS4)
stormwater regulations. Parcels in the study area range in size but are generally large, with an
average area of 50 acres in Hampton County and 55 acres in Jasper County. Many of these
parcels are protected by conservation easements, which limit the possibility of future
development and conserve the area’s ecological value.
The Savannah River is valued for its wildlife habitat, the economic opportunities it offers
industries and small businesses, and recreational activities that enhance the region’s quality of
life. The river is also the primary source of drinking water for more than 150,000 residents in
Beaufort and Jasper counties (BJWSA). BJWSA operates a surface water intake at the southern
tip of the study area, and the City of Savannah operates similar infrastructure
downstream along Abercorn Creek that distributes potable water to various industrial,
commercial, wholesale and residential customers (City of Savannah, 2017). The primary goal of
this plan is to protect the major source of drinking water for thousands of residents in both
states.
In late 2017, SCDHEC awarded the Lowcountry Council of Governments (LCOG) a grant to
develop a watershed-based plan for the Lower Savannah River Watershed study area. The
purpose of the plan is to evaluate current water quality conditions within the study area and
develop strategies for managing identified pollutants. This plan addresses the EPA’s nine
elements of watershed-based plans (Appendix 1). The water quality parameters for this plan,
which were determined by SCDHEC, are phosphorus, nitrogen, dissolved oxygen, fecal coliform
and turbidity. SCDHEC considers the study area impaired but a Total Maximum Daily Load
(TMDL) for pollutants has not yet been developed.
2
2|PagePrevious Work in Study Area
The Lower Savannah River Watershed Protection Plan is the latest in a long line
of efforts to document and address water quality issues in the area. This
plan recognizes previous projects, policies and planning initiatives in an attempt to build off of
their successes, identify unmet needs and leverage existing resources.
One major effort underway to improve water quality in the Savannah River comes from the
Savannah River Clean Water Fund (SRCWF). The fund, which hired its first executive director in
2016, pools resources from five South Carolina and Georgia water utilities, including BJWSA and
the City of Savannah (Espinola, 2018). The goal of the fund is to protect water quality through
research and improved land management. Leaders of the fund have recognized conservation
easements as an effective tool in achieving this goal and have ranked parcels along the
Savannah River where conservation easements would have the strongest effect on water
quality.
Other groups have recently targeted stormwater issues in and around the study area as a
means to improve water quality. In 2011, Jasper County developed a Stormwater Management
Design Manual outlining minimum design, construction and maintenance requirements for
effective stormwater best management practices (BMPs) as part of a 319 implementation grant
for the Okatie River Watershed (HUC 03052080606) (Jasper County, 2011). The Southern
Lowcountry Regional Board (SoLoCo) is currently developing a regional stormwater design
manual and model ordinance for Beaufort and Jasper counties, the City of Hardeeville and
towns of Bluffton and Hilton Head.
As part of the watershed assessment, the project team reviewed existing plans
and recommendations relating to water quality in the study area. This review helped the
project team understand various stakeholders’ priorities and plans for the study area, and
identify the successes and failures of past project ideas.
The plans included in this review are:
• Beaufort-Jasper Water and Sewer Authority Source Water Assessment
• Hampton County Comprehensive Plan
• Jasper County Comprehensive Plan
• Jasper County Natural Resources Conservation Plan
• Lowcountry Regional Natural Hazard Mitigation Plan
• Lowcountry Regional Water Quality Management Plan
Stakeholders
The success of a watershed-based plan largely depends on the participation and commitment
from community members, businesses, agencies and nonprofit organizations operating within
the watershed. Stakeholders from the study area helped define this plan’s
goals, provided feedback on watershed assessment results and assisted in developing
3
3|Pagerecommended strategies. The stakeholder group, which grew over time, based on
recommendations from other members, included representatives from the
organizations shown in Figure 1- 1.
From September
2018 through February •Beaufort Jasper Water and Sewer Authority
2019 members of the (BJWSA)
Local Government & Utilities •Jasper County Planning and Building Department
project team spoke with •Jasper County Soil and Water Conservation
individual stakeholders District (SWCD)
about their current
initiatives in the study
area and priorities for the
•South Carolina Department of Health and
plan. Stakeholders Environmental Control (SCDHEC)
consulted during this time •South Carolina Forestry Commission (SCFC)
State/Federal Government •USDA Natural Resources Conservation Services
period include Tricia (NRCS)
Kilgore •Clemson Extension
from BJWSA, Brandon King
and Benjamin Padget from
the Jasper and
Beaufort county offices of •Savannah River Clean Water Fund (SRCWF)
the Natural Resources Non-Governmental •Land trusts
Organizations/Non-Profits •Watershed keepers and conservation groups
Conservation Service •Heirs properties groups
(NRCS), representatives
from state and regional
offices of SCDHEC, Michael
Broom from the South
Carolina Forestry •Farmers
Commission (SCFC), Lyn Community:Business &
Residents
•Foresters
•Hunting clubs
Boyles and Tomas Stanley •Residents
from the Jasper County Soil
and Water Conservation
District (SWCD), Lisa 1-
Figure
1. Stakeholders
Figure 1- 1. Stakeholders
0-1. in the Lower
in the Savannah
Lower Savannah
Watershed
River Watershed Study Area
Watershed.
Wagner from Jasper
County Planning and Building Department, Lisa Lord of The Longleaf Alliance and SRCWF, Eric
Krueger from The Nature Conservancy and Josh Bell from the Lowcountry Land Trust.
The project team brought stakeholders together on two occasions to present results from the
watershed assessment and brainstorm strategies to improve water quality. The first focus
group on March 27, 2019 concentrated on water quality issues related to current and future
development in the study area. An Esri story map with an online map were distributed before
the event to orient participants to the study area and outline the goals of the focus group. At
the focus group participants discussed the threat septic systems pose to water quality in the
watershed, which is not served by a sanitary sewer system. To mitigate the effects of septic
4
4|Pagesystems, participants identified the need for more financial resources to support septic tank
maintenance and repairs, as well as opportunities to educate homeowners, real estate agents
and developers about septic system care. The second focus group on April 30, 2019
concentrated on forestry, agriculture and land protection. A second Esri story map was
developed for the event. This session included a discussion on targeting specific areas with land
protection and agriculture/forestry BMPs to maximize the effect of each technique. Participants
also discussed the potential to financially assist landowners who are interested in installing
BMPs but have been denied or underfunded through existing avenues. Attendance sheets from
both focus groups can be found in Appendix 1.
The third phase of stakeholder involvement included formal and informal reviews of the draft
plan, and discussions about maintaining and expanding the involvement of current and future
stakeholders.
The stakeholder group will likely grow and evolve as the Lower Savannah River Watershed
Protection Plan is implemented and updated.
Project Staff Expertise
LCOG is the lead organization on this project. LCOG’s mission to serve the 25 local governments
in Beaufort, Colleton, Hampton and Jasper counties makes it well suited to manage a
watershed-based plan crossing jurisdictional lines. LCOG has experience
developing the Lowcountry Water Quality Management (208) Plan and managing a
previous 319 implementation grant associated with the Okatie River Watershed Management
Plan. LCOG hired Geoscience Consultants, LLC, and BMI Environmental Services, LLC, to provide
technical assistance and support for this plan. The consultant team has experience working with
water, modeling and climate change in the Lowcountry. The plan also relied heavily on
expertise from stakeholders, particularly NRCS and SCFC, to identify BMPs for agriculture and
forestry that could be most effective in the study area.
5
5|PageSection 2: Study Area Characterization
This section provides an overview of the study area. The first portion of this section discusses
the environmental setting and describes the study area’s physical and natural features,
including the geography, topography, hydrology and climate. The second part focuses on
population demographics and land uses. The third portion describes water quality standards
and monitoring in the study area. The fourth portion overviews pollutant sources and their
potential effect on the study area.
6
6|PageEnvironmental Setting
The study area is relatively rural, covering parts of Jasper and Hampton counties in South
Carolina and Effingham County in Georgia. The Savannah River and surrounding study area are
valued for their wildlife habitat and recreational values that enhance the Lowcountry’s quality
of life. The river is also the primary source of drinking water for more than 150,000 residents in
Beaufort and Jasper counties (BJWSA). Figure 2- 2 shows the study area’s geographic context,
provides a closer look at the study area’s five watersheds, and identifies the BJWSA surface
water intake.
Figure 2- 1. Overview of the Lower Savannah River Watershed study area
7
7|PageLand cover in the study area consists primarily of wetlands, forests and small agricultural
farms. There are small areas of development in the towns of Scotia (population 201) and
Furman (population 217), as well as the unincorporated communities of Tillman,
Tarboro, Robertville, Pineland and Garnett (U.S. Census Bureau, 2018).
While the quality of the watershed is generally high, changing land use and increased human
activities threatens to degrade this vulnerable area.
Geography
The Lower Savannah River Watershed is one of four distinct watersheds (Savannah,
Salkehatchie, Edisto, and Santee) located in the geographic area known as the Lowcountry. The
Savannah River, which originates in the mountains of North and South Carolina, flows through
the western portion of the study area on its way to the Atlantic Ocean and is a major feature of
the watershed that shares its name. The study area crosses the border of South Carolina and
Georgia, covering parts of Jasper, Hampton and Effingham counties. It is a rural area containing
unincorporated communities, and portions of the towns of Scotia and Furman.
The study area is accessed by U.S. Highway 321, SC Highway 336, SC Highway 462 and GA
Highway 119. South of the study area is the City of Hardeeville, City of Savannah and the
Savannah National Wildlife Refuge, a 31,551-acre landscape of freshwater marshes, tidal creeks
and bottomland hardwoods (U.S. Fish and Wildlife Service, 2018).
Ecoregion
While the framework for this planning effort is at the 12-digit HUC watershed level, it is
important to also consider the ecological characteristics of the region. Consideration of both
watershed and ecoregion assessment frameworks allows for a more holistic approach that
considers spatial patterns of the aggregate of natural and anthropogenic relationships within
and among watersheds (Omernik et al., 1997). The watersheds of the study area are five of
several watersheds along the Savannah River intertwined not only by water, but geological,
ecological and biological characteristics of the Middle Atlantic Coastal Plain Ecoregion.
This ecoregion (Figure 2- ) is characterized by low elevation and flat plains, with many swamps
and marshes. Forest cover in the region was once dominated by longleaf pine but is now mostly
loblolly and some shortleaf pine, with patches of oak, gum and cypress near major streams. Its
low terraces are underlain by unconsolidated sediments. Poorly drained soils are common, and
the region has a mix of coarse and finer textured soils. Most of the land is in large holdings and
is used for the production of lumber and pulpwood. The acreage of cropland is limited primarily
because of a highwater table and the frequency of flooding.
8
8|PageFigure 2- 2. Ecoregions of South Carolina
Lower Savannah River Watershed Study Area
The study area covers about 188 square miles and has five 12-digit HUC watersheds. Hog
Branch-Savannah River, the largest watershed, crosses the Georgia-South Carolina border to
cover the western portion of the study area. Black Swamp and Cypress Branch watersheds
cover the northern and northeastern portions of the study area, while Coleman Run and Sand
Branch watersheds span the southern and southeastern areas of the study area.
The HUC assigned by the United States Geological Survey (USGS) for the Lower Savannah River
is HUC 03060109. The area of the five watersheds is shown in Table 2- 1.
9
9|PageTable 2- 1. Lower Savannah River Watersheds
Lower Savannah River Watersheds, HUC and Area
Watershed Hydrologic Unit Code (HUC) Area in Acres
Coleman Run 030601090303 16,857
Hog Branch-Savannah River 030601090107 42,381
Cypress Branch 030601090301 9,930
Sand Branch 030601090304 21,462
Black Swamp 030601090302 29,710
Total 120,341
Physical Features
Topography
The study area is located in a region of coastal lowlands,
coastal plains, river systems, drowned estuaries, tidal
marshes, islands and beaches along the Atlantic coast. The
region is mostly level to gently sloping and has low relief
(source).
Error! Reference source not found. shows elevation in the
study area ranges from 132 feet above sea level in the
northern and western edges, to lower than 10 feet (NAVD
88) at the southern tip. The lowest gradients are on the
South Carolina side of the Savannah River. The only bluffs
are on the Georgia side, which generally has higher
elevations.
Soils
Figure 2- 3. A digital elevation model (DEM)
Soils in the study area typically formed in alluvium on depicting the elevations in study area (NAVD 88).
floodplains, in depressions and on terraces. The dominant
soil orders are Spodosols and Ultisols and they consist of very deep, well drained to very poorly
drained, and loamy or clayey. The soil type and soil drainage class are important factors
10
10 | P a g eYou can also read