Loss of Resilience in Human Mobility across Severe Tropical Cyclones of Different Magnitudes
←
→
Page content transcription
If your browser does not render page correctly, please read the page content below
Wang et al.                                                       Loss of Resilience in Human Mobility across Disasters

   Loss of Resilience in Human Mobility
    across Severe Tropical Cyclones of
           Different Magnitudes

                    Yan Wang                                                      Qi Wang
  Department of Urban and Regional Planning                      Department of Civil and Environmental
    Florida Institute for Built Environment                                  Engineering
                   Resilience                                           Northeastern University
             University of Florida                                          ryan.qi.wang@gmail.com
                 yanw@ufl.edu

                                                 John Taylor
                              School of Civil and Environmental Engineering
                                               Georgia Tech
                                                    jet@gatech.edu

ABSTRACT
Severe tropical cyclones impose threats on highly populated coastal urban areas, thereby, understanding and
predicting human movements plays a critical role in evaluating disaster resilience of human society. However,
limited research has focused on tropical cyclones and their influence on human mobility resilience. This
preliminary study examined the strength and duration of human mobility perturbation across five significant
tropical storms and their affected eight urban areas using Twitter data. The results suggest that tropical cyclones
can significantly perturb human movements by changing travel frequencies and displacement probability
distributions. While the power-law still best described the pattern of human movements, the changes in the radii
of gyration were significant and resulted in perturbation and loss of resilience in human mobility. The findings
deepen the understanding about human-environment interactions under extreme events, improve our ability to
predict human movements using social media data, and help policymakers improve disaster evacuation and
response.

Keywords
Disaster resilience, human mobility, social media, tropical cyclones.

INTRODUCTION
Intensifying tropical cyclones severely threaten coastal urban areas where human activities are intensive and
complex (Emanuel, 2013; Knutson, et al., 2010; Hao & Wang, 2019; 2020). A tropical storm that reaches
maximum sustained winds of 74 miles per hour is classified as a hurricane or typhoon depending on the location
(i.e., in the North Atlantic, central North Pacific, and eastern North Pacific, the term hurricane is used; while in
the Northwestern Pacific Basin, typhoon is more commonly used). Over the past 100 years, the continental United
States has suffered about $10 billion a year in damages (Pielke Jr, et al., 2008). Such damage is expected to
increase as a result of the growing concentration of people and properties in the coastal areas. Hurricane Sandy
(2012) caused at least 43 deaths and up to $50 billion in economic loss in New York City, making it the most
expensive natural disaster in 2012 (Ferris et al., 2013). Typhoon Haiyan (2013) destroyed Tacloban, a city with a
population of more than 220,000 people (BBC, 2013). Typhoon Rammasun, a category four typhoon in 2014,
caused over 150 fatalities in multiple countries (Khanh, 2014). The Philippines alone suffered 106 fatalities and
1,250 injuries (Council, 2014). The loss of life, immense human suffering, and severe economic loss from these
events call for innovative research and technologies to improve disaster evacuation, response, and relief (Gao &
Wang 2021).

                          WiP Paper – Social Media for Disaster Response and Resilience
                    Proceedings of the 18th ISCRAM Conference – Blacksburg, VA, USA May 2021
                       Anouck Adrot, Rob Grace, Kathleen Moore and Christopher Zobel, eds.                       755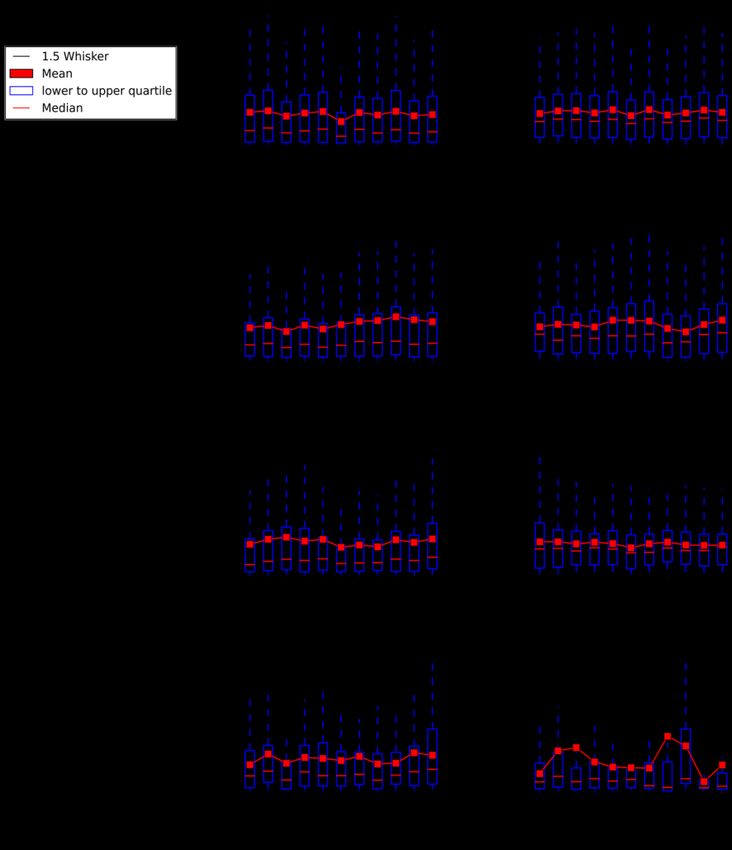
Wang et al.                                                        Loss of Resilience in Human Mobility across Disasters

One such innovation is studying human mobility using large quantities of empirical data collected from voluntarily
reported geolocations from social networking platforms, e.g. Twitter or mobile device apps. Such studies could
potentially improve the understanding and prediction of human locations and routes during the occurrences of
disasters. Thus, they can help guide the development of disaster response strategies (Pan et al., 2007; Schneider
et al., 2011). Without a deep understanding of human mobility during disasters, response plans may be ineffective.
Researchers have reported the diversity of individual and household decision-making during the occurrence of
natural disasters (Dash and Gladwin, 2007; Dow and Cutter, 1998; Lindell et al., 2005). In Hurricane Sandy’s
case, while 71 percent of people living in evacuation areas were aware of a mandatory order to move, more than
50 percent of them stayed nonetheless. Unfortunately, most of the fatalities occurred in the mandatory evacuation
zones (CDC, 2013). Even people who evacuated were not entirely safe: the data from FEMA showed that the
flooding areas were much larger than the evacuation areas, putting people who stayed in the assumed safe areas
in severe threat (Rosenzweig and Solecki, 2014). Similar situations happened during the attack of Typhoon
Haiyan. While people were ordered to seek shelter in the City of Tacloban, many people moved to concrete
buildings instead of seeking higher ground. Many of these buildings were flooded and collapsed and claimed
people’s lives (Teves and Bodeen, 2013). These tragedies demonstrate that understanding human movements
during the occurrence of disasters, rather than assuming people’s responses and movements, is crucial to
developing effective disaster response strategies and long-term resilient urban planning.

BACKGROUND
Existing research has discovered patterns in human mobility. Two parameters are used to measure human
mobility: the exponent β of a power-law probability distribution, which governs human mobility (Brockmann et
al., 2006; Cheng et al., 2011; Gonzalez et al., 2008), and the radius of gyration rg, which captures the size of an
individual’s activity space (Gonzalez, et al., 2008). Researchers have studied currency circulation data and mobile
phone data and confirmed that human movements follow a power-law distribution, with β values ranging from
1.59 to 1.88 (Brockmann, et al., 2006; Cheng, et al., 2011; Gonzalez, et al., 2008). The universal distribution
means that human movements can generally be described by the Lévy flight model, which is typically found in
animals’ movement patterns (Ramos-Fernandez, et al., 2004). Research has also shown that individual movement
trajectories exhibited similar shapes after being rescaled by the radius of gyration (Gonzalez, et al., 2008). It has
also been discovered that human mobility shows uneven frequencies of visitations (2010).
Human movement at the city scale also shows common patterns. Periodic modulations dominate human
movements in urban scales (Cho et al., 2011; Liang et al., 2012). Urban dwellers are found to exhibit similar
movement patterns across 31 cities (Noulas et al., 2012), and they naturally choose the most efficient
configurations if a trip involves multiple stops (Schneider et al., 2013). Researchers from urban science also
investigated the relationship between human mobility and socioeconomic status with mobile phone data and found
that the relationship was influenced by the spatial arrangement of housing, employment opportunities, and human
activities (Wang et al., 2018; Xu et al., 2018). Another study demonstrates the usefulness of WiFi access data in
analyzing human mobility patterns and behaviors in heterogeneous urban environments (Traunmueller et al.,
2018). Explicitly or implicitly, these studies assumed people were in steady states, i.e., their movements were not
disturbed by changes in the external environment. However, studies have demonstrated that external changes,
such as exacerbation of weather conditions, natural disasters, and man-made extreme events, can significantly
perturb human movements (Bengtsson et al., 2011; Brum-Bastos et al., 2018; Horanont et al., 2013).
Unfortunately, limited research has focused on human mobility perturbations or attempted to discover mobility
patterns related to human mobility perturbation.
This study attempts to reveal a fundamental pattern in human mobility perturbation: the loss of resilience.
Resilience in human mobility refers to the ability of human movements to absorb shocks, maintain the
fundamental attributes, and return to equilibrium in steady states (Cutter, et al., 2008). Research has shown that
assessment and leverage of resilience are critical to reducing the vulnerability of human societies and communities
when facing disasters (Burby et al., 2000; Godschalk, 2003). Humans exhibit diverse coping mechanisms and
behavioral adaptions when facing natural hazards and changes in weather conditions (Bagrow et al., 2011;
Bengtsson, et al., 2011; Horanont, et al., 2013). These findings led to the discovery of inherent resilience in human
mobility (Wang and Taylor, 2014b; Wang et al., 2017). It was found that the power-law governed urban human
mobility in New York City during the striking of Hurricane Sandy, and both the shifting distances of the centers
of movements and the radii of gyrations of movements correlated to the steady-state values. Although the
discovery of human mobility resilience is of critical importance, little evidence is available to validate that
resilience can withstand stronger tropical cyclones. We need to understand and evaluate its limits to improve
human mobility resilience.

METHODOLOGY

                           WiP Paper – Social Media for Disaster Response and Resilience
                     Proceedings of the 18th ISCRAM Conference – Blacksburg, VA, USA May 2021
                        Anouck Adrot, Rob Grace, Kathleen Moore and Christopher Zobel, eds.                       756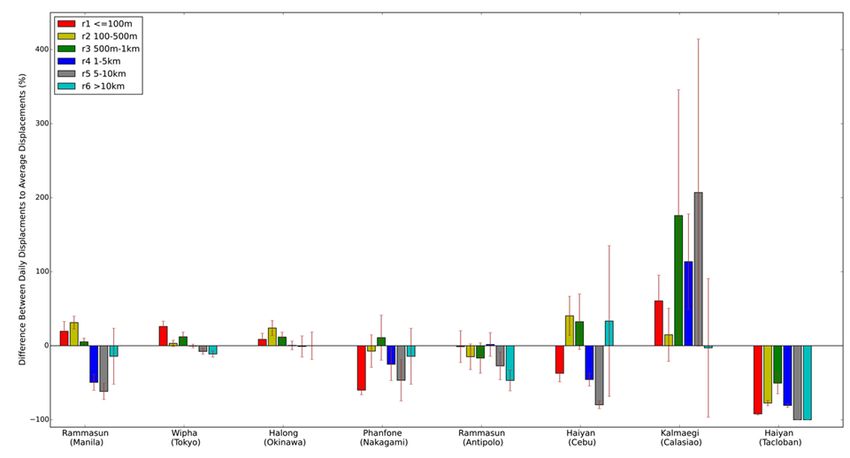
Wang et al.                                                        Loss of Resilience in Human Mobility across Disasters

This study examines how human mobility resilience is impacted during and after the landfall of tropical cyclones.
We investigated the most significant hurricanes in 2013 and 2014 tropical cyclone seasons and human mobility
in their influenced urban areas.

Hypotheses Development
Based on existing literature, we developed three hypotheses to test human mobility under the influence of tropical
cyclones. Pondering on the question of how hurricanes influence human mobility perturbation, we developed our
first hypothesis:
Hypothesis 1: Hurricanes of distinct wind speed in different areas cause perturbations on human mobility
following similar temporal patterns.
If human mobility perturbations show different patterns, what are the causes of the changes? To answer this
question, we examined two parameters to quantify such perturbations. As previously mentioned, two parameters
were used to capture the fundamental patterns in human mobility: the scaling parameter, β, and the radius of
gyration, rg. Therefore, we developed our second and third hypotheses as follows:
Hypothesis 2: The loss of resilience of human mobility comes from a fundamental deviation from power-law.
Hypothesis 3: The loss of resilience in human mobility comes from the aggregate effects of individuals changing
their radii of gyrations.

Data Collection
Empirical data of human mobility were collected using Twitter, which is a large-scale social networking platform.
Twitter data has been used to study critical issues in civil and urban engineering and its geo-locating function
provides an open and viable venue to study human mobility (Hawelka, et al., 2014; Sutton, 2009; Wang and
Taylor, 2014a). Twitter data has also demonstrated its usefulness in disaster management for different purposes
(Huang et al., 2017). We collected human mobility data by continuously streaming global geo-tagged tweets. Each
geo-tagged tweet contains a geographical coordinate as well as other information, such as tweet ID, user ID,
username, the content of the message, etc. The accuracy of the geographical coordinate is up to 10 meters. Python
was used to design a data collection system that streams geo-tagged tweets in real time. The data collection effort
started in October 2012, and the system has since been running continuously. Each day during the study period
about 9.5 million geo-tagged tweets are collected into the database worldwide. For more information about the
data collection, see (Wang and Taylor 2016).
The human movement data were retrieved for all the typhoons over 2012 to 2014. After filtering out the ones
without sufficient data entries, high-resolution human mobility data collected from eight areas under the
influences of five typhoons were used for this study. These cases are (1) Tokyo, Japan (Typhoon Wipha, 2013),
(2) Tacloban, Philippines (Typhoon Haiyan, 2013), (3) Cebu, Philippines (Typhoon Haiyan, 2013), (4) Antipolo,
Philippines (Typhoon Rammasun, 2014), (5) Manila, Philippines (Typhoon Rammasun, 2014), (6) Okinawa,
Japan (Typhoon Halong, 2014), (7) Nakagami, Japan (Typhoon Phanfone, 2014), (8) Calasiao, Philippines
(Typhoon Kalmaegi, 2014). The methodology of data collection and analysis are described in the following sub-
sections. To test if the occurrences of human mobility perturbation were caused by the attacks of the cyclones, we
compared the human movements in different days. We assumed the day each typhoon made landfall was Day 0,
and then we retrieved displacement data on that day. Displacement data were also retrieved from the 15 days
before the landfall (-) and the 17 days after the landfall (+). Each day was assumed to start at 3 am local time since
most of the Twitter activities start to emerge then. We assumed the perturbation state (Dp) is the 24-hour period
over which a hurricane made landfall. The steady state (Ds) is normal days that are at least one week before or
after the landfall of the typhoons. In total, we collected 1,688,319 geo-tagged tweets from 123,938 individuals in
the eight cases.

Data Analysis
We conducted several analyses on the data. First, we analyzed the perturbation strength for each case by examining
the changes in the distributions of displacements. We calculated the probability distributions for both Dp and Ds,
and let dE = [dE (1), dE (2),…, dE (dmax)] be Euclidean distance between the two distributions. Therefore, dE
demonstrates the perturbation strength between human mobility in a perturbation state and a steady state in each
case.
Then we calculated the displacements of human movements in each case. A displacement d is the distance between
two consecutive coordinates of the same individual. The Haversine formula was used to calculate the distances

                           WiP Paper – Social Media for Disaster Response and Resilience
                     Proceedings of the 18th ISCRAM Conference – Blacksburg, VA, USA May 2021
                        Anouck Adrot, Rob Grace, Kathleen Moore and Christopher Zobel, eds.                       757
Wang et al. Loss of Resilience in Human Mobility across Disasters
(Robusto, 1957):
− − 1
d = 2r sin −1 sin 2 2 1 + cos 1 cos 2 sin 2 2
2 2
where r is the earth radius, which approximately equals to 6,367,000 meters, ϕ is the latitude, and φ is the
longitude.
For each case, the displacement data for each 24-hour period were fitted to the truncated power-law distribution.
A truncated power-law is represented as:
P(r ) r − e − r
where Δr is the displacement, β is the exponent parameter, λ is the exponential cutoff value. Due to the heavy tails
of the empirical data, we applied the procedure of logarithmic binning to reduce the noise of the empirical data
(Newman, 2005; Yan et al., 2013). The procedure follows the introduction from Milojević’s study (Milojević,
2010). For each B, the binned value yB equals to average numbers of displacements d inside the B:
yB =
d
Bmax − Bmin
where Bmax is the upper limit of B and Bmin is the lower limit of B. The logarithmic binning was started from d = 9
with each bin (B) size equal to 0.05, i.e. log(Bmax) - log(Bmin) = 0.05. We also conducted a Kolmogorov-Smirnov
(KS) test and Maximum Likelihood Estimation (MLE) to compare truncated power-law distribution to both
exponential distribution and lognormal distribution.
To calculate the value of the radius of gyration, we first calculated the center of mass of human movements using
the following equation (Gonzalez, et al., 2008):
1 n (t )
rCM = ri
n(t ) i =1
where n(t) was the number of locations an individual visited in the 24 hours, ri was the coordinate. Then the
following formula was used to calculate the radius of gyration:
2
n (t )
2 2 − CM − CM
2r sin −1
1
rg = sin + cos1 cos2 sin 2 2
n(t ) 2 2
i =1
where the symbols are the same as indicated above.
RESULTS AND DISCUSSION
By analyzing the perturbation strengths (dE), we discovered that human mobility experienced different magnitudes
of perturbations in different cases. We collected wind speed data from reports and weather station records. The
results between dE and the wind speeds are shown in Fig. 1.
WiP Paper – Social Media for Disaster Response and Resilience
Proceedings of the 18th ISCRAM Conference – Blacksburg, VA, USA May 2021
Anouck Adrot, Rob Grace, Kathleen Moore and Christopher Zobel, eds. 758Wang et al. Loss of Resilience in Human Mobility across Disasters
Figure 1. Wind Speed and Perturbation Degree
We observe that more powerful typhoons characterized by higher wind speed are likely to cause stronger human
mobility perturbations. This finding is critical yet not surprising. Higher wind speeds are associated with tropical
cyclones of a stronger power, causing more precipitation, gusts, power outages, transportation failures, and even
occurrences of other natural hazards, such as storm surge, floods, and landslides. The correlation supports the
common assumption that all of these consequences can cause stronger perturbation in human mobility. The
correlation also shows that although the occurrences of typhoons influence human mobility, determining the
magnitudes of perturbation is a complex task and can be influenced by multiple causes. Such complexity deserves
further study.
We studied the displacements before, during, and after landfall of the tropical cyclones. We scaled the numbers
of displacements by dividing each day’s value by the average value from Day -14 to Day -7. The scaling allowed
us to compare the magnitudes of perturbations from different cases directly. The analytical results revealed three
distinct perturbation patterns. First, in the cases of Tokyo, Okinawa, and Manila (Fig. 2 grey lines), the numbers
of displacements in the perturbation states changed by less than 20% compared to the steady states. The
magnitudes of perturbation reduced quickly and returned to the average values within days. Most of the
fluctuations were rather mild, within 20 percent. Second, in the cases of Cebu, Antipolo, Calasiao, and Nakagami
(Fig. 2 blue lines), the changes were much stronger, up to 60% compared to the average values in the perturbation
states. The numbers of displacements kept shifting around the average without reducing the perturbation
magnitudes even after two weeks. Last, in the case of Tacloban (Fig. 2 red lines), the number of movements
reduced dramatically after the landfall of Typhoon Haiyan. The value remained on a very low level and showed
no signs of resuming after two weeks. The severe perturbations are mainly attributed to the devastating storm
surge, which destroyed many buildings, vehicles, and trees. The flooding also extended for 1 km inland on the
east coast of the city, causing large-scale infrastructure destruction and loss of lives.
WiP Paper – Social Media for Disaster Response and Resilience
Proceedings of the 18th ISCRAM Conference – Blacksburg, VA, USA May 2021
Anouck Adrot, Rob Grace, Kathleen Moore and Christopher Zobel, eds. 759Wang et al. Loss of Resilience in Human Mobility across Disasters
Figure 2. Changes of Total Displacements
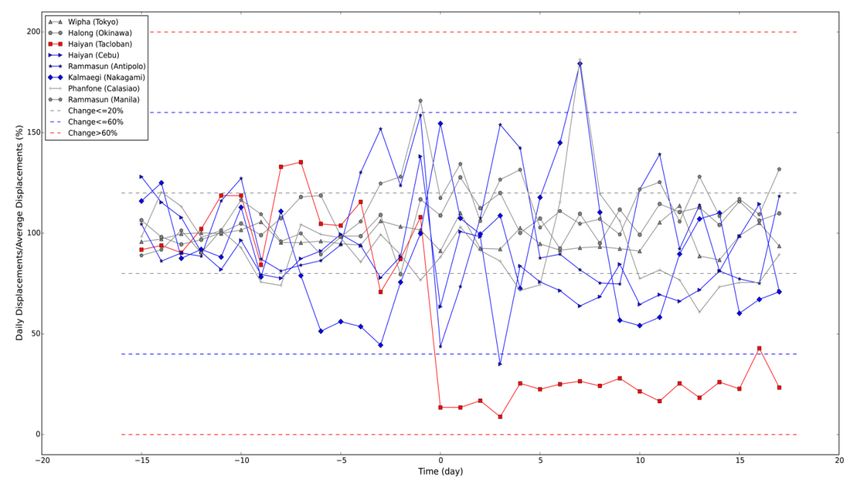
We also analyzed the daily numbers of displacements (Ni) in six ranges of distance for each case. The six ranges
were: (1) 1-100m, (2) 100-500m, (3) 500m-1km, (4) 1-5km, (5) 5-10km, and (6) over 10km. The numbers of
displacements at different ranges of distances experienced noticeable, although diverse, perturbations (Fig. 3).
Similarly, the results displayed three different patterns as well. First, when the strength of perturbation was
relatively low, i.e. in the cases of Tokyo, Okinawa, and Manila, there was a clear trend that people increased their
short-distance travels and reduced their long-distance travels. However, when tropical cyclones were attacking an
urban area with strong winds, the changes started to become more chaotic. This second pattern could be observed
in the cases of Cebu, Antipolo, Calasiao, and Nakagami. Changes happened at all distances and there were no
clear, distinguishable patterns, although it was observed that the magnitudes of changes increased with the growth
of dE. The third pattern was observed in the case of Tacloban, where displacements at all levels decreased
dramatically, and long-distance travel disappeared entirely.
Figure 3. Changes in Displacements at Different Ranges
The results of the analysis on displacements demonstrated that stronger perturbations show entirely different
WiP Paper – Social Media for Disaster Response and Resilience
Proceedings of the 18th ISCRAM Conference – Blacksburg, VA, USA May 2021
Anouck Adrot, Rob Grace, Kathleen Moore and Christopher Zobel, eds. 760Wang et al. Loss of Resilience in Human Mobility across Disasters
patterns. Therefore, we found support for Hypothesis 1. The examination of Hypothesis 1 has identified the
fundamental attributes to the impact of typhoons on the resilience in human mobility: the magnitude of typhoons
(i.e. wind speed) and the perturbation patterns. The different patterns also suggested a key finding: Human
mobility possesses inherent resilience, but resilience has its limitations. When a typhoon is extremely powerful,
such as Typhoon Haiyan, the resilience can collapse.
To understand the cause of the collapse (Hypothesis 2), we first analyzed human mobility data for every 24 hours
from all of the cases. We fitted each dataset into the truncated power-law distribution (Fig. 4). The results were
surprising; although having different values of scaling-invariances, almost all of the data from different cases
followed truncated power-law distributions. The power-law dominates human mobility patterns, even during most
of the days in Tacloban during the attack of Typhoon Haiyan. Therefore, we rejected Hypothesis 2.
Although Hypothesis 2 is rejected, the analysis result implies an important discovery. While previous research
has demonstrated that human mobility follows similar patterns across multiple big cities around the world (Noulas,
et al., 2012), our finding further establishes that human mobility follows power-law distribution in perturbation
states even when typhoons impact it with different strengths.
Figure 4. Human Mobility Distributions
To investigate Hypothesis 3, we calculated the values of the radius of gyration (rg) before (-), during (0), and after
(+) the landings of typhoons for each 72 hours. We only included the active users, each of whom reported at least
five locations in the 72-hour periods. Each individual’s rg was calculated (Fig. 5). Comparing data in each set, we
found that the changes in rg of human movements aligned with the patterns we found in the displacement analysis.
WiP Paper – Social Media for Disaster Response and Resilience
Proceedings of the 18th ISCRAM Conference – Blacksburg, VA, USA May 2021
Anouck Adrot, Rob Grace, Kathleen Moore and Christopher Zobel, eds. 761Wang et al. Loss of Resilience in Human Mobility across Disasters
With increasing perturbation degrees, the magnitudes of changes in rg increased. The values of rg eventually
declined when the perturbation was extremely strong, this was demonstrated in Tacloban as rg experienced a
significant reduction due to the destructive power unleashed by Typhoon Haiyan. Therefore, we found support
for Hypothesis 3.
Figure 5. Changes in the Radius of Gyration
CONCLUSION
A recent white paper released from the National Academies of Sciences, Engineering, and Medicine (Cutter et al.
2019) addresses the lack of longitudinal data and systems for measuring the human dimensions of resilience and
encourages the employment of big data in resilience science. Taking advantage of crowdsourced individuals’
geolocations collected from social media microblogs posted on Twitter, this research measures human mobility
resilience across tropical cyclone cases. Our preliminary analysis of displacements demonstrated three patterns
for human mobility while influenced by severe tropical cyclones. While displacements from all cases suffered
temporary fluctuations, the three cases with smaller dE absorbed the perturbations quickly (Pattern 1). However,
with the increasing perturbation degree, it became increasingly difficult to absorb the shocks. Human mobility
experienced a higher magnitude of fluctuation and required a longer period to return to equilibrium (Pattern 2). In
the case of Typhoon Haiyan in Tacloban, human mobility collapsed, and the movements dropped to an extremely
low level (Pattern 3).
To understand the perturbation and loss of resilience, we tested two sets of hypotheses. The analysis on the first
set allowed us to find those stronger perturbations in human mobility exhibit significantly different patterns from
the weaker ones. Low-magnitude perturbation often exhibits mild fluctuations in travel frequencies and distances
and returns to its equilibrium in a short period. High-magnitude perturbation, on the other hand, forces human
movements to significantly deviate from their balance more erratically, taking a significantly longer time to return
WiP Paper – Social Media for Disaster Response and Resilience
Proceedings of the 18th ISCRAM Conference – Blacksburg, VA, USA May 2021
Anouck Adrot, Rob Grace, Kathleen Moore and Christopher Zobel, eds. 762Wang et al. Loss of Resilience in Human Mobility across Disasters
to equilibrium. While low-magnitude perturbation is linear and shows a clear pattern of oscillation, the high-
magnitude perturbation is non-linear, chaotic, and more difficult to predict.
These findings highlight the possibility that human mobility can lose its resilience in extreme conditions. When
experiencing mild influences from tropical cyclones, human mobility suffers temporary perturbation but strives
to return to its state of equilibrium. However, powerful influences from severe tropical cyclones, or disasters in
general, can destroy established resilience in human mobility, forcing individuals to deviate from their routines
and adapt to new environments. The process is often more time-consuming, unpredictable, and associated with
the collapse of established equilibriums.
Although tropical cyclones can trigger different patterns of human mobility perturbation, we found that a truncated
power-law governs human mobility universally, even when influenced by extremely powerful natural disasters,
such as Typhoon Haiyan. While this finding confirms that the power-law is the fundamental pattern in human
mobility (Brockmann, et al., 2006; Gonzalez, et al., 2008), it also suggests that perturbation and the collapse of
human mobility are not caused by the deviation from power-law. The scaling parameter β is an insensitive factor
and cannot be used to capture these phenomena in human movements.
Instead, the perturbation and loss of resilience of human mobility are more likely to be the results of individuals
changing their radii of gyrations. We found that the radius of gyration is not only a key parameter to describe the
fundamental patterns on the individual level (Gonzalez, et al., 2008), but also a critical factor to capture and
analyze perturbations in aggregated human mobility. This links human mobility perturbation from the micro-level
to the macro-level, enabling more accurate location and travel predictions during the occurrence of natural
disasters to minimize loss of life and human suffering. With more detailed spatial data of urban environments and
local communities' socioeconomic and mitigation planning data, the research findings can also inform human-
infrastructure interactions and resilient urban planning. Our future work will include more cases of severe tropical
cyclones to achieve generalizable findings. We will consider the impact of disaster mitigation strategies (Berke et
al. 2012), early warnings (Gao & Wang 2021), and spatial arrangement of facilities (Xu et al. 2020) in further
investigations on human mobility resilience, while also ensuring vulnerable populations are well-represented in
the analysis (Samuels and Taylor, 2020) and taking into consideration social media activity drop-offs (Samuels,
et al., 2020). Future studies can also explore human-centered resilience measurement by integrating finer-scale
damages derived from multi-modal social media data (Hao & Wang 2020; Wang et al. 2020) across severe tropical
cyclones.
ACKNOWLEDGEMENTS
This study was supported by the National Science Foundation under Grant No. 1760645. Any opinions,
findings, and conclusions or recommendations expressed in this material are those of the authors and do not
necessarily reflect the views of the National Science Foundation.
REFERENCES
Bagrow, J. P., Wang, D., & Barabasi, A.-L. (2011). Collective response of human populations to large-scale
emergencies, PloS ONE, 6, e17680.
BBC. (2013) Tacloban: City at the centre of the storm, Retrieved on February 13, 2021, Retrieved from
https://www.bbc.com/news/world-asia-24891456.
Berke, P., Smith, G., & Lyles, W. (2012). Planning for resiliency: Evaluation of state hazard mitigation plans
under the disaster mitigation act. Natural Hazards Review, 13(2), 139-149.
Bengtsson, L., Lu, X., Thorson, A., Garfield, R., & von Schreeb, J. (2011) Improved response to disasters and
outbreaks by tracking population movements with mobile phone network data: a post-earthquake geospatial
study in Haiti, PLoS Medicine, 8, e1001083.
Brockmann, D., Hufnagel, L., & Geisel, T. (2006) The scaling laws of human travel, Nature, 439, 462-465.
Brum-Bastos, V. S., Long, J. A., & Demšar, U. (2018) Weather effects on human mobility: a study using multi-
channel sequence analysis, Computers, Environment and Urban Systems, 71, 131-152.
Burby, R. J., Deyle, R. E., Godschalk, D. R., & Olshansky, R. B. (2000) Creating hazard resilient communities
through land-use planning, Natural Hazards Review, 1, 99-106.
Cutter, S. L., Emrich, C. T., Gall, M., Harrison, S., McCaster, R. R., Derakhshan, S., & Pham, E. (2019). Existing
longitudinal data and systems for measuring the human dimensions of resilience, health, and well-being in the
Gulf Coast (white paper). The National Academies of Science, Engineering, and Medicine, Washington, DC.
CDC (2013) Deaths Associated with Hurricane Sandy — October–November 2012, Atlanta, GA: Center for
WiP Paper – Social Media for Disaster Response and Resilience
Proceedings of the 18th ISCRAM Conference – Blacksburg, VA, USA May 2021
Anouck Adrot, Rob Grace, Kathleen Moore and Christopher Zobel, eds. 763Wang et al. Loss of Resilience in Human Mobility across Disasters
Disease Control and Prevention.
Cheng, Z., Caverlee, J., Lee, K., & Sui, D. Z. (2011). Exploring Millions of Footprints in Location Sharing
Services, ICWSM, 2011, 81-88.
Cho, E., Myers, S. A., & Leskovec, J. (2011) Friendship and mobility: user movement in location-based social
networks, Proceedings of the 17th ACM SIGKDD International Conference on Knowledge Discovery and
Data Mining, 1082-1090.
Council, N. D. R. R. a. M. (2014) NDRRMC Update: Final Report re Effects of Typhoon "Glenda" (Rammasun),
Retrieved on February 13, 2021, Retrieved from https://reliefweb.int/report/philippines/ndrrmc-update-sitrep-
no-05-re-effects-typhoon-glenda-rammasun.
Cutter, S. L., Barnes, L., Berry, M., Burton, C., Evans, E., Tate, E., & Webb, J. (2008) A place-based model for
understanding community resilience to natural disasters, Global Environmental Change, 18, 598-606.
Dash, N., & Gladwin, H. (2007) Evacuation decision making and behavioral responses: Individual and household,
Natural Hazards Review, 8, 69-77.
Dow, K., & Cutter, S. L. (1998) Crying wolf: Repeat responses to hurricane evacuation orders, Coastal
Management, 26, 16.
Emanuel, K. A. (2013) Downscaling CMIP5 climate models shows increased tropical cyclone activity over the
21st century, Proceedings of the National Academy of Sciences, 110, 12219-12224.
Ferris, E., Petz, D., & Stark, C. (2013) The Year of Recurring Disaster: A Review of Natural Disasters in 2012,
The Brokings Institution, London School of Economics.
Gao, S., & Wang, Y. (2021). Assessing the impact of geo-targeted warning messages on residents’ evacuation
decisions before a hurricane using agent-based modeling. Natural Hazards, 1-24.
Godschalk, D. (2003) Urban Hazard Mitigation: Creating Resilient Cities, Natural Hazards Review, 4, 136-143.
Gonzalez, M. C., Hidalgo, C. A., & Barabasi, A.-L. (2008) Understanding individual human mobility patterns,
Nature, 453, 779-782.
Hao, H., & Wang, Y. (2020). Leveraging multimodal social media data for rapid disaster damage assessment.
International Journal of Disaster Risk Reduction, 51, 101760.
Haiyan Hao, & Yan Wang. (2020). Hurricane damage assessment with multi-, crowd-sourced image data: a case
study of Hurricane Irma in the City of Miami. In Amanda Hughes, Fiona McNeill, & Christopher W. Zobel
(Eds.), ISCRAM 2020 Conference Proceedings – 17th International Conference on Information Systems for
Crisis Response and Management (pp. 825–837). Blacksburg, VA (USA): Virginia Tech.
Hawelka, B., Sitko, I., Beinat, E., Sobolevsky, S., Kazakopoulos, P., & Ratti, C. (2014) Geo-located Twitter as
proxy for global mobility patterns, Cartography and Geographic Information Science, 41, 260-271.
Horanont, T., Phithakkitnukoon, S., Leong, T. W., Sekimoto, Y., & Shibasaki, R. (2013) Weather Effects on the
Patterns of People's Everyday Activities: A Study Using GPS Traces of Mobile Phone Users, PloS One, 8,
e81153.
Huang, Q., Cervone, G., & Zhang, G. (2017) A cloud-enabled automatic disaster analysis system of multi-sourced
data streams: An example synthesizing social media, remote sensing and Wikipedia data, Computers,
Environment and Urban Systems, 66, 23-37.
Khanh, V. T. (2014) Typhoon Rammasun Leaves Wide Swath of Damage: Death Toll Continues to Climb After
Unleashing Floods in Vietnam, Hanoi, Vietnam, Retrieved on February 13, 2021, Retrieved from
https://www.wsj.com/articles/typhoon-rammasun-leaves-more-than-100-dead-1405920879.
Knutson, T. R., McBride, J. L., Chan, J., Emanuel, K., Holland, G., Landsea, C., Held, I., Kossin, J. P., Srivastava,
A., & Sugi, M. (2010) Tropical cyclones and climate change, Nature Geoscience, 3, 157-163.
Liang, X., Zheng, X., Lv, W., Zhu, T., & Xu, K. (2012) The scaling of human mobility by taxis is exponential,
Physica A: Statistical Mechanics and its Applications, 391, 2135-2144.
Lindell, M. K., Lu, J.-C., & Prater, C. S. (2005) Household decision making and evacuation in response to
Hurricane Lili, Natural Hazards Review, 6, 4, 171-179.
Milojević, S. (2010) Power law distributions in information science: Making the case for logarithmic binning,
Journal of the American Society for Information Science and Technology, 61, 2417-2425.
Newman, M. E. (2005) Power laws, Pareto distributions and Zipf's law, Contemporary Physics, 46, 323-351.
Noulas, A., Scellato, S., Lambiotte, R., Pontil, M., & Mascolo, C. (2012) A tale of many cities: universal patterns
in human urban mobility, PLoS ONE, 7, e37027.
WiP Paper – Social Media for Disaster Response and Resilience
Proceedings of the 18th ISCRAM Conference – Blacksburg, VA, USA May 2021
Anouck Adrot, Rob Grace, Kathleen Moore and Christopher Zobel, eds. 764Wang et al. Loss of Resilience in Human Mobility across Disasters
Pan, X., Han, C. S., Dauber, K., & Law, K. H. (2007) A multi-agent based framework for the simulation of human
and social behaviors during emergency evacuations, AI & Society, 22, 113-132.
Pielke Jr, R. A., Gratz, J., Landsea, C. W., Collins, D., Saunders, M. A., & Musulin, R. (2008) Normalized
hurricane damage in the United States: 1900–2005, Natural Hazards Review, 9, 1, 29-42.
Ramos-Fernandez, G., Mateos, J. L., Miramontes, O., Cocho, G., Larralde, H., & Ayala-Orozco, B. (2004) Lévy
walk patterns in the foraging movements of spider monkeys (Ateles geoffroyi), Behavioral Ecology and
Sociobiology, 55, 223-230.
Robusto, C. (1957) The cosine-haversine formula, The American Mathematical Monthly, 64, 38-40.
Rosenzweig, C., & Solecki, W. (2014) Hurricane Sandy and adaptation pathways in New York: Lessons from a
first-responder city, Global Environmental Change, 28, 395-408.
Samuels, R. and Taylor, J. (2020). “Deepening the Divide: Crises Disproportionately Silence Vulnerable
Populations on Social Media,” ASCE Journal of Management in Engineering, 36(6): 04020083. DOI:
10.1061/(ASCE)ME.1943-5479.0000848.
Samuels, R., Taylor, J. and Mohammadi, N. (2020). “Silence of the Tweets: Incorporating Social Media Activity
Drop-offs into Crisis Detection,” Natural Hazards, 103: 1455-1477. DOI: 10.1007/s11069-020-04044-2.
Schneider, C., Belik, V., Couronné, T., Smoreda, Z., & González, M. C. (2013) Unravelling daily human mobility
motifs, Journal of The Royal Society Interface, 10, 84, 20130246.
Schneider, C. M., Moreira, A. A., Andrade, J. S., Havlin, S., & Herrmann, H. J. (2011) Mitigation of malicious
attacks on networks, Proceedings of the National Academy of Sciences, 108, 3838-3841.
Song, C., Koren, T., Wang, P., & Barabasi, A.-L. (2010) Modelling the scaling properties of human mobility,
Nature Physics, 6, 818-823.
Sutton, J. N. (2009) Social media monitoring and the democratic national convention: New tasks and emergent
processes, Journal of Homeland Security and Emergency Management, 6, 1, 67.
Teves, O., & Bodeen, C. (2013) Haiyan Storm Surges Caught Philippines by Surprise, Retrieved on February 13,
2021. Retrieved from https://news.yahoo.com/haiyan-storm-surges-caught-philippines-surprise-
120256258.html.
Traunmueller, M. W., Johnson, N., Malik, A., & Kontokosta, C. E. (2018) Digital footprints: Using WiFi probe
and locational data to analyze human mobility trajectories in cities, Computers, Environment and Urban
Systems, 72, 4-12.
Wang, Q., Phillips, N. E., Small, M. L., & Sampson, R. J. (2018) Urban mobility and neighborhood isolation in
America’s 50 largest cities, Proceedings of the National Academy of Sciences, 115, 7735-7740.
Wang, Q., & Taylor, J. E. (2016). Process map for urban-human mobility and civil infrastructure data collection
using geosocial networking platforms. Journal of Computing in Civil Engineering, 30(2), 04015004.
Wang, Q., & Taylor, J. E. (2014a) Energy saving practice diffusion in online networks, Energy and Buildings, 76,
622-630.
Wang, Q., & Taylor, J. E. (2014b) Quantifying human mobility perturbation and resilience in Hurricane Sandy,
PloS ONE, 9, e112608.
Wang, Y., Taylor, J. E., & Garvin, M. J. (2020). Measuring Resilience of Human–Spatial Systems to Disasters:
Framework Combining Spatial-Network Analysis and Fisher Information. Journal of Management in
Engineering, 36(4), 04020019.
Wang, Y., & Taylor, J. E. (2017). Tracking urban resilience to disasters: a mobility network-based approach. In
ISCRAM.
Wang, Y., Wang, Q., & Taylor, J. E. (2017) Aggregated responses of human mobility to severe winter storms: An
empirical study, PloS ONE, 12, e0188734.
Xu, Y., Olmos, L. E., Abbar, S., & González, M. C. (2020). Deconstructing laws of accessibility and facility
distribution in cities. Science Advances, 6(37), eabb4112.
Xu, Y., Belyi, A., Bojic, I., & Ratti, C. (2018) Human mobility and socioeconomic status: Analysis of Singapore
and Boston, Computers, Environment and Urban Systems, 72, 17.
Yan, X.-Y., Han, X.-P., Wang, B.-H., & Zhou, T. (2013) Diversity of individual mobility patterns and emergence
of aggregated scaling laws, Scientific Reports, 3, 1, 1-5.
WiP Paper – Social Media for Disaster Response and Resilience
Proceedings of the 18th ISCRAM Conference – Blacksburg, VA, USA May 2021
Anouck Adrot, Rob Grace, Kathleen Moore and Christopher Zobel, eds. 765You can also read