Lightning Cessation Guidance Using Polarimetric Radar Data and Lightning Mapping Array in the Washington, D.C. Area
←
→
Page content transcription
If your browser does not render page correctly, please read the page content below
atmosphere

Article
Lightning Cessation Guidance Using Polarimetric Radar Data
and Lightning Mapping Array in the Washington, D.C. Area
John J. Drugan and Ari D. Preston *

                                          Department of Atmospheric Sciences, Northern Vermont University-Lyndon, Lyndonville, VT 05851, USA;
                                          jdrugan@versar.com
                                          * Correspondence: aaron.preston@northernvermont.edu

                                          Abstract: Polarimetric radar data and total lightning data are used to develop lightning cessation
                                          guidance for isolated cells in the Washington, D.C. area. A total of 23 non-severe thunderstorms
                                          during the 2015–2017 warm seasons are analyzed. Radar and lightning data are superimposed
                                          using the Warning Decision Support System–Integrated Information software to develop cessation
                                          algorithms. This includes using the hydrometeor classification algorithm to locate graupel for each
                                          convective cell. Results show that the three best-performing cessation algorithms use thresholds
                                          of (1) ZH ≥ 40 dBZ at −5 ◦ C, (2) ZH ≥ 35 dBZ at −10 ◦ C, and (3) graupel at −15 ◦ C. Lightning
                                          is not expected 15 min after the threshold is no longer met for each algorithm. These algorithms
                                          are recommended only for isolated cells in the Washington, D.C. area. Further study needs to be
                                          completed to draw conclusions for other convective cell types and different geographic regions.

                                          Keywords: lightning; radar; forecasting

                                          1. Introduction
Citation: Drugan, J.J.; Preston, A.D.           Lightning ranks as one of the deadliest weather phenomena. Each year, 50 casual-
Lightning Cessation Guidance Using
                                          ties and hundreds of injuries result from lightning strikes in the United States [1]. The
Polarimetric Radar Data and
                                          importance of forecasting lightning for the safety of the public is crucial, as well as cost
Lightning Mapping Array in the
                                          effective for outdoor businesses [2]. Most deaths occur before or mainly after peak light-
Washington, D.C. Area. Atmosphere
                                          ning activity [3]. This is because these flashes occur at times when lightning has not yet
2022, 13, 1111. https://doi.org/
                                          become threatening (e.g., first flash) or is no longer deemed threatening (e.g., last flash) [2].
10.3390/atmos13071111
                                          The most commonly used safety rule for lightning is the 30–30 rule [3], where the second
Academic Editor: Stefano Dietrich         “30” refers to the wait time in minutes before resuming outdoor activities after the most
Received: 18 May 2022
                                          recent lightning flash. However, 30 min is a lengthy amount of time to wait and can delay
Accepted: 25 June 2022
                                          business operations including aviation, construction, sports, and community events [4].
Published: 14 July 2022
                                          Furthermore, additional flashes can sometimes be observed even after waiting longer than
                                          30 min of no lightning activity [5]. Therefore, developing lightning cessation guidance can
Publisher’s Note: MDPI stays neutral
                                          assist outdoor safety measures.
with regard to jurisdictional claims in
                                                The noninductive charging process for isolated cells involves the electrification of
published maps and institutional affil-
                                          individual hydrometeors within the cloud and is independent of nearby electrical fields [6].
iations.
                                          Graupel, ice crystals, and supercooled water are the primary hydrometeors involved in
                                          this process where gravity and updrafts help to produce charge separation [7,8]. When ice
                                          crystals collide with graupel in the presence of supercooled water, the graupel will obtain
Copyright: © 2022 by the authors.
                                          a negative charge while the ice crystals obtain a positive charge [9]. Graupel primarily
Licensee MDPI, Basel, Switzerland.        obtains this charge in the mixed phase region of the cloud between 0 ◦ C and −20 ◦ C.
This article is an open access article    Positive charges are observed in temperatures warmer than 0 ◦ C [7,10]. Updrafts carry
distributed under the terms and           the lighter ice crystals to greater heights than the heavier graupel. This results in a tripole
conditions of the Creative Commons        charge structure with a positive layer at the top of the cloud, a negative layer of graupel in
Attribution (CC BY) license (https://     the middle, and another weaker positive charge at the bottom of the cloud with warmer
creativecommons.org/licenses/by/          graupel [11]. This charge separation eventually results in the first flash of a storm being
4.0/).                                    produced, as well as subsequent flashes [12]. A study by [5] showed that this mixed phase

Atmosphere 2022, 13, 1111. https://doi.org/10.3390/atmos13071111                                      https://www.mdpi.com/journal/atmosphere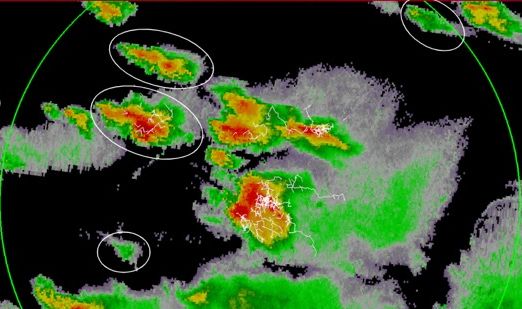
Atmosphere 2022, 13, 1111                                                                                            2 of 12

                            region is a crucial component of developing successful algorithms for lightning cessation
                            guidance.
                                   Several studies have already focused on lightning cessation guidance using different
                            variables and thresholds [5,13–19]. Some of these studies were more effective than others,
                            but non-isolated cells proved ineffective for cessation guidance due to the charging of
                            nearby cells [5,13]. Studies by [14,15] examined radar differential phase signatures and
                            vertical alignment of ice crystals near the end of lightning activity. They found that certain
                            alignments, shapes, sizes, and densities of ice crystals are present for cloud electrification
                            among larger horizontal reflectivity values. Furthermore, [16] correlated the timing of
                            flashes with vertically integrated ice crystals as guidance for lightning cessation. A study
                            by [17] used maximum interval guidance where a set time limit between flashes would
                            determine the possibility of another flash. The study found that most storms did not
                            produce another flash after 10 min of no lightning activity. However, [5] found cases
                            in which flashes were produced after 10 min of no lightning activity using polarimetric
                            radar data in the Cape Canaveral area of Florida. Their study examined the presence of
                            graupel at specific temperature levels in non-severe, isolated storms. The criterion for
                            isolation was defined as a cell being separated by less than 15 dBZ composite reflectivity
                            (i.e., ZH < 15 dBZ) from any other cells present. They determined that lightning advisories
                            could be lifted after a 10 min absence of (1) graupel at −10 ◦ C and (2) ZH ≥ 35 dBZ
                            at −10 ◦ C. Their cessation algorithm was only successful for isolated cells since non-
                            isolated cells could be charged by nearby storms and experience additional flashes even
                            after graupel was no longer present in the parent storm. A study by [13] attempted to
                            create cessation algorithms for non-isolated storms but found that their algorithms were
                            ineffective. More recently, [18] examined convective cells in the Washington, D.C. area
                            to develop a bootstrap model for lighting cessation guidance after its proven success for
                            storms in Florida [19]. However, the change in geographic region made their cessation
                            algorithm less effective than in the tropics. They found that thresholds designed to operate
                            in Florida ended up being lower in Washington, D.C. The findings in [18] demonstrate that
                            previous cessation guidance needs to be adjusted when examining a different geographic
                            climate. The presence of graupel diminished from upper levels to lower levels as lightning
                            ended, and their model predicted lightning cessation later than when it actually occurred.
                            They also determined that the existence of graupel at specified isotherm levels in the mixed
                            phase region played a crucial role in cloud electrification.
                                   The current study builds on that of [5] by developing wait time algorithms for lightning
                            cessation guidance, but in a different geographic region. This will help us determine how
                            effective a wait time algorithm approach is for cessation guidance in an environment
                            outside of central Florida. The goal is to develop comprehensive cessation guidance with a
                            tool that is easily adaptable to other geographic areas. This study will provide insight into
                            the feasibility of this and future operational utility. In fact, [5] recommended testing the
                            effectiveness of cessation algorithms in an area like Washington, D.C., due to its 3D lightning
                            network. The current study examines 23 isolated cells in the Washington, D.C. area. Similar
                            to [18], a different geographic region may require an algorithm adjustment for effective
                            cessation guidance as regional variations in thermodynamic environments can alter the
                            charge structure in a storm [20]. Freezing levels are found at varying altitudes depending
                            on tropospheric temperatures [21]. Therefore, the presence of graupel at −10 ◦ C may be
                            less effective for cessation algorithms in the Mid-Atlantic region compared to Florida. For
                            example, Washington, D.C., (23.3 ◦ C) has a 5-month warm season (May-September) average
                            surface temperature that is 3.5 ◦ C colder than the average surface temperature in the Cape
                            Canaveral area of Florida (26.8 ◦ C) during the warm season. This suggests that Washington,
                            D.C., will have lower freezing levels that could change the effectiveness of algorithms
                            for cessation guidance. Furthermore, different modes of convection also could impact
                            cessation algorithms. For example, sea breeze fronts are the dominant mechanism triggering
                            non-severe cells in Florida during the warm season [22]. Meanwhile, thunderstorms
                            in Washington, D.C., often develop along northwesterly synoptic boundaries [23]. The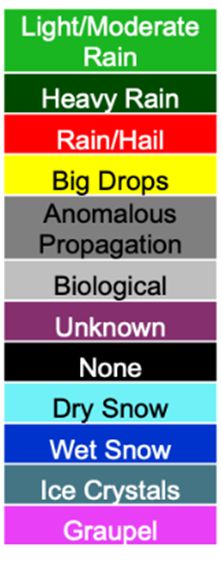
Atmosphere 2022, 13, x FOR PEER REVIEW                                                                                                          3 of 1

                                synoptic boundaries [23]. The Washington, D.C. area also has higher aerosol concentra
  Atmosphere 2022, 13, 1111                                                                              3 of 12
                                tions than Florida (due to more pollution), which could impact charging mechanisms  in
                                electrified storms as suggested by [18].

                                Washington,
                                2. Data andD.C.   area also has higher aerosol concentrations than Florida (due to more
                                              Methods
                                pollution), which could impact charging mechanisms in electrified storms as suggested
                                2.1.[18].
                                by    Lightning Data
                                         The Washington, D.C., Lightning Mapping Array (DCLMA) was developed by th
                                2. Data and Methods
                                National Aeronautics and Space Administration, the National Oceanic and Atmospheri
                                2.1. Lightning Data
                                 Administration, and New Mexico Institute of Mining and Technology [24]. It is made up
                                 of 10The   Washington, D.C., Lightning Mapping 2Array (DCLMA) was developed by the
                                         lightning    detectors covering ~7000 km that detect very high frequency (VHF) radi
                                National Aeronautics and Space Administration, the National Oceanic and Atmospheric
                                 ation emissions produced when in-cloud (IC) or cloud-to-ground (CG) lightning change
                                Administration, and New Mexico Institute of Mining and Technology [24]. It is made up of
                                 direction
                                10  lightningor   speed and
                                                detectors        maps
                                                           covering      the km
                                                                      ~7000   data   on detect
                                                                                 2 that  a 3D-plane    using
                                                                                               very high       a Global
                                                                                                          frequency       Positioning
                                                                                                                      (VHF)  radiation System
                                 [24,25]. The
                                emissions         total lightning
                                              produced                (IC and
                                                          when in-cloud    (IC)CG)    data gathered(CG)
                                                                                 or cloud-to-ground     allows   for intervals
                                                                                                             lightning  changesof   1 min to b
                                                                                                                                 direc-
                                tion or speed and maps the data on a 3D-plane using a Global Positioning System [24,25].were de
                                 displayed      on  a user   interface.  Days   with   lightning   in the  Washington,     D.C.  area
                                 termined
                                The            by examining
                                      total lightning            archives
                                                        (IC and CG)          of DCLMA
                                                                       data gathered       data.
                                                                                       allows  for intervals of 1 min to be displayed
                                on a user
                                        Theinterface.
                                              WarningDays      with lightning
                                                           Decision    SupportinSystem–Integrated
                                                                                    the Washington, D.C.Information
                                                                                                            area were determined
                                                                                                                          (WDSS−II)  by[26] wa
                                examining      archives  of DCLMA      data.
                                 used to overlay radar data from Sterling, VA, (KLWX) and Dover, DE, (KDOX) and light
                                 ningThedataWarning    Decision
                                                from the     DCLMA Support  System–Integrated
                                                                         at different              Information
                                                                                         temperature    levels. (WDSS    −II) [26] was
                                                                                                                 This software     also utilize
                                used to overlay radar data from Sterling, VA, (KLWX) and Dover, DE, (KDOX) and light-
                                 hydrometeor classification to identify the presence of graupel at temperature levels crucia
                                ning data from the DCLMA at different temperature levels. This software also utilizes
                                 to storm electrification.
                                hydrometeor                      This
                                                 classification to      information
                                                                    identify            wasofused
                                                                              the presence           to develop
                                                                                               graupel             an appropriate
                                                                                                        at temperature   levels crucialthreshold
                                 forstorm
                                to    lightning    cessation
                                            electrification.    guidance.
                                                              This information was used to develop an appropriate threshold for
                                lightning cessation guidance.
                                2.2. Radar and Environmental Data
                                2.2. Radar and Environmental Data
                                         Archived radar images from the University Corporation for Atmospheric Research
                                 wereArchived
                                       used toradar   images from the University Corporation for Atmospheric Research
                                                determine    dates where isolated cells (white circles; Figure 1) were presen
                                were used to determine dates where isolated cells (white circles; Figure 1) were present
                                 on days with lightning. Using similar criteria as [5], we defined isolation as a cell being
                                on days with lightning. Using similar criteria as [5], we defined isolation as a cell being
                                 separated
                                separated byby  composite
                                             composite  ZH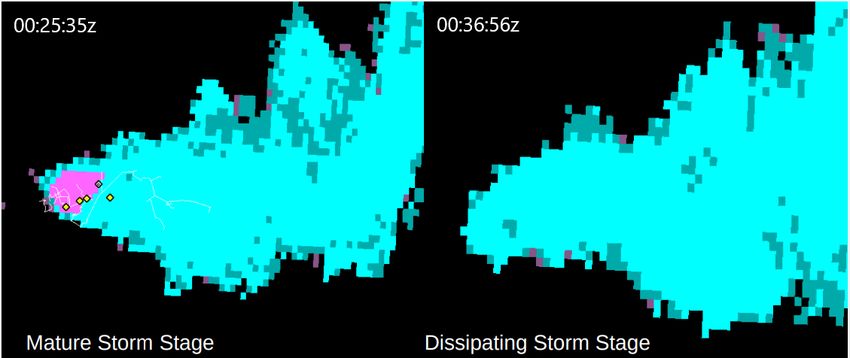
Atmosphere 2022, 13, x FOR PEER REVIEW 4 of 1
Atmosphere 2022, 13, 1111 4 of 12
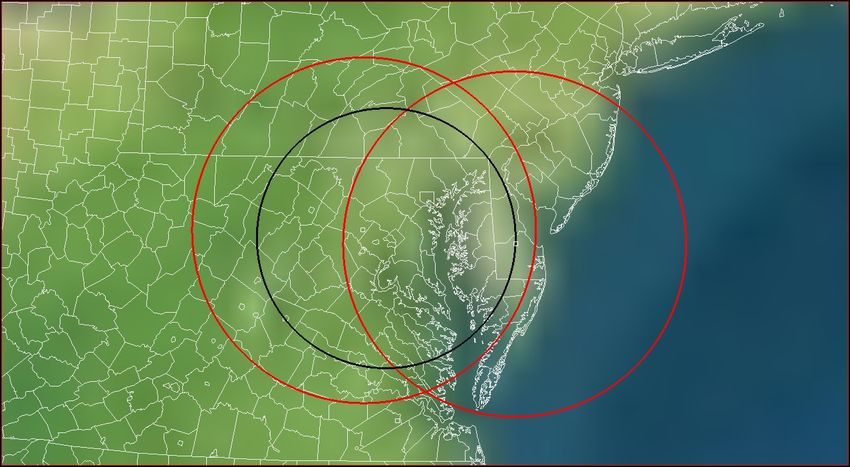
km was created around the DCLMA (Figure 2) as the area of focus since lightning detec
150 km was created around the DCLMA (Figure 2) as the area of focus since lightning
tion efficiency
detection within
efficiency thisthis
within region is is
region greater
greaterthan
than90%
90%[27].
[27]. All
All storms alsooccurred
storms also occurred within
200 km of KLWX or KDOX radar sites as shown in Figure
within 200 km of KLWX or KDOX radar sites as shown in Figure 2. 2.
N
DCLMA
150 km
KLWX KDOX
Figure2.2.The
Figure Thered circles
red extend
circles 200 200
extend km from the KLWX
km from and KDOX
the KLWX radar sites.
and KDOX radarAllsites.
23 non-severe
All 23 non-sever
storms
stormswere
werewithin 150150
within kmkm (black circle)
(black of theofDCLMA
circle) center.center.
the DCLMA
The Rapid Refresh model (RAP) [28] data were used in this study and had to be
The Rapid Refresh model (RAP) [28] data were used in this study and had to be con
converted to the proper format using the NetCDF algorithm [26]. To finalize processing,
verted
the near to the environment
storm proper format using the
algorithm (nse)NetCDF
[26] was algorithm
run to obtain [26].
RAP Totemperature
finalize processing,
level th
near storm environment
◦ ◦ algorithm
◦ ◦ (nse) [26] was
◦ run to obtain
altitudes (i.e., 0 C, −5 C, −10 C, −15 C, and −20 C) at the time of each convective cell. RAP temperature leve
altitudesthe
Running (i.e., 0 °C, −5
merging °C, −10(w2merger)
algorithm °C, −15 °C,[26] andthen−20allowed
°C) at theWDSStime−IIoftoeach
blendconvective
radar cell
Running
data (~1 km the mergingand
horizontal algorithm (w2merger)
vertical grid spacing) [26] thenKLWX
between allowed andWDSS
KDOX−II to blend
using an rada
exponential
data (~1 km weighting
horizontal function based ongrid
and vertical distance to each
spacing) radar. The
between merging
KLWX andalgorithm
KDOX using an
also
exponential weighting function based on distance to each radar. Theismerging
decreased the time interval from 5 min to 1 min as each elevation scan processed.algorithm
The WDSS−II software does not wait for full radar scans to be completed. The merging
also decreased the time interval from 5 min to 1 min as each elevation scan is processed
algorithm was run alongside the simulator algorithm (w2simulator) [26] to allow chrono-
The WDSS−II software does not wait for full radar scans to be completed. The merging
logical files to be processed and viewed within WDSS−II. We also ran the hydrometeor
algorithm was
classification run alongside
algorithm the simulator
(HCA; w2dualpol) algorithm
[26], which is based(w2simulator)
on the algorithm [26]developed
to allow chrono
by J. Krause at the National Severe Storms Laboratory and described by [29–31]. The hydrometeo
logical files to be processed and viewed within WDSS − II. We also ran the algo-
classification
rithm algorithm
uses polarimetric base(HCA; w2dualpol)
products, reflectivity[26], which isasbased
information, well ason the algorithm
texture products devel
oped the
along by J.radar
Krausebeam.at the
TheNational
HCA used Severe
here Storms
identifies Laboratory
hydrometeor andtypes
described by [29–31].
and assigns a Th
particle identification value to the dominant or majority quantity within
algorithm uses polarimetric base products, reflectivity information, as well as textur each radar range
gate of a volume
products alongscanthe [32].
radarAsbeam.
with the other
The HCAradar parameters,
used WDSS−IIhydrometeor
here identifies interpolates thetypes and
HCA categories to ~1 km horizontal and vertical grid spacing. The HCA category at a
assigns a particle identification value to the dominant or majority quantity within each
location is the particle identification value from the closest radar (not a weighting function
radar range gate of a volume scan [32]. As with the other radar parameters, WDSS−II in
based on distance to each radar). This product was used to determine the presence of
terpolates
graupel in thethemixed
HCAphase categories
region oftoa~1 km (Figure
storm horizontal 3). and vertical grid spacing. The HCA
category at a location is the particle identification value from the closest radar (not
2.3. Lightningfunction
weighting Flash Algorithm
based on distance to each radar). This product was used to determin
the presence of graupel
Raw lightning in the
data were mixed from
retrieved phasethe
region
DCLMAof a at
storm (Figure
1 min 3). using the
intervals
lightning ingest algorithm. This algorithm gathers data and creates an index for process-
ing (w2lmaflash) [26]. Lightning flash density products were created using the lightning
algorithm (w2ltg) [26] and these data were assembled to view 3D lightning channels and
flash initiation points for isolated cells. We used the default flash algorithm thresholds,
where each VHF source had to be within 300 ms and 5 km from one another [26]. Fur-
thermore, flashes also had to have a minimum of three VHF sources to eliminate potential
noise [33,34]. The lightning products were then added to the WDSS−II software and
overlaid on radar data at 1 min intervals (Figure 4).x FOR PEER REVIEW 5 of 12
Atmosphere 2022, 13, 1111 5 of 12
Figure 3. The HCA displays the most likely hydrometeor type based on a combination of p
ric radar products. These two panels show the dissipation of graupel at −10 °C in a no
isolated storm on 22 June 2016. The yellow diamonds represent the initiation location
detected by the DCLMA within 1 min of the radar time stamp.
2.3. Lightning Flash Algorithm
Raw lightning data were retrieved from the DCLMA at 1 min intervals u
lightning ingest algorithm. This algorithm gathers data and creates an index
cessing (w2lmaflash) [26]. Lightning flash density products were created using t
ning algorithm (w2ltg) [26] and these data were assembled to view 3D lightning c
and flash initiation points for isolated cells. We used the default flash algorithm
olds, where
Figure 3. The HCA displays each VHF source had typetobased
be within 300 ms and 5 km from one anot
Figure 3.the
Themost likely
HCA displays hydrometeor
the most likely hydrometeor on abased
type combination of polarimet-
on a combination of polarimetric
Furthermore,
ric radar products. These two panels flashes
show also
the had to
dissipation have
of a minimum
graupel at −10 of
°C ◦three
in a VHF sources
non-severe,
radar products. These two panels show the dissipation of graupel at −10 C in a non-severe, isolatedto elimi
tential
isolated storm on 22storm
Juneon noise
2016. The
22 June [33,34].
yellow
2016. The lightning
diamonds
The yellow diamonds products
represent
representthe were then
initiation
the initiation added
location
location to the
detected by−II softw
WDSS
of flashes
of flashes
detected by the DCLMA overlaid
the withinon
DCLMA radar
1 min
within 1of
min data
the theat
of radar 1time
radarmin intervals
timestamp.
stamp. (Figure 4).
2.3. Lightning Flash Algorithm
Raw lightning data were retrieved from the DCLMA at 1 min intervals using the
lightning ingest algorithm. This algorithm gathers data and creates an index for pro-
cessing (w2lmaflash) [26]. Lightning flash density products were created using the light-
ning algorithm (w2ltg) [26] and these data were assembled to view 3D lightning channels
and flash initiation points for isolated cells. We used the default flash algorithm thresh-
olds, where each VHF source had to be within 300 ms and 5 km from one another [26].
Furthermore, flashes also had to have a minimum of three VHF sources to eliminate po-
tential noise [33,34]. The lightning products were then added to the WDSS−II software and
overlaid on radar data at 1 min intervals (Figure 4).
na < -33 -10 10 13 18 28 33 38 43 48 53 63 68 73 77 93 + dBZ
Figure 4. Side view of 3D lightning channels overlaid on composite reflectivity in WDSS−II at 2153
Figure 4. Side view of 3D lightning channels overlaid on composite reflectivity in WDSS−
UTC 21 June 2016.
UTC 21 June 2016.
2.4. Simulating Case Studies
2.4.Each
Simulating Case
case study hadStudies
to remain isolated through the end of its lifetime. A total of 23 non-
severe, isolated cells were analyzed and lightning advisories were simulated for each event.
Each case study had to remain isolated through the end of its lifetime. A to
We defined a non-severe storm as one without a recorded severe weather report [35]. The
non-severe,
simulated isolated
lightning cells
advisory werewhen
begins analyzed
the firstand lightning
lightning flash isadvisories
detected. Thewere simulated
advisory
event.
ends afterWe defined
waiting a non-severe
a certain storm
amount of time as one
without without
meeting a recorded
a radar-based severe
threshold. The weathe
five thresholds used were:
[35]. The simulated lightning advisory begins when the first lightning flash is d
H ≥ 40 dBZ
1.TheZadvisory ends after waiting a certain amount of time without meeting a rad
2. ZH ≥ 35 dBZ
threshold. The five thresholds used were:
3. 10 presence
na < -33 -10 13 18 28 of
33 graupel
38 43 48 53 63 68 73 77 93 + dBZ
4.1. presence
ZH ≥ 40ofdBZ
graupel with ZH ≥ 40 dBZ
Figure 4. Side view of5. 3D presence
lightningofchannels overlaid
graupel with ZH ≥on composite reflectivity in WDSS−II at 2153
35 dBZ
UTC 21 June 2016.
2.4. Simulating Case Studies
Each case study had to remain isolated through the end of its lifetime. A total of 23
non-severe, isolated cells were analyzed and lightning advisories were simulated for eachAtmosphere 2022, 13, 1111 6 of 12
These thresholds focus on storm intensity (ZH ) and graupel presence, which are both
critical to noninductive charging theory. The five thresholds above were tested at five
different temperature levels (0 ◦ C, −5 ◦ C, −10 ◦ C, −15 ◦ C, and −20 ◦ C) and three different
wait times (5, 10, and 15 min) for a combination of 75 total algorithms. For each algorithm,
once the threshold was no longer met, a wait time was started. If lightning cessation
occurred before the wait time ended, it was considered a hit since the lightning advisory
would have been lifted after lightning activity ended. If lightning activity was ongoing
when the lightning advisory ended, it was considered a false alarm as the advisory would
have been lifted before lightning cessation. False alarms are especially dangerous since
they convey that it is safe to move outside before the last flash of the storm has occurred.
If a radar-derived threshold was never met during the storm’s lifetime, it was considered
a missed event, meaning the advisory was never ended. We did not include null events
since we only considered electrified storms, in which cessation must eventually occur. The
2 × 2 contingency table (Table 1) shows how each event was classified. Skill scores were
calculated to determine the effectiveness of each algorithm as discussed below in Section 3.
Table 1. A 2 × 2 contingency table used to calculate skill scores for each cessation algorithm.
Lightning Ended Lightning Ongoing
Advisory Ended Hit False Alarm
Advisory Ongoing Miss Null
3. Results and Conclusions
To select the best algorithm to use as a public lightning advisory, several statistics must
be considered to eliminate ones that are unreliable, unsafe, have unreasonable advisory
cancellation times, or lack time savings compared to the 30–30 rule. Performance metrics
are based on applying the algorithms to the sample of 23 storms. Tables 2 and 3 show
Probability of Detection (POD) and False Alarm Ratio (FAR), respectively. These skill
scores were used to determine how well our cessation algorithms performed. Algorithms
with POD < 1.0 had at least one missed advisory cancellation in our 23-storm dataset. A
missed event means the lightning advisory never ended (i.e., it remained active through
storm dissipation). We considered algorithms with missed events unreliable due to their
inability to end advisories in a timely manner. Of the 75 algorithms tested, only 6 (8%) had
a missed event (Table 2; POD < 1.0). Algorithms with false alarms (FAR > 0.0) are especially
dangerous since they can be fatal. This is because a false alarm represents an algorithm
that ends the advisory prematurely (i.e., before the last flash has occurred). This makes
them unsafe for operational utility. Table 3 shows there were 28 (37%) algorithms with a
false alarm (FAR > 0.0). These results demonstrate that cessation algorithms in Washington,
D.C., struggle more with false alarms than missed events. This is consistent with [5] who
also had more algorithms with a false alarm (9 out of 15; 60%) than a missed event (6 out of
15; 40%). Table 4 shows a performance metric that combines POD and FAR called Critical
Success Index (CSI). Values in boldface represent CSI = 1.0, which indicates a very effective
cessation algorithm (POD = 1.0, FAR = 0.0). The remaining algorithms in gray had CSI < 1.0
(28 out of 75; 37%), which means the algorithm had at least one false alarm and/or miss.
These cessation algorithms are not considered further in this study and have been removed
from Table 5.
Table 5 considers the timing of lightning advisory cancellations for the safest cessation
algorithms from Tables 2–4. We seek cessation algorithms that balance safety and time
savings. Table 5 shows the minimum, maximum, and average cancellation times for all
23 non-severe storms. Three algorithms stand above the rest (boldface; Table 5) based
on the small variability of their advisory cancellation times. All three algorithms had a
minimum cancellation time of 10 min after the last flash and maximum cancellation time
of 45 min after the last flash. The rest of the algorithms shown (gray; Table 5) ended at
least one lightning advisory less than 10 min after the last flash or greater than 45 minAtmosphere 2022, 13, 1111 7 of 12
after the last flash. If an advisory ends longer than 45 min after the final flash, it no longer
provides time savings compared to the 30–30 rule. This resulted in 28 cessation algorithms
being dismissed. Furthermore, it is important to note that if an advisory is ended less than
10 min from the previous lightning flash, the public may not feel safe to resume outdoor
activities after having just observed a nearby flash. As a result, 16 additional cessation
algorithms were disregarded due to this recent memory bias. One of the eliminated
algorithms is the combined graupel and ZH ≥ 35 dBZ at −10 ◦ C using a 10 min wait time
as recommended in [5]. It should be noted that [5] did not eliminate algorithms based
on a “too close for comfort” advisory cancellation time as done here. Regardless, this
Florida-recommended cessation algorithm performed well in Washington, D.C., with a
CSI = 1.0. However, the average advisory cancellation time for this cessation algorithm
increased from 17.9 min (Florida) to 23.0 min (Washington, D.C.). The maximum advisory
cancellation time increased even more from 31.0 min (Florida) to 44.0 min (Washington,
D.C.). This trend of delayed advisory cancellations in Washington, D.C., (compared to
Florida) is observed in many other cessation algorithms as discussed below.
Table 2. Probability of Detection defined by the total number of hits divided by the total number of
hits and misses: POD = total hits/(total hits + total misses).
Temp Graupel + Graupel +
Wait Time dBZ ≥ 40 dBZ ≥ 35 Graupel
Level (o C) dBZ ≥ 40 dBZ ≥ 35
0 5 min 1.00 1.00 1.00 1.00 1.00
10 min 1.00 1.00 1.00 1.00 1.00
15 min 1.00 1.00 1.00 1.00 1.00
−5 5 min 1.00 1.00 1.00 1.00 1.00
10 min 1.00 1.00 1.00 1.00 1.00
15 min 1.00 1.00 1.00 1.00 1.00
−10 5 min 1.00 1.00 1.00 1.00 1.00
10 min 1.00 1.00 1.00 1.00 1.00
15 min 1.00 1.00 1.00 1.00 1.00
−15 5 min 0.94 1.00 1.00 1.00 1.00
10 min 0.95 1.00 1.00 1.00 1.00
15 min 0.95 1.00 1.00 1.00 1.00
−20 5 min 0.86 1.00 1.00 1.00 1.00
10 min 0.89 1.00 1.00 1.00 1.00
15 min 0.90 1.00 1.00 1.00 1.00
The three remaining cessation algorithms (Table 5; boldface) met all previous criteria
during the process of elimination to be safe, reliable, time efficient, and have reasonable
minimum and maximum advisory cancellation times. The three best-performing algorithms
we tested were: (1) wait 15 min after ZH values drop below 40 dBZ at −5 ◦ C, (2) wait 15 min
after ZH values drop below 35 dBZ at −10 ◦ C, and (3) wait 15 min after graupel dissipation
at −15 ◦ C. All three algorithms had a 100% success rate with no false alarms or misses.
This means they would have kept the public safe by ending the advisory after lightning
cessation for all 23 storms in this study. These three cessation algorithms also would have
ended the lightning advisory between 10 and 45 min after cessation in all 23 cases with
an average wait time of 24 min after the last flash. Thus, these algorithms improve upon
the 30–30 rule by saving an average of 6 min per storm. Table 5 shows lightning advisory
end times with the following ranges: (1) 11–45 min, (2) 10–44 min, and (3) 10–38 min after
the last flash. This makes (3) graupel dissipation at −15 ◦ C slightly better for time savings,
although the three algorithms are comparable. In fact, all three algorithms ended lightningAtmosphere 2022, 13, 1111 8 of 12
advisories earlier than the 30–30 rule for 17 of the 23 storms, making them ~74% more
effective at saving time.
Table 3. False Alarm Ratio is defined by the total number of false alarms divided by the total number
of hits and false alarms: FAR = total false alarms/(total hits + total false alarms).
Temp Graupel + Graupel +
Wait Time dBZ ≥ 40 dBZ ≥ 35 Graupel
Level (o C) dBZ ≥ 40 dBZ ≥ 35
0 5 min 0.04 0.00 0.00 0.00 0.00
10 min 0.00 0.00 0.00 0.00 0.00
15 min 0.00 0.00 0.00 0.00 0.00
−5 5 min 0.00 0.00 0.00 0.00 0.00
10 min 0.00 0.00 0.00 0.00 0.00
15 min 0.00 0.00 0.00 0.00 0.00
−10 5 min 0.13 0.04 0.04 0.04 0.04
10 min 0.13 0.00 0.00 0.00 0.00
15 min 0.04 0.00 0.00 0.00 0.00
−15 5 min 0.23 0.04 0.04 0.04 0.04
10 min 0.09 0.04 0.00 0.00 0.00
15 min 0.05 0.00 0.00 0.00 0.00
−20 5 min 0.43 0.13 0.09 0.09 0.09
10 min 0.19 0.04 0.09 0.04 0.04
15 min 0.10 0.00 0.04 0.00 0.00
Table 4. The Critical Success Index is defined by the total number of hits divided by the total number
of hits, false alarms, and misses: CSI = total hits/(total hits + total false alarms + total misses). Values
in boldface represent a CSI of 1.00, which indicates algorithms with a 100% success rate of hits. The
remaining values in gray represent algorithms with a CSI < 1.00. This means they had at least one
false alarm and/or miss for the 23 storms examined.
Temp Graupel + Graupel +
Wait Time dBZ ≥ 40 dBZ ≥ 35 Graupel
Level (o C) dBZ ≥ 40 dBZ ≥ 35
0 5 min 0.96 1.00 1.00 1.00 1.00
10 min 1.00 1.00 1.00 1.00 1.00
15 min 1.00 1.00 1.00 1.00 1.00
−5 5 min 1.00 1.00 1.00 1.00 1.00
10 min 1.00 1.00 1.00 1.00 1.00
15 min 1.00 1.00 1.00 1.00 1.00
−10 5 min 0.87 0.96 0.96 0.96 0.96
10 min 0.87 1.00 1.00 1.00 1.00
15 min 0.96 1.00 1.00 1.00 1.00
−15 5 min 0.74 0.96 0.96 0.96 0.96
10 min 0.87 0.96 1.00 1.00 1.00
15 min 0.91 1.00 1.00 1.00 1.00
−20 5 min 0.52 0.87 0.91 0.91 0.91
10 min 0.74 0.96 0.91 0.96 0.96
15 min 0.83 1.00 0.96 1.00 1.00Atmosphere 2022, 13, 1111 9 of 12
Table 5. This table shows the range and average lightning advisory cancellation time (min) for each
cessation algorithm. The format is as follows: minimum-maximum (average). Advisory cancellation
times are based on the time of the last flash (t = 0). The values in boldface represent cessation
algorithms with the best range of cancellation times (10–45 min after the lash flash). Values in gray
represent algorithms with cancellation times that fell outside of this range. Cancellation times were
not calculated for cessation algorithms with a CSI < 1.00 (missing values).
Temp Graupel + Graupel +
Wait Time dBZ ≥ 40 dBZ ≥ 35 Graupel
Level (o C) dBZ ≥ 40 dBZ ≥ 35
0 5 min 4–46 (21) 4–51 (25) 4–51 (25) 4–51 (25)
10 min 5–47 (21) 9–82 (29) 9–56 (30) 9–56 (30) 9–82 (33)
15 min 10–52 (26) 14–87 (34) 14–61 (35) 14–61 (35) 14–87 (38)
−5 5 min 1–35 (14) 4–44 (18) 4–39 (19) 4–39 (19) 4–44 (20)
10 min 6–40 (19) 9–82 (25) 9–44 (24) 9–44 (24) 9–82 (27)
15 min 11–45 (24) 14–87 (30) 14–49 (29) 14–49 (29) 14–87 (32)
−10 5 min
10 min 5–39 (19) 5–44 (23) 5–44 (23) 5–44 (23)
15 min 10–44 (24) 10–49 (28) 10–49 (30) 10–49 (28)
−15 5 min
10 min 5–33 (19) 5–33 (19) 5–41 (20)
15 min 5–46 (23) 10–38 (24) 10–83 (27) 10–46 (25)
−20 5 min
10 min
15 min 4–83 (20) 5–37 (20) 5–83 (23)
The least effective algorithms proved to be both unsafe and time inefficient (removed
or gray; Table 5). In most cases, these algorithms had at least one false alarm where the
advisory was ended prior to lightning cessation. The 5 min wait time proved to be the least
effective, especially at −10 ◦ C, −15 ◦ C, and −20 ◦ C for all radar thresholds. Results from
Table 4 show that 16 out of 28 (57%) algorithms with CSI < 1.0 utilized a 5 min wait time.
This short wait time provides little confidence to forecasters since the storm could just be
weakening temporarily as lightning activity continues. The 40-dBZ reflectivity threshold
also is one of the least effective algorithms due to false alarms and misses. That is, the
40-dBZ cessation algorithms are too lenient and accounted for 10 out of 28 (36%) algorithms
with CSI < 1.0. This is more than any other radar parameter. There are two reasons for
this: (1) A non-severe storm may never reach ZH ≥ 40 dBZ at a given temperature level,
thereby producing a missed event or (2) Since the 40-dBZ echo descends in a storm before
the 35-dBZ echo, there is a greater likelihood that this threshold will prematurely end
an advisory, thereby producing a false alarm. Many other algorithms proved effective at
ending lightning advisories with no false alarms or misses. However, they are not within
the 10–45 min range or have an average wait time longer than 30 min (Table 5).
Overall, the performance metrics for cessation algorithms in this study were compa-
rable to those tested in Florida [5]. This reinforces the utility of a wait time approach for
lightning cessation guidance across different geographic regions. However, our results
show that our best-performing cessation algorithms in Washington, D.C., end lightning
advisories later than those in Florida [5]. A similar trend was found in [18] in which their
lightning cessation model had a longer median lag-time for the Washington, D.C. area than
found with the [19] model in Florida. The delay in ending lightning advisories for Wash-
ington, D.C., may be due to this area having stronger storms. That is, sea breeze convection
in Florida tends to be on a smaller scale compared to large-scale synoptic boundaries that
often propagate toward the Washington, D.C. area [22,23]. Stronger updrafts mean thatAtmosphere 2022, 13, 1111 10 of 12
radar-based thresholds such as reflectivity and graupel presence are delayed in being met.
This ultimately prevents the lightning advisory from ending sooner.
To summarize, this study examined lightning cessation algorithms for non-severe, iso-
lated cells in the Washington, D.C. area. We tested combinations of three radar parameters
(ZH , graupel, graupel and ZH ) at five different temperature levels (0 ◦ C, −5 ◦ C, −10 ◦ C,
−15 ◦ C, and −20 ◦ C) using three different wait times (5, 10, and 15 min). This produced
75 cessation algorithms to test on 23 storms. Results suggest the cessation algorithms that
best balance safety and time savings are: (1) wait 15 min after ZH values drop below 40 dBZ
at −5 ◦ C, (2) wait 15 min after ZH values drop below 35 dBZ at −10 ◦ C, and (3) wait
15 min after graupel dissipation at −15 ◦ C. These three cessation algorithms were the safest
of those tested based on POD, FAR, and CSI skill scores. That is, they safely ended the
advisory for all 23 storms after the last flash. These three algorithms also were time efficient,
ending advisories for 17 of the 23 storms earlier than the 30–30 rule. Their average advisory
cancellation time of 24 min after the last flash saved 6 min per storm compared to the
30–30 rule. However, further study is needed before recommending these three cessation
algorithms for operational utility. They performed well on the 23 storms in this study, but a
much larger sample size is required to increase confidence in their performance on future
storms. Furthermore, our best-performing cessation algorithms are probably less effective
for other types of convective cells (i.e., multicell, quasi-linear storms, severe storms) and
during the cool season where isotherm heights crucial to storm electrification shift closer
to the surface. This study showed that thresholds and wait times of cessation algorithms
that worked well in Florida performed differently for storms in the Washington, D.C. area.
Simulated lightning advisories also had delayed cancellations in Washington, D.C. Thus,
cessation guidance from this study will likely need to be adjusted for other geographic
regions. Examining a composite index was beyond the scope of this study, but previous
cessation studies [18,19] using a bootstrap model show promising results. Therefore, we
encourage future cessation studies to develop guidance using multiple radar thresholds
and isotherm levels.
Author Contributions: Analysis and writing: J.J.D.; project development and administration: A.D.P.;
review and editing: A.D.P. All authors have read and agreed to the published version of the manuscript.
Funding: There was no external funding source. We would like to thank Northern Vermont
University-Lyndon for providing internal startup funds for this research.
Institutional Review Board Statement: Not applicable.
Informed Consent Statement: Not applicable.
Data Availability Statement: Lightning data from the Washington, D.C., Lightning Mapping Array
can be obtained at https://lightning.nsstc.nasa.gov/lma/dclma/datacal.pl?class=pp&y=2018 ac-
cessed on 15 November 2021. NOAA Next Generation Radar Level II radar data can be downloaded
from https://www.ncdc.noaa.gov/nexradinv accessed on 15 November 2021. The Warning Decision
Support System–Integrated Information software can be downloaded after submitting a request
at http://wdssii.org/download.shtml accessed on 15 November 2021. Storm data with detailed
information for each convective cell (e.g., time, latitude, longitude) are available upon request.
Conflicts of Interest: The first author declares no conflict of interest. The second author serves as
co-editor for this journal.
References
1. National Oceanic and Atmospheric Administration. Lightning. NOAA. 2014. Available online: https://www.weather.gov/
media/owlie/lightning3_050714.pdf (accessed on 15 November 2021).
2. Steiner, M.; Deierling, W.; Ikeda, K.; Bass, R.G. Ground delays from lightning ramp closures and decision uncertainties. Air Traffic
Control Quart. 2014, 22, 223–249. [CrossRef]
3. Holle, R.L.; Watson, A.I.; Lopez, R.E.; Howard, K.W.; Ortiz, R.; Li, L. Meteorological Studies to Improve Short Range. Forecasting of
Lightning/Thunderstorms within the Kennedy Space Center Area Final Report; National Severe Storms Laboratory: Boulder, CO, USA,
1992; 91p, Available from R. Holle, National Severe Storms Laboratory, 1313 Halley Circle, Norman, OK 73069.Atmosphere 2022, 13, 1111 11 of 12
4. Holle, R.L.; Lopez, R.E.; Zimmermann, C. Updated recommendations for lightning safety—1998. Bull. Am. Meteorol. Soc. 1999,
80, 2035–2041. [CrossRef]
5. Preston, A.D.; Fuelberg, H.E. Improving lightning cessation guidance using polarimetric radar data. Weather. Forecast. 2015,
30, 308–328. [CrossRef]
6. Rakov, V.A.; Uman, M.A. Lightning: Physics and Effects; Cambridge University Press: Cambridge, MA, USA, 2003; 701p.
7. Rakov, V.A. Fundamentals of Lightning; Cambridge University Press: Cambridge, MA, USA, 2016; 271p.
8. Takahashi, T. Riming electrification as a charge generation mechanism in thunderstorms. J. Atmos. Sci. 1978, 35, 1536–1548.
[CrossRef]
9. Zhang, R.; Williams, E.R.; Rydock, J. Mixed-phase microphysics and cloud electrification. J. Atmos. Sci. 1991, 48, 2195–2203.
[CrossRef]
10. Jayaratne, E.R.; Saunders, C.P.R.; Hallett, J. Laboratory studies of the charging of soft-hail during ice crystal interactions. Q. J. R.
Meteorol. Soc. 1983, 109, 609–630. [CrossRef]
11. Williams, E.R. The tripole structure of thunderstorms. J. Geophys. Res. 1989, 94, 13151–13167. [CrossRef]
12. Rakov, V.A. The physics of lightning. Surv. Geophys. 2013, 34, 701–729. [CrossRef]
13. Davey, M.J.; Fuelberg, H.E. Using radar-derived parameters to forecast lightning cessation for nonisolated storms. J. Geophys. Res.
Atmos. 2017, 122, 3435–3456. [CrossRef]
14. Carey, L.D.; Petersen, W.A.; Deierling, W.K. Radar differential phase signatures of ice orientation for the prediction of lightning
initiation and cessation. In Proceedings of the 34th Conference on Radar Meteorology, Williamsburg, VA, USA, 5–9 October 2009.
15. Schultz, E.V.; Stano, G.T.; Carey, L.D.; Petersen, W.A. Radar applications for nowcasting lightning cessation. In Proceedings of the
Sixth Conference on the Meteorological Applications of Lightning Data, Austin, TX, USA, 5–7 January 2013; Available online:
https://ams.confex.com/ams/93Annual/webprogram/Paper220563.html (accessed on 15 November 2021).
16. Seroka, G.N.; Orville, R.E.; Schumacher, C. Radar nowcasting of total lightning over the Kennedy Space Center. Weather Forecast.
2012, 27, 189–204. [CrossRef]
17. Stano, G.T.; Fuelberg, H.E.; Roeder, W.P. Developing an empirical lightning cessation forecast guidance for the Kennedy Space
Center. J. Geophys. Res. 2010, 115, D09205. [CrossRef]
18. Holden, N. Forecasting Lightning Cessation Using Dual-Polarization Radar and Lightning Mapping Array Near Washington, D.C.
Master’s Thesis, Air Force Institute of Technology, Dayton, OH, USA, 2018. Available online: https://scholar.afit.edu/etd/1750
(accessed on 15 November 2021).
19. Patton, J.R.; Fuelberg, H.E. Using radar-derived parameters to develop probabilstic guidance for lightning cessation within
isolated convection near Cape Canaveral, Florida. Weather Forecast. 2019, 34, 559–575. [CrossRef]
20. Williams, E.R.; Mushtak, V.; Rosenfield, D.; Goodman, S.; Boccippio, D. Thermodynamic conditions favorable to superlative
thunderstorm updraft, mixed phase microphysics and lightning flash rate. Atmos. Res. 2005, 76, 288–306. [CrossRef]
21. Zhang, Y.; Guo, Y. Variability of atmospheric freezing-level height and its impact on the cryosphere in China. Ann. Glaciol. 2011,
52, 81–88. [CrossRef]
22. Simpson, J.E. Sea Breeze and Local Winds; Cambridge University Press: Cambridge, MA, USA, 1994.
23. Pokharel, B.; Wang, S.Y.S.; Meyer, J.; Gillies, R.; Lin, Y.H. Climate of the weakly-forced yet high-impact convective storms
throughout the Ohio River Valley and Mid-Atlantic United States. Clim. Dyn. 2019, 52, 5709–5721. [CrossRef]
24. Krehbiel, P.; Thomas, R.; Rison, W.; Hamlin, T.; Harlin, J.; Davis, M. GPS-based mapping systems reveals lightning inside storms.
Earth Space Sci. News 2000, 81, 21–25. [CrossRef]
25. Rison, W.; Thomas, R.J.; Krehbiel, P.R.; Hamlin, T.; Harlin, J. A GPS-based three-dimensional lightning mapping system: Initial
observations in central New Mexico. Geophys. Res. Lett. 1999, 26, 3573–3576. [CrossRef]
26. Lakshmanan, V.; Smith, T.; Hondl, K.; Stumpf, G.J. The Warning Decision Support System–Integrated Information (WDSS−II).
Weather Forecast. 2007, 22, 596–612. [CrossRef]
27. Chmielewski, V.C.; Bruning, E.C. Lightning Mapping Array flash detection performance with variable receiver thresholds.
J. Geophys. Res. Atmos. 2016, 121, 8600–8614. [CrossRef]
28. Benjamin, S.G.; Sahm, S. Rapid Refresh (RAP). 2012. Available online: http://rapidrefresh.noaa.gov (accessed on 15 November 2021).
29. Park, H.S.; Ryzhkov, A.V.; Zrnic, D.S.; Kim, K.-E. The hydrometeor classification algorithm for the polarimetric WSR-88D:
Description and application to an MCS. Weather Forecast. 2009, 24, 730–748. [CrossRef]
30. Ryzhkov, A.V.; Schuur, T.J.; Burgess, D.W.; Heinselman, P.L.; Griangrade, S.E.; Zrnic, D.S. The Joint Polarization Experiment:
Polarimetric rainfall measurements and hydrometeor classification. Bull. Am. Meteorol. Soc. 2005, 86, 809–824. [CrossRef]
31. Schuur, T.J.; Ryzhkov, A.; Heinselman, P.; Zrnic, D.; Burgess, D.; Scharfenberg, K. Observation and Classification of Echoes with the
Polarimetric WSR-88D Radar; National Severe Storms Laboratory Report; National Severe Storms Laboratory: Norman, OK, USA,
2003; 46p.
32. Grazioli, J.; Tuia, D.; Berne, A. Hydrometeor classification from polarimetric radar measurements: A clustering approach. Atmos.
Meas. Tech. 2015, 8, 149–170. [CrossRef]
33. MacGorman, D.R.; Rust, W.D.; Schuur, T.J.; Biggerstaff, M.I.; Straka, J.M.; Ziegler, C.L.; Mansell, E.R.; Bruning, E.C.;
Kuhlman, K.M.; Lund, N.R.; et al. TELEX: The Thunderstorm Electrification and Lightning Experiment. Bull. Am. Meteorol. Soc.
2008, 89, 997–1013. [CrossRef]Atmosphere 2022, 13, 1111 12 of 12
34. Rudlosky, S.D.; Fuelberg, H.E. Documenting Storm Severity in the Mid-Atlantic Region Using Lightning and Radar Information.
Mon. Weather Rev. 2013, 41, 3186–3202. [CrossRef]
35. Johnson, J.T.; MacKeen, P.L.; Witt, A.; Mitchell, E.D.; Stumpf, G.J.; Eilts, M.D.; Thomas, K.W. The Storm Cell Identification and
Tracking algorithm: An enhanced WSR-88D algorithm. Weather Forecast. 1998, 13, 263–276. [CrossRef]You can also read