LAUREL FLYING SENSOR TRAINING PART I: LAVAKA MONITORING TRAINING REPORT - HIVIEW
←
→
Page content transcription
If your browser does not render page correctly, please read the page content below
LAUREL Flying Sensor Training Part I:
                  Lavaka Monitoring

                              Training report

                  Antananarivo, 14-16 February 2018

                                                          Authors:
                                                        Jan van Til
                                                       Gijs Simons

                                                           Client:
                                                       World Bank

                                                Location training:
                      World Bank Office, Antananarivo, Madagascar
                                      Antananarivo lavaka test site

                                       Location flight operations:
                                      Antananarivo lavaka test site

                                                     FutureWater
                                                    Costerweg 1V
                                             6702 AA Wageningen
                                                 The Netherlands

                                                +31 (0)317 460050

                                              info@futurewater.nl

                                              www.futurewater.nl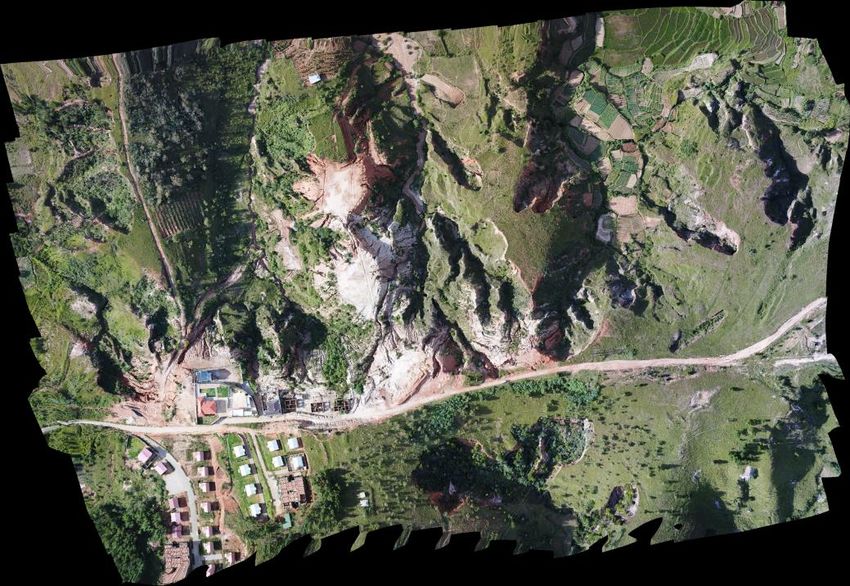
Table of contents

1     Introduction                                           3
1.1   Background and objectives                              3
1.2   Practical details                                      3
1.3   Location of lavaka test site                           5
2     Results                                                7
2.1   Single images                                          7
2.2   Processed images                                       8
3     Applications and benefits of processed images         13
4     Evaluation and recommendations                        15
Appendix I: Training program                                16
Appendix II: List of participants                           18

2
1 Introduction

1.1     Background and objectives

Flying Sensors (FSs) are bound to create a revolution in temporal and spatial remote sensing of
agriculture and ecophysiology at a close range. Within the PADAP program it is foreseen that
stakeholders will purchase FSs for information collection to support sustainable land management
activities. Based on this, it was decided that a demonstration of the use of Flying Sensors and
training on their use will be included in LAUREL activities.

The objective of the first training (Part I) was to offer an introduction on the use of Flying Sensors
(FSs) with the focus on applications for land degradation and sustainable land management. The
complete training course (Part I and II) consists of capacity building in the following areas:
   • FS piloting skills
   • Image processing skills
   • Detecting land degradation with FSs
   • Monitoring effects of sustainable land management interventions
   • Correlating FS outputs to other land degradation monitoring tools and mapping methods

1.2     Practical details

In the framework of the LAUREL program (supported by World Bank) a training on Flying Sensors
took place in Antananarivo from 14 to 16 February 2018. The training was conducted by Jan van
Til (FutureWater) with support of Tojo Rasolozaka (WWF aerial surveillance and drone specialist).
A group of 11 persons was trained. The participants were mostly all engineers and active in land
and water management in Madagascar (see list of participants in Appendix II). The training
focused especially on FS piloting skills and image processing skills.

Field visits were organized on 14 and 16 February during which RGB and NIR images of a lavaka
test area near Antananarivo were captured. The images were taken on an automated flight with
the Sensy-M Flying Sensor. Impressions of the field visit are provided in Figures 1 and 2.
Appendix I contains the full training program.

After the training was concluded, Jan van Til handed over one Sensy-M kit to Tojo Rasolozaka.
    • The Sensy-M kit comprises:
    • Mavic Pro quadcopter
    • Batteries (3x)
    • NIR camera
    • Tablet (Samsung Tab A 2016)

This material will remain at the disposal of the LAUREL project for usage in Part II of the training.

Two training manuals were prepared in French and shared with all participants (Figure 3):
   1. Manual Sensy-M
   2. Manual Image Processing

                                                                                                    3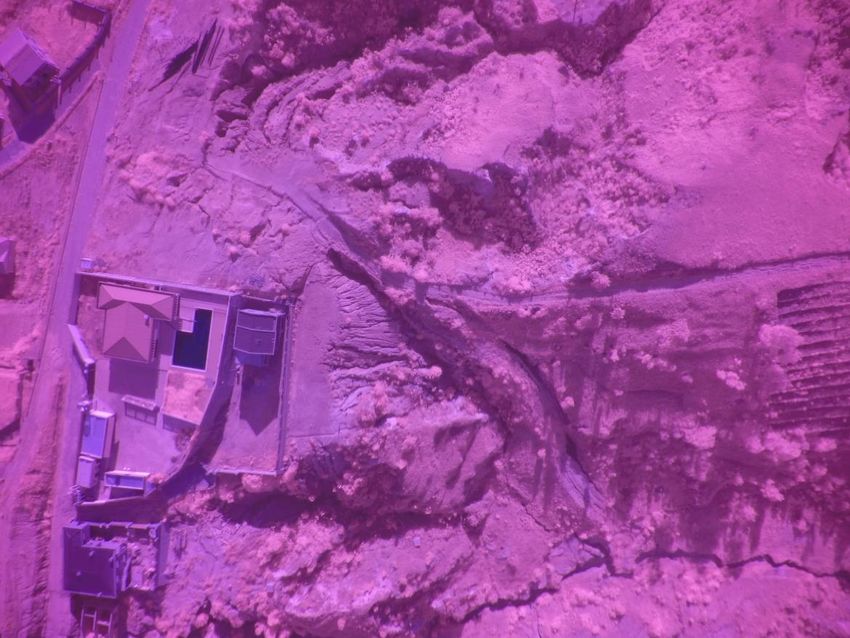
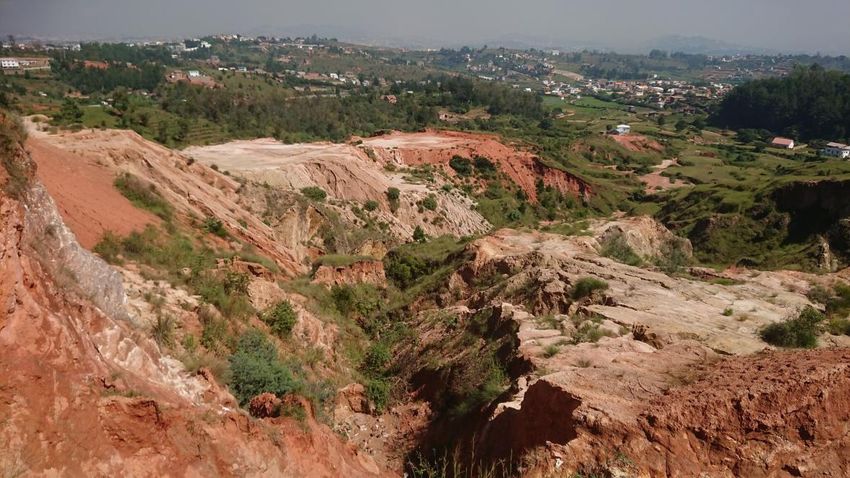
Figure 1. Training at the lavaka test site near Antananarivo

Figure 2. Lavaka test site near Antananarivo

4
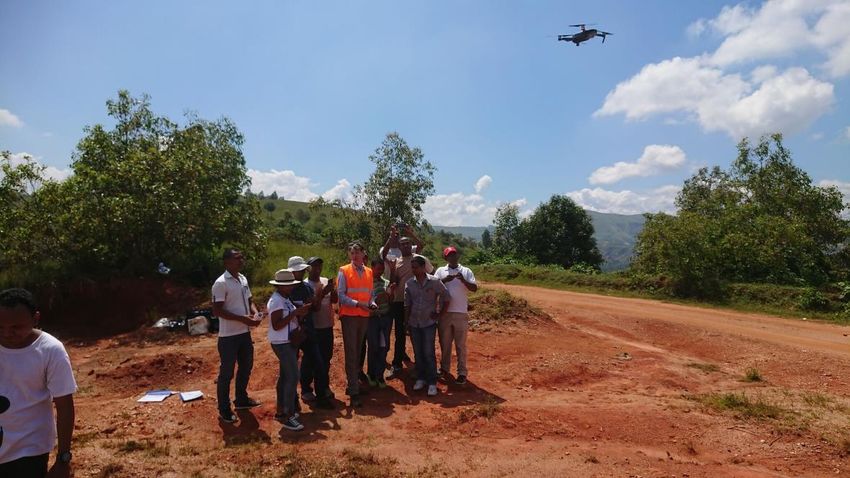
Figure 3. Manuals prepared for the training.
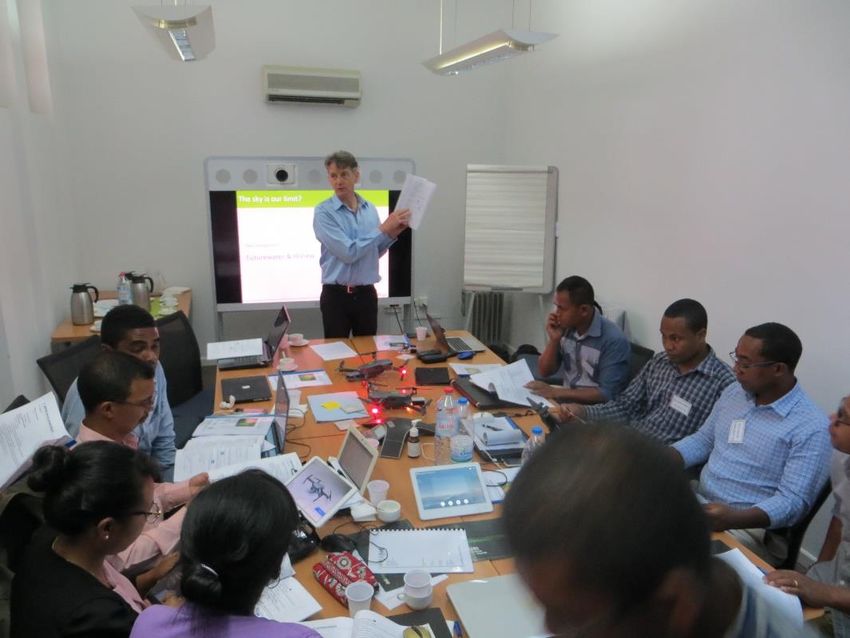
Figure 4. The training took place in the World Bank office
1.3 Location of lavaka test site
As recommended by WWF Madagascar, the field demonstration was organized at a location to
the south east of Antananarivo, where land degradation has resulted in the occurrence of a
lavaka.
5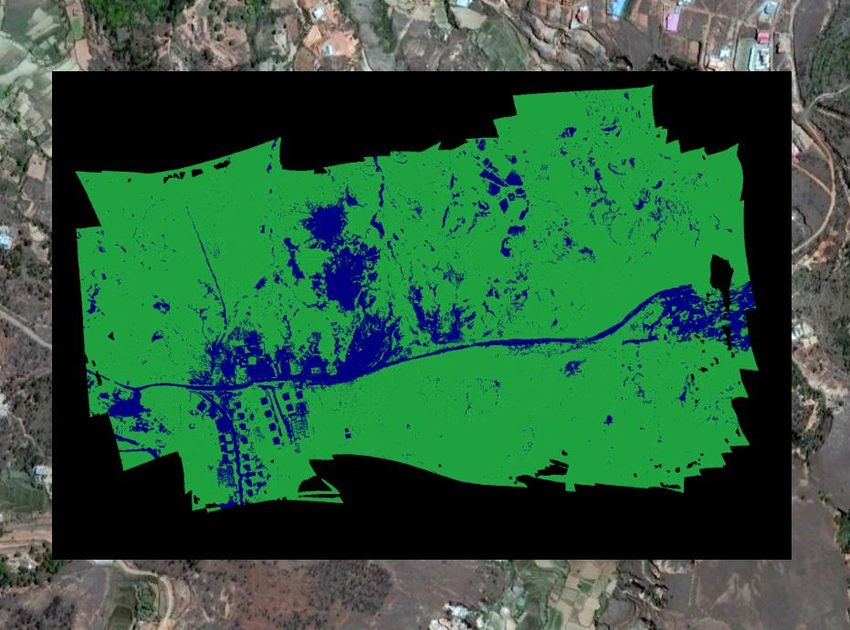
l

Figure 5. Location of the lavaka test site

Figure 6. Lavaka test site

6
2 Results

2.1     Single images
This paragraph demonstrates some of the images captured during the field visits.

Flight operations details
Flying Sensor: Sensy-M
Area: lavaka test site near Antananarivo (490x 290m)
Sensors: RGB & NIR cameras
Flight number: 20180214_F01
Flight date: 14 February 2018

Sensor details
At F01 (flight 1) both RGB (Red Blue Green) and NIR (Near InfraRed ) images were taken.
Number of RGB images: 118
Number of NIR images: 90
Resolution: 12 MP, 4000x3000. GSR: 3,5 cm

Figure 7. Single RGB image, lavaka test site

                                                                                          7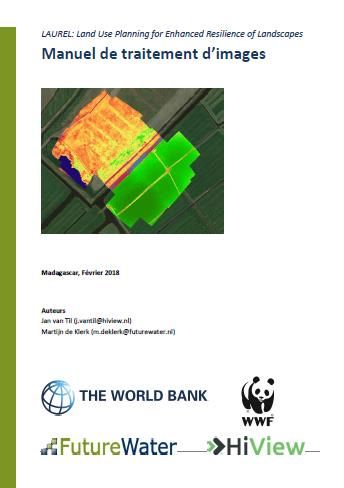
Figure 8. Single NIR image, lavaka test site
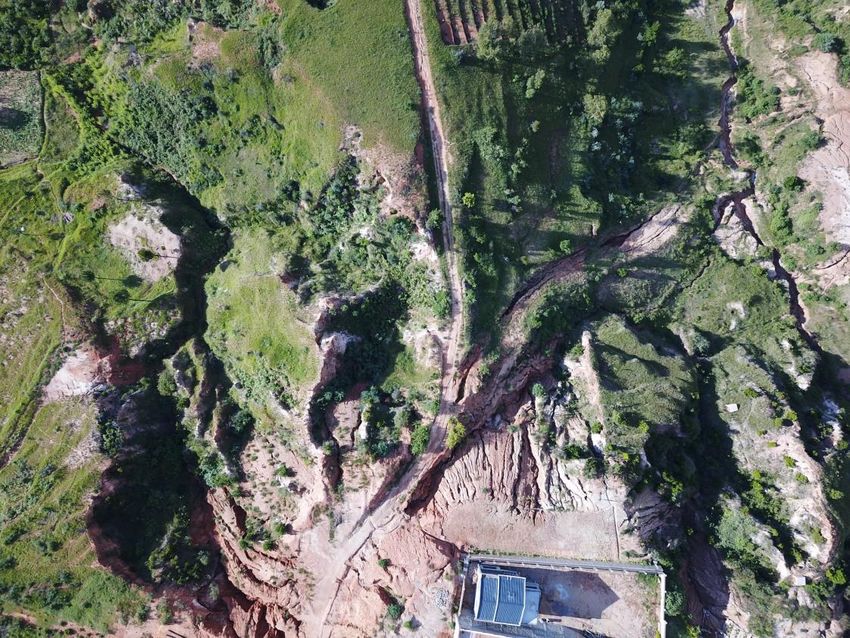
2.2 Processed images
The “raw” images can be processed into different derived products, which can subsequently be
applied for different purposes related to land degradation and sustainable land management.
Examples of processed images are given below.
1 Orthomosaic RGB, below referred to as Ortho RGB
2 Orthomosaic NIR, below referred to as Ortho NIR
3 Rough DEM/DSM, below referred to as DEM
4 3D model, below referred to as 3D Model
5 KMZ/KML, below referred to as KML
6 Normalized Difference Vegetation Index map, below referred to as NDVI map
7 Land cover classification map, below referred to as land cover map
8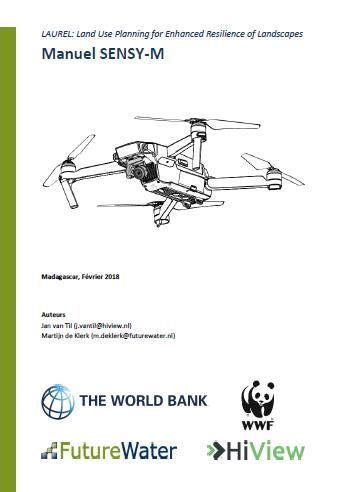
Figure 9. Ortho RGB, lavaka test site

Figure 10. Ortho NIR, lavaka test site
projected in Google Earth

                                         9
Figure 11. Rough DEM, lavaka test site projected in Google Earth Figure 12. 3D model, lavaka test site For an interactive high-resolution 3D model view of the lavaka, see online: https://sketchfab.com/models/daac1275b064475a9a5273b0e672e4a3 10
Figure 13. KMZ/KML, lavaka test site
projected in Google Earth

Figure 14. NDVI map, lavaka test site
projected in Google Earth

                                        11
Figure 15. Vegetation cover map, lavaka test site projected in Google Earth. Supervised classification based on NDVI image. Figure 16. Vegetation map (blue = bare, green = vegetation cover), projected in Google Earth. Supervised classification based on NIR image. 12
3 Applications and benefits of processed
                                               images

The previous chapter demonstrates a number of derived products from FS imagery, all having
very high resolution due to observation of the land surface from a relatively short distance. Each
processed mosaic, map or model has its own features and potential applications. Different
parameters can be determined, such as volume, vegetation conditions, soil conditions and land
cover type. Within the context of land and water management in Madagascar, relevant
applications include especially:
    • inspection of forestry (e.g. illicit deforestation)
    • inspection land degradation
    • inspection of coastline degradation
    • inspection of vegetation

Table 1 shows an overview of FS-derived products, their resolution and example applications.

Table 1. Derived products of FS images and their relevant applications

 Description         Example applications               Resolution
 Ortho RGB           Overview image                     Max GSR: 2 cm
                     Visual inspection                  Common GSR: 10 cm
                     Deriving inputs for biophysical
                     model
 Ortho NIR           Input for NDVI                     Max GSR: 2 cm
                                                        Common GSR: 10 cm
 NDVI map            Vegetation stress diagnosis        Max GSR: 2 cm
                     Assessment lavaka                  Common GSR: 10 cm
                     maintenance
                     Assessment bare soil
                     Input for biophysical model
 Land cover map      Vegetation classification          Max GSR: 2 cm
                     Forestry                           Common GSR: 10 cm
                     Land use / land cover change
                     assessment
                     Input for biophysical model
 DEM                 Damage inspection                  Max x-y res. 5 cm; z res. 5-10 cm
                     Lavaka volume assessment           Common x-y res. 10 cm; z res. 10-20
                     Evaluating SLM practices /         cm
                     terracing
                     Input for biophysical model
 3D model            Visualization / dissemination      Max x-y res. 5 cm; z res. 5-10 cm
                     Inspection tool for decision       Common x-y res. 10 cm; z res. 10-20
                     makers                             cm
 KMZ /KML            Localization in Google Earth       Max x-y res. 5 cm; z res. 5-10 cm
                     Visualization / dissemination      Common x-y res. 10 cm; z res. 10-20
                                                        cm

                                                                                               13
Within LAUREL, FSs do not only hold potential for monitoring and mapping land degradation, but they also yield valuable data that can be put to use in LANDSIM-P, the modeling component of the project. Notable biophysical model inputs that can be derived from FS imagery include stone cover of the land surface, plant diameter, and vegetation density. A location- and land cover type- specific assessment of these parameters will improve the dynamic modelling of erosion processes by LANDSIM-P, which would otherwise rely on generic literature values. 14
4        Evaluation and recommendations

At the end of the training, the experiences of the participants were discussed and evaluated. The
following points list the most notable feedback from the group:

    •   The training participants are enthusiastic about the new technology and its great
        potential. They think it might be very useful to deploy Flying Sensors (FSs) in their
        professions, for tasks like surveillance, monitoring hotspots of LD, monitoring status of
        forestry. The participants have experienced the use of FSs and the processing of ortho-
        mosaics as user-friendly. They were interested to learn more. They were planning to do
        home studies on processing with the help of the supplied manuals.
    •   The group came up with the idea to mount other sensors on the FS. That would be a
        good idea, as long as the sensor is not too heavy. The payload of FS Sensy-M is max.
        300 grams.
    •   Members of the PADAP team suggested that it will be necessary to perform flights at one
        of the PADAP hotspots. For this purpose a multi-day trip should be organized. This is
        according to the intentions of the LAUREL team for the second part of the training.
    •   The presently used FSs are good for medium-sized tasks, but fall short for large- scale
        monitoring operations. This can partly be solved by establishing the connection with RS.
        In the long term, it may be an interesting option to explore an upgrade to bigger FSs that
        can carry out flights with larger range.
    •   Everybody is looking forward to the continuation of the training (part II) in which we will
        focus on:
             o Continuation with piloting skills
             o Advanced image processing
             o Exploring further applications based on processed maps and models

Based on discussions with the participants and observations during the training, we further
recommend the following:

    •   Consider other sensors like thermal or lidar. Preferably user-friendly and low budget;
    •   Consider using a train-the-trainers approach in the next training;
    •   Organize a multi-day field trip to PADAP hotspots for flight operations to collect the first
        specific data for the PADAP sites. Preferably in accordance with other LAUREL activities
        on land degradation during the next mission;
    •   The needs for the FS training part II should be established in close consultation with the
        other LAUREL land degradation experts;
    •   More powerful FS for larger-scale operations may provide added value for the PADAP
        land degradation monitoring requirements. This will be further explored during the next
        training session at one of the PADAP sites;
    •   The following training objectives will need to receive further attention during Part II of the
        training:
    •   Detecting land degradation
    •   Monitoring effects of SLM interventions
    •   Relating FS outputs to existent land degradation monitoring tools and mapping methods

                                                                                                   15
Appendix I: Training program
Day 1, Wednesday 14 February
Morning
• Preparatory discussions with training supervision team
• Technical preparations: mounting NIR Cam
Afternoon
• Technical preparations: mounting NIR Cam
• Preparatory field visit (FutureWater and WWF) to land degradation hotspot, 8 km SE
from downtown Antananarivo
o Exploration of the area for field visit of Friday 16 February
o Conducting flights in order to collect images from LD hotspot
Day 2, Thursday 15 February, 8.00-17.00h. Location: office WB
(in French, as shared with participants)
8.00-10.00h Introduction sur FSs
• Introductions de l’équipe de formateur’ et des participants
• Historique et vue d’ensemble et présentation des activités de
FutureWater et HiView
• FSs: plateformes volantes & capteurs; applications diverses
10.00-10.30h Pause
10.30-12.00h Introduction au Flying Sensor SENSY-M, à l’aide d’un manuel
Le SENSY-M est un quadcopter équipé de deux capteurs :
visuel et NIR (NearInfraRed, autrement dit capteur en proche
rouge)
12.00-13.00h Déjeuner
13.00-15.00h Suite de l’introduction au Flying Sensor SENSY-M : vols automatiques
Suivi par un court discours sur les activités opérationelles
• Pre-site (préparations, réglementation, listes de vérification)
• On-site (sécurité, préparations, activité de voler)
• Post-site (stockage data, rapportage, postcure)
15.00-15.30h Pause
15.30-17.00h Introduction à quelques traitements d’images
• Orthophotographies
• Cartes de l’indice NDVI (Normalized Difference Vegetation
Index)
• Modèles numériques d’élévation (Digital Elevation Models,
DEMs)
Day 2, Friday 16 February, 8.00-17.00h. Location: lavaka test site (morning), office WB
(afternoon)
8.00-13.00h Visite du site de démonstration.
Localisation : Alasora, sur la route des lotissement IMV
En première partie les participants prendront part aux exercices fonciers
du pilotage manuel du FS.
16Ensuite, des vols automatiques (à l’aide d’une tablette ou d’un
smartphone) seront démontrés ayant pour objectif l’acquisition d’images
aériennes en relation avec la dégradation des sols.
13.00-14.00h Déjeuner et retour au bureau de la Banque Mondiale WB
14.00-16.00h Traitement des images captées durant le vol de démonstration.
16.00-16.30h Pause
16.00-17.00h Evaluation de l’entraînement. Prévision sur la session suivante.
17Appendix II: List of participants
Nom Profil Poste occupé/Organisation
01 Herinarivo Ingénieur Assistant technique des opérations/PADAP ;
Razafindralambo agronome herinarivo@yahoo.fr
02 Andraina Ingénieur Responsable
Rajemison forestier environnement/foresterie/PADAP ;
andrainarajemison@gmail.com
03 Mamy Ingénieur Assistant en sauvegarde environnementale et
Rasolofoarivony forestier sociale/PADAP ;
rasolofoarivonymamy85@gmail.com
04 Fabienne Géographe Responsable SIG/PADAP ;
Randrianarisoa fabi.msis@gmail.com
05 Tojo Ingénieur Responsable Eau et irrigation/PADAP ;
Rafidimanantsoa hydraulicien rafidimanantsoa@yahoo.fr
06 Ollier Duranton Ingénieur Administrateur du système d’information/MNP ;
Andrianambinina informaticien adsi@madagascar.national.parks.mg;
07 Jean Michel Ingénieur Collaborateur technique/BNCREDD ;
Ravoninjatovo forestier ravoninjatovoj@yahoo.fr
08 Fameno Tahiana Géographe Direction de l’Intégration de la Dimension
Ranaivoson Environnementale/MEEH ;
famenotahiana@gmail.com
09 Noelson Laingo Ingénieur Observatoire de l’aménagement du
Herizo géomètre territoire/M2PATE ; nixonnoelson@gmail.com
Randriamasinoro topographe
10 Rakotondranivo Ingénieur Collaborateur auprès de la Direction Contrôle
Mihary Nantenaina forestier Forestier/MEEF ; miharynantenaina@yahoo.fr
11 Haja Rabeharisoa Ingénieur Chef de service irrigation/MPAE ;
hydraulicien hazjah@yahoo.fr
18You can also read