KINGSTON FLOOD CONTROL STUDY VILLAGE OF KINGSTON - DEKALB COUNTY, ILLINOIS MARCH 2021
←
→
Page content transcription
If your browser does not render page correctly, please read the page content below
State of Illinois
  Department of Natural Resources

              OFFICE OF WATER RESOURCES
Kingston Flood Control Study
     Villageof Kingston
        DeKalb County, Illinois
                            March 2021

                                          DNR-OWR-19-0084 • 12/18 • IOCI 19-0387
TABLE OF CONTENTS
                                                                                                                                   Page
I. PURPOSE AND AUTHORITY ..........................................................................................................1
II. WATERSHED DESCRIPTION ........................................................................................................1
III. HYDROLOGY………………………………………………………………………………………………4
IV. HYDRAULICS……………………………………………………………………………………………..6
V. FLOOD PROBLEM .......................................................................................................................12
VI. DAMAGES MODEL………………..……………………………………………..….............................13
VII. ALTERNATIVES INVESTIGATED…………………………………………………………………….16
VIII. DAM SAFETY PERMIT MODELING……………………………………………………………….…27
IX. CONCLUSIONS…………………………………………………………………….…………………….29

FIGURES
         Figure 1 - Project Location/Street Map……………………………………………………………2
         Figure 2 - Land Use Map……………………………………………………………………………..3
         Figure 3 - Watershed Sub Basin Map………………………………………………………….…..5
         Figure 4 - Existing Conditions 100 Year Floodplain and Cross-Sections Map…………….8
         Figure 5 - High Water Mark Locations Map……………………………………………………..11
         Figure 6 - Alternative 1 Channel Project Description Map……………………………………17
         Figure 7 - Alternative 1 Channel Project 100-Year Floodplain Map…………………………19
         Figure 8 - Alternative 2 Channel Project Description Map……………………………………21
         Figure 9 - Alternative 2 Channel Project 100-Year Floodplain Map…………………………22
         Figure 10 - Alternative 3 Reservoir Project Location Map……………………………………24
         Figure 11 - Alternative 3 Reservoir Project 100 Year Floodplain Map……………………...26
         Figure 12 - Alternative 3 Reservoir Project 100 Year Dam Breach Floodplain Map……..30
         Figure 13 - Alternative 3 Reservoir Project 0.5 PMF Dam Breach Floodplain Map………31
         Figure 14 - Alternative 3 Reservoir Project 0.5 PMF Dam Breach Flooded Structures….32
         Figure 15 - Existing Conditions 0.5 PMF Floodplain Map…………………………………...33

         REFERENCES………………………………………………………………………………………..36

                                                                     i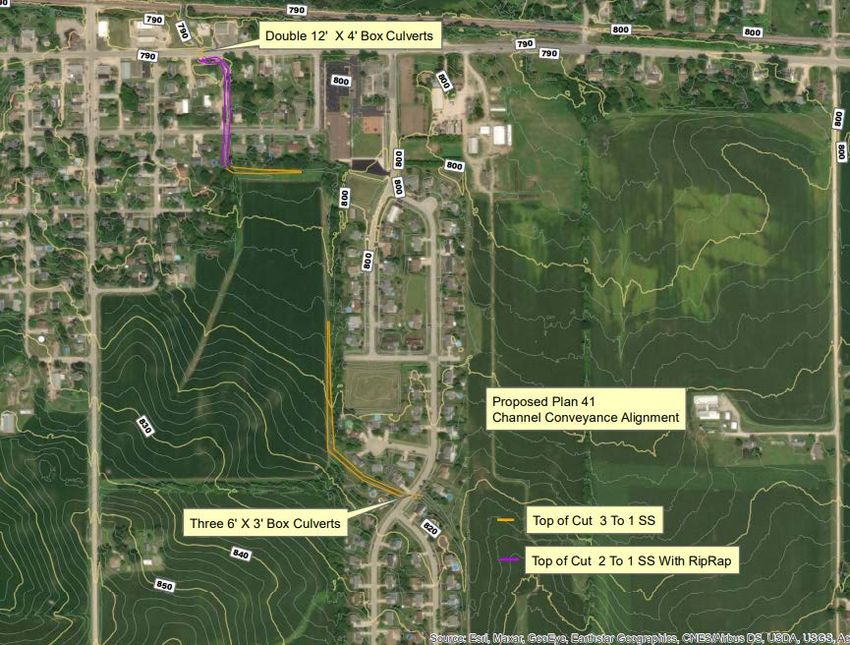
APPENDICES
    Appendix A - Hydrologic Modeling
    Appendix B - Hydraulics Modeling
    Appendix C - Calibration Modeling
    Appendix D – Damages Calculations
    Appendix E – Benefits And Costs
    Appendix F – Benefits And Costs

                                        -ii-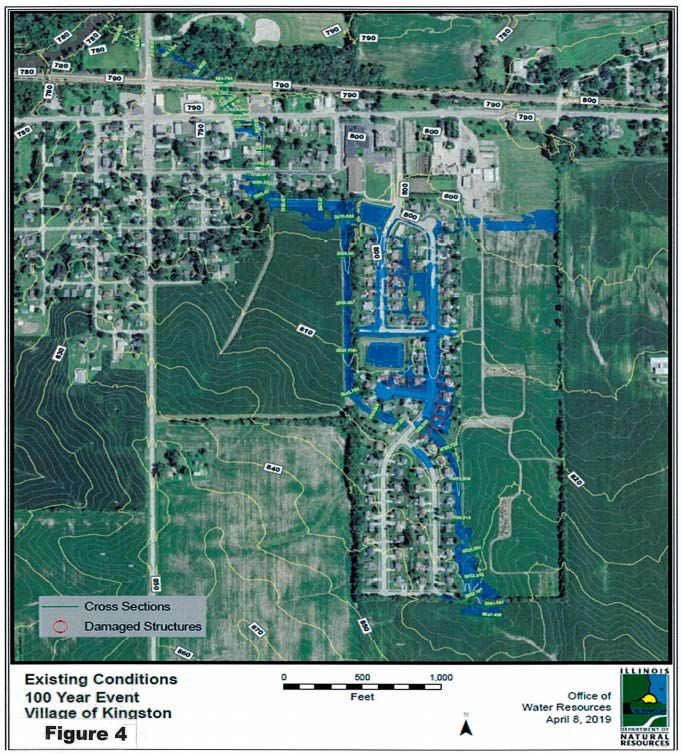
KINGSTON FLOOD CONTROL STUDY
                                           Village of Kingston
                                         DeKalb County, Illinois

I. PURPOSE AND AUTHORITY

This report summarizes the results of a flood control study for the Village of
Kingston, Illinois. This study is intended to identify the sources and extent of the existing flood
problems, and to evaluate alternatives for reducing future flood damages.

The Illinois Department of Natural Resources/Office of Water Resources (OWR), is granted the
authority to conduct flood control surveys and studies for all watersheds of the state through the
Flood Control Act of 1945, 615 ILCS 15, Illinois Compiled Statutes.

II. WATERSHED DESCRIPTION

The Village of Kingston, Illinois is located in the northern part of DeKalb County, approximately 60
miles northwest of Chicago, Illinois and about 21 miles southeast of Rockford, Illinois (Figure 1).
Kingston is located about 13 miles north of DeKalb, Illinois. Kingston is located along Illinois State
Route 72 about 7.6 miles east of Interstate 39.

The Village of Kingston has a population of 1,164 based on the 2010 census figures.
Land use outside the Village limits is primarily agricultural with some wooded areas.
Land use within the Village limits is mostly residential with some commercial and business
development (Figure 2).

The Village is served by an unnamed tributary which flows south to north through the central part of
the Village. The unnamed tributary has a slope of about 51.3 feet per mile through the study area.

                                                     1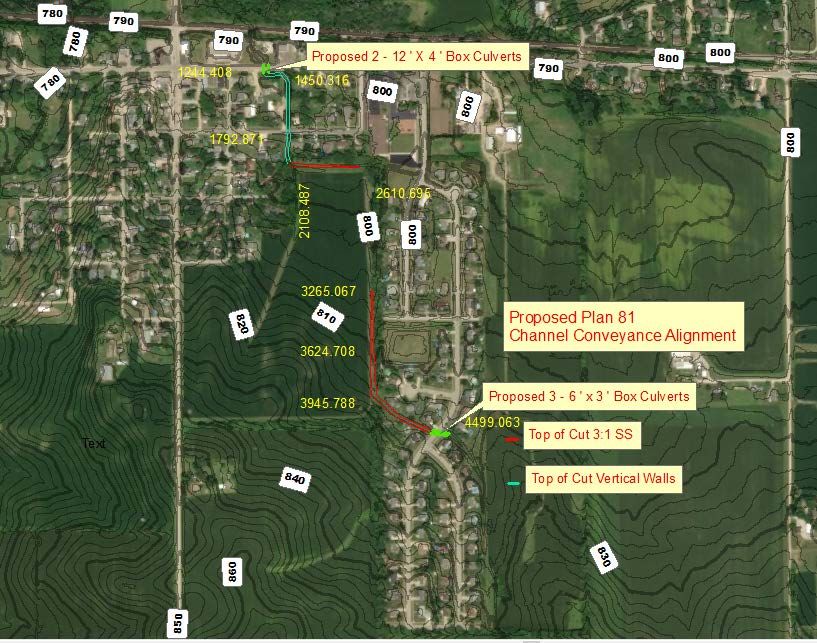
FIGURE 1 - Location Map

                          2
FIGURE 2 - Watershed Sub-Basins Map With Land Use
This unnamed tributary commences about 208 feet south of the Kingston Village limits and extends to
about 980 feet downstream of the Village limits. This tributary flows through the Village for a distance
of about 4,860 feet (0.9 miles) and outlets to the South Branch Kishwaukee River. The South Branch
                                                   3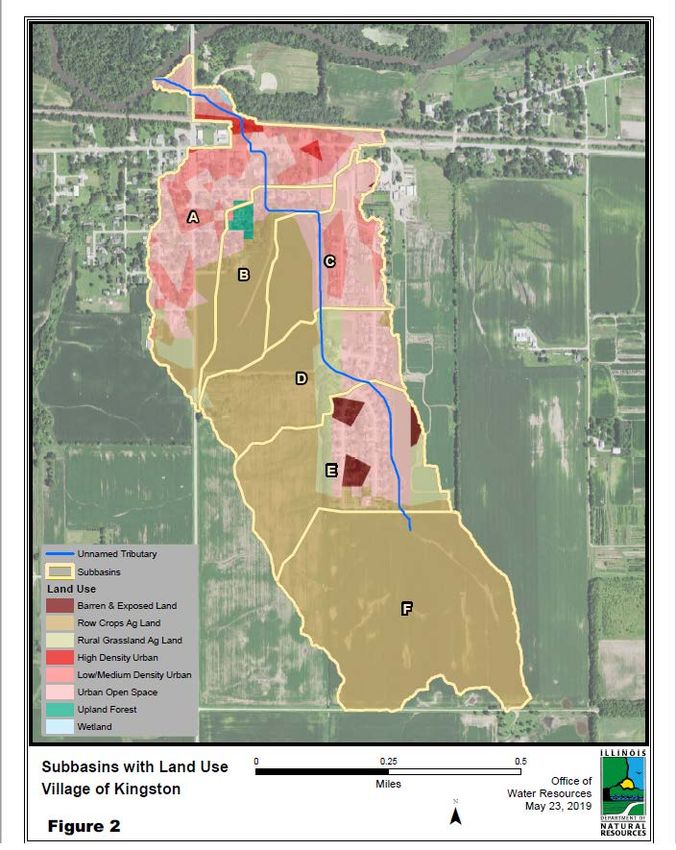
Kishwaukee River flows into the Kishwaukee River.

The total unnamed tributary watershed area is approximately 0.44 square miles. For this study, the
watershed was divided into 6 subareas (Figure 3). The tributary conveys flow to the north through
Kingston, beneath six roadway structures, including the Illinois State Route 72 bridge, and two
railroad bridges. Cropland, located south of the Village, is designated as Subarea “F”, and has a
drainage area of 0.13 square miles. Runoff from this area enters the unnamed tributary and these
flows continue to the north through Kingston.

III. HYDROLOGY

HEC 1
The watershed under consideration does not have stream gauging stations to provide historical or
factual stream flow information. Therefore, synthetic methods were utilized to arrive at estimates of
discharges for various frequency storm events, at strategic locations being studied. The US Army
Corps of Engineers' HEC-1 computerized watershed hydrology model was used. The SCS Curve
Number Loss Rate method was chosen to analyze the watershed. These curve numbers were
generated by analyzing soil types and land use in GIS.

The SCS unit hydrograph method was selected to compute synthetic unit hydrographs for each
subarea. The time of concentration (Tc) for each subarea was determined. TLAG was computed
using the time of concentration in equation TLAG = 0.6 x Tc. Hydrographs were computed as
necessary to obtain storm hydrographs and peak discharges at strategic locations.

A total of seven (1-, 3-, 6-, 12-, 18-, 24-, and 48-hour) duration 100-year frequency were input into the
HEC1 model and analyzed to determine the critical duration. The critical duration is that duration
along with the corresponding point rainfall that produces the highest discharge amounts. The1- hour

                                                    4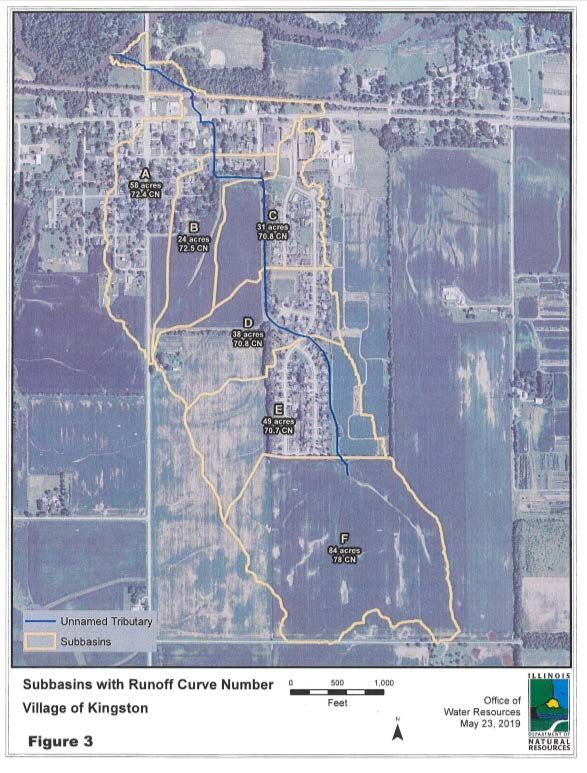
Figure 3 - Watershed Sub-Basins Map
duration yielded the greatest runoff discharge and therefore was selected as the design storm event.
The design HEC-1 model simulates the runoff from a 3.56-inch rain distributed over a 1-hour duration.
(Appendix A). The100-year flood event has a 1% chance of occurring in any 1-year.

                                                  5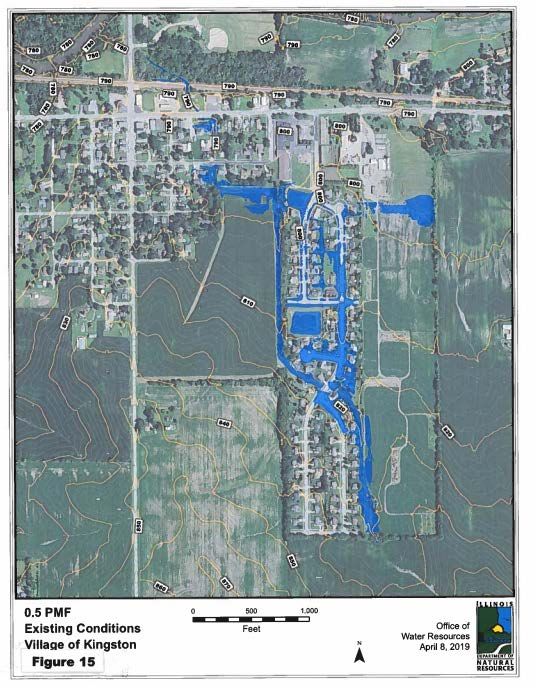
Meteorological models were made for six different storm frequency events which were the 2-,5-,10-
,25-,50-,100-year for each sub-watershed which included the use of various hydrologic parameters
(Table 1). The subareas were delineated in GIS using 2-foot contour interval mapping based on lidar
and field investigations.

IV. HYDRAULICS

HEC-RAS
The US Army Corps of Engineers HEC-RAS backwater model utilizes surveyed bridge, channel, and
floodplain cross section information to compute water surface profiles when a discharge is input into
the model. An existing conditions HEC-RAS Unsteady combination 1-Dimensional and
2-Dimensional Flow Model was developed (Appendix B), based on the survey information obtained
from 2014 OWR field surveys and Lidar also.

The HEC-RAS hydraulic modeling commences at the confluence of the unnamed tributary and the
South Branch Kishwaukee River and continues upstream(south) through the Village for a distance of
about 6,047 feet. The model terminates about 208 feet south of 9th Street. The slope area method
was used to estimate the starting water surface elevation, assuming the slope of the energy grade
line was similar to the bed slope. Cross section locations for the HEC-RAS model and the Existing
Conditions 100-year floodplain are shown in Figure 4.

                                                  6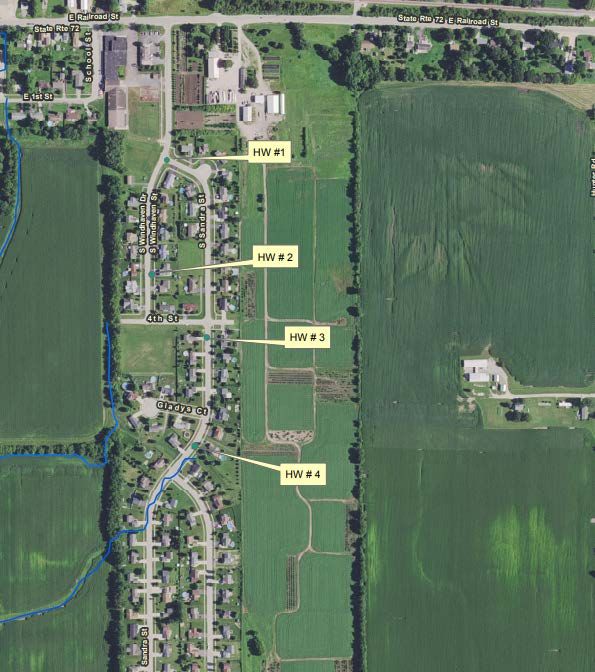
Table 1 - Hydrologic (HEC1) Parameters

Several lateral structures were used in the HEC-RAS model. One of which was located along the
north side of the Railroad Tracks Bridge. The minimum weir elevation at this location is 782.37 feet
and the weir elevations correspond to the existing ground elevation at that location. This weir conveys
flows out of the Unnamed Tributary system to the South Branch (S.B.) Kishwaukee River. Because
the discharge conveyed over this weir flows to the S.B. Kishwaukee River, this flow was permanently

                                                  7
FIGURE 4 - Cross Sections And Existing Conditions 100 Year Floodplain Map
removed and not recombined with the remaining Unnamed Tributary flows continuing downstream to
its confluence.
8There is an increase in the 100-year frequency water surface elevation upstream of the 1st Street box
culvert of 2.88 feet. Most of this increase is because of the change in the channel invert elevation just
upstream of this culvert. The invert increases from 786.6 feet to 788.79 feet which is a change of
2.19 feet. There is a drop structure located just upstream of the box culvert for transition through this
abrupt elevation change. This structure was modeled in HEC-RAS as an in-line structure.
A second lateral structure was modeled in HEC-RAS at the detention basin located upstream of
1st Street just south of the Kingston Grade School. This structure connects the 1-dimensional flow
area to the 2-dimensional flow area located south of the school and extending to the Sandra Street
Culverts. The lateral structure minimum weir elevation is 798.0 feet.
A lateral Structure was also input into the HEC-RAS model upstream of the Sandra Street roadway
culverts along the low area on the north side of the channel. The lateral structure weir corresponds to
the ground elevations at this location and has a minimum elevation of 815.0 feet. The 100, 50, and
25-year frequency flows generate water surface elevations upstream of Sandra Street that exceed
this minimum elevation. When this occurs, flow overtops the lateral structure weir and is conveyed
overland through the Windhaven Drive and Sandra Street subdivision area resulting in structure
damages. The amount of flow conveyed by the weir is controlled by the length and elevation of the
weir. The maximum 100-year water surface elevation at the lateral structure weir is 817.78 feet.
The subdivision area located north of the Lateral weir upstream of Sandra Street, was modeled as a
2- dimensional area. Flow conveyed over the Lateral Structure weir was then modeled as it moved
overland using about 3,581 cells referred to as a mesh. These cell area elevations were determined
using an elevation tin developed from Lidar elevation data. Flows travel through each cell of the
mesh based on elevation. Thus, flow will be conveyed throughout this 2-dimensional area based on
the lowest elevation within each cell section inside the mesh. The average cell size area calculated in
the model was 634.8 square feet.
CALIBRATION
USGS Stream Stats discharges were obtained and the 90% confidence limits discharges were plotted
along with the OWR discharges. The USGS discharges plots compared very well with the OWR
discharges. The OWR discharges were within the range between the 90% minimum and 90%
maximum confidence limits of the U.S.G.S. StreamStats discharges.
9The HEC-RAS model was calibrated using the May 13, 2011 flood event. The precipitation amount
and storm duration were determined by using NEXRAD data from the National Weather Service in
conjunction with gage data from precipitation gages at Kingston, Belvidere, Genoa, DeKalb, and the
DeKalb Airport. The HEC1 discharge was developed using the precipitation data. The precipitation
data was input into the HEC1 model to generate discharges for the flood event. These discharges
were input into the existing conditions HEC-RAS model and the resulting water surface elevations
were calculated.
High water mark locations were determined using photos of the flooded area provided by the
residents. The highwater marks noted were surveyed to obtain elevation data (Figure 5). The
elevations from the 2011 flood HEC-RAS model were then compared to high water mark elevations
determined within the Village. These highwater elevations matched reasonably close to the
elevations from the HEC-RAS model within the Windhaven Drive and Sandra Street subdivision
damage area. The elevation differences ranged from 0.35 feet to 0.02 feet between the HEC-RAS
model and the high water marks. Thus, the HEC-RAS model developed for the unnamed tributary
was considered to be reasonably accurate (Appendix C).
The critical duration Existing Conditions discharges from the HEC-1 model were input into the
Existing Conditions HEC-RAS model for the entire range of storm frequencies. This hydraulic model
provided the flood frequency-elevation information for existing conditions. Once the HEC–RAS model
was finalized, the 100-year floodplain was delineated on the plan map using the 100-year profile
elevations from this model. Similar hydrologic and hydraulic modeling was then done for the project
alternatives to determine project impacts on flood flows and elevations.
10Figure 5 - High Water Mark Locations Map
V. FLOOD PROBLEM
A. Description
11The drainage system that was studied in the Village of Kingston consists of an unnamed tributary
channel that conveys flows through the central portion of the Village and eventually drains into the
South Branch Kishwaukee River. The total drainage area of the unnamed tributary to its confluence
is 0.44 square miles. The tributary conveys flows from south to north through the central part of the
Village which includes the Windhaven Drive and Sandra Street subdivision area.
The total drainage area upstream of Sandra Street and south of Kingston totals approximately
0.21 square miles. This drainage area includes 0.13 square miles of cropland south of the Village
which has a slope of .0183 feet per foot or 97 feet per mile, which is quite steep. This contributes to
higher runoff rates from this drainage area which exceed the channel capacity of the tributary at the
two 3.5’ x 2.5’ corrugated metal pipe arch culverts under Sandra Street.
The total discharge upstream of the Sandra Street culverts is about 277 cubic feet per second (cfs) at
the 100-year frequency existing conditions event. This discharge amount exceeds the capacity of the
two culverts at Sandra Street. The minimum elevation of the right bank upstream of the culverts is
815.0 feet. When the water surface exceeds this elevation, flows overtop the channel bank and
continue northward overland along the old channel alignment. The maximum overland flow is about
120 cfs for the 100-year frequency event. These overland flows cause damages to nine structures
within the Windhaven Drive and Sandra Street areas of this subdivision based on this Study. The
total head loss through the two Sandra Street culverts is 1.8 feet at the 100-year frequency existing
conditions discharge. Approximately 189 cfs continues to be conveyed along the existing channel
downstream of Sandra Street.
Structure damages result when overland flow occurs at this location for the higher 25, 50, and
100-year frequency runoff events which of course produce greater flow rates. These less frequent
flood events have a lower percentage chance of occurring in any one year. The100-year frequency
has a one percent chance of occurring in a one year period whereas a 2-year frequency event has a
50 percent chance of occurring in a 1-year period.
B. Historic Events and Damages
The Village most recently experienced a flood event which occurred in May 2011 following an
12approximate 5.29 - inch rainfall with a duration of 8 hours. Damage Survey forms were provided by
IDNR/OWR to the Village to be used to provide structure damage information for this flood event.
These forms were completed by residents and were returned by the Village, to OWR. The completed
forms show that damages totaling $78,536 occurred to structures along the unnamed tributary which
was studied and is described in this report.
VI. DAMAGES MODEL
For the One-Dimensional section of the Study Area, an Average Annual Damages computer model
was compiled to calculate damages based on the 100, 50, 25, 10, 5, and 2-year frequency discharge
water surface profiles. The first floor and low water entry elevations were surveyed for all
damageable structures. All the structures were identified by structure type and were then input into
the damage model along with the structure first floor and low water entry elevations.
This damage model uses US Army Corps of Engineers depth-damage curves to determine structure
and contents damages. Based on the depth of flooding, damages are calculated for each structure
using the depth-damage curves. A HEC-RAS hydraulic model was used to calculate existing
conditions water surface elevations for the 100, 50, 25, 10, 5, and 2-year frequency discharges. The
depth of flooding is determined from the first floor elevations and the computed water surface
elevations. The existing conditions delineated100-year floodplain shows that no structures located in
the 1-dimensional study area were located within the floodplain inundation. Therefore, no damages
were calculated for any structures there.
To calculate Average Annual Damages for the 2-Dimensional Study Area a different method was
required. It was necessary to provide Raster Tifs for all 6 flood frequencies, 100-YR, 50-YR, 25-YR,
10-YR, 5-YR and 2-YR. This was done for “Plan97_Existing_Cond”, which was the Existing
Conditions HEC-RAS Model.
Point locations of 316 structures were evaluated to determine which ones were impacted by flood
waters from the raster profiles. ESRI ArcGIS 10.2.2 ArcMap desktop software was used for this
evaluation. This included the Extract Multi Values to Points tool of the Spatial Analyst extension. The
24 plan/profile evaluations were conducted using a python script listed in Attachment B. The meta
13data output from running the script is posted as Attachment A. Refer to Appendix D to view these
Attachments. The results are given as shape files.
There is a separate shapefile for each plan that contains the 316 point locations with attribute
columns added for flood elevation at each profile i.e. – “F100YR”, “F50YR” “F25YR”, “F10YR”,
“F5YR”, and “F2YR”.
HEC-RAS Existing Conditions Model had 9 structures that were impacted by the100-year flood event.
Refer to Map 1 in (Appendix D). Some of these structures were also contacted by the lower
frequency profiles as indicated in the relevant fields for each profile.
The final results with only structures that were contacted by flood profiles are provided as feature
classes in the “working.gdb” file geodatabase. A separate feature class is given for plan,
“P97_exist_contacts”. These results are also listed in a Microsoft Excel spreadsheet,
“Kingston_Plan_Eval_Results.xlsx” in (Appendix D). It includes the relevant parameters of the
structure such as value and elevations in addition to the flood elevation that reached the structures for
each of the given profiles when it occurred.
Alternatives 1, 2, and 3 did not have any structure points in contact with the rasters of the flood
profiles. Therefore, there were no flood damages in the 2-Dimensional Model damage area for this
alternative and 2-D area damages equal $0.0.
The final results with only structures that were contacted by flood profiles are provided as feature
classes in the “working.gdb” file geodatabase. A separate feature class is given for each of the three
plans, “P97_exist_contacts”, and “P81_ChExCul_contact”. These results are also listed a Microsoft
Excel spreadsheet, “Kingston_Plan_Eval_Results.xlsx”. It includes the relevant parameters of the
structure such as value and elevations in addition to the flood elevation that contacted the structures
for each of the given profiles when it occurred for each of 3 different plans. These plans were
“Plan97_Existing_Cond”, “Plan81_Channel_Excavation_Culv” and “Plan93_Reservoir.”
A Damages Excel Spreadsheet was set up which contained the U.S. Army CORPS of Engineers
Depth Damage Curves and corresponding percent damage. Damage occurs to those structures
when the water physically comes into contact with the structure. Thus, these structures were
14identified as described above and were entered into the Damages Spreadsheet. The surveyed first
floor elevations for each structure and the water surface elevations provided for each frequency event
were used to determine depth of flooding. This information was also entered into the Damages
Spreadsheet. Thus, based on the depth of flooding, damages are calculated for each structure using
the depth-damage curves and percent damage values. The Damages Excel spreadsheet is too
extensive to be included in the body of this report but can found in Appendix D.
Based on this damages analysis there is a total of 9 structures in the Windhaven Drive and Sandra
Street Subdivision area which are damaged. The total Average Annual Damages were calculated to
be $10,017.71. This amount includes 15% non-tangible damages which is a standard amount used
to account for other losses associated with flooding issues that include flood clean up such as,
acquiring dumpsters, hauling, traffic control due to road closures, and setting up barricades. Average
Annual Damages is the average amount of damages caused by flooding each year. See
Appendix D for a list of the structure data and a summary of the damages.
VII. ALTERNATIVES INVESTIGATED
A detailed investigation of three alternatives was conducted to determine the amount of flood
damages reduction that could be provided with implementation of each alternative. These
alternatives are listed and described below.
Alternative 1 – Culverts Replacement Excavated Channel Conveyance (plan 41)
Alternative 2 – Culverts Replacement Excavated Channel Conveyance (Plan 81)
Alternative 3 – Upstream Storage Reservoir (Plan 93)
Alternative 1
This alternative investigated includes construction of three 6’ x 3’ concrete box culverts at Sandra St.
to replace the existing two 3.5 foot by 2.5-foot pipe arch culverts. This alternative includes channel
excavation commencing at the downstream face of Sandra St. which extends downstream to X-
15Section 3265.067, a distance of 1,093 feet. The cut depth is 3.75 feet with a 4-foot bottom width and
3h to 1v side slopes (Figure 6). The proposed channel slope is .00954 foot per foot.
Approximately 922 feet downstream of this channel improvement, another channel improvement
begins. This channel excavation commences at X-Section 2342.97 and ends at the upstream face of
the 1st Street Culvert. This is an additional 590 feet of channel excavation to 1st Street. The
excavation slope is .0121 foot per foot. The excavation depth is 2.5 feet with a 2-foot bottom width
and a 3h to 1v side slope to X-Section 1943.47. At this location the bottom width changes to 10 feet
and the channel side slopes become 2h to1v with rip rap. The concrete drop structure just upstream
of 1st Street would be removed since the new channel slope would tie into the existing box culvert
invert elevation at 1st Street.
16FIGURE 6 - Alternative 1 Plan View Channel Project Description Map
Additional channel excavation from the downstream face of the of 1st Street culvert to Illinois Route 72
would be included using the existing channel invert elevations. A 10-foot bottom width and an
excavation depth of 5.0 feet is used with side slopes at 2h to 1v. The 2h to1v side slopes will be lined
17with rip rap. This additional improvement reach totals 545 feet. In addition, the double 8’ x 4’ RC Box
Culvert at Illinois Route 72 would be replaced with a double 12’ x 4’ RC Box Culvert.
This alternative reduces the maximum water surface elevation for the 100-year frequency beginning
at the upstream face of the Sandra St. box culverts by about 1.1 feet from 817.48 ft. to 816.35 ft. This
reduction continues upstream but decreases to 0.5 feet about 180 feet upstream. The reduction in
elevation decreases to 0 about 500 feet upstream of Sandra Street. Because of the 1.1-foot
reduction in water surface elevation upstream of Sandra Street, overflows into the subdivision which
typically have caused flooding, are reduced considerably with this alternative. Even though there is
still some overflow into the subdivision, it is relatively minor and there are no structures that are
flooded. This alternative minimizes overflow into the Windhaven Drive and Sandra Street subdivision
area and eliminates structural damages. (Figure 7).
As a result of the channel excavation downstream of the proposed Sandra St. Box Culverts, the
maximum water surface elevation for the 100-year frequency is reduced even though the discharge
increases by about 88 cfs. The water surface reduction downstream varies from 0.04 feet just
downstream of the Sandra St. Culverts to 1.2 feet at X-Section 3983.13, and then to 0.01 feet at
X-Section 3364.77. The elevations then begin to gradually increase and are 0.26 feet greater than
existing conditions at X-Section 3245.26 and then the change decreases to 0 feet at
X-Section 2362.09. Then the elevations drop below existing conditions and vary from 0.13 feet at
X-Section 2303.89 to around 1.95 feet at X-Section1961.81. The reduction then gradually dissipates
to 0.07 feet at X-Section 1822.36 just upstream of 1st Street.
18FIGURE 7 - Alternative 1 Channel Project 100 Year Floodplain Map
The100-year water surface elevations are reduced just downstream of 1st St. by 0.22 feet and range
to 0.48 feet at X-Section 1431.49 about 320 feet downstream of 1st St. The reduction begins to
gradually decrease to 0.05 feet at X-Section 1320.75 about 430 feet downstream. At the next
19downstream X-Section there is a gradual increase in water surface elevation to ranges up to 0.71 feet
just downstream of the Il. Route 72 bridge. The increase then ranges from 0.67 feet to 0.03 feet over
the next 400 feet and goes to 0.0 feet increase at X-Section 754.19.
As a result of the modified channel, velocities increase in some reaches throughout the conveyance
improvement. At several locations, rip rap protection is proposed to protect the channel from erosion
where the increased velocities exceeded scour velocity thresholds.
Alternative 2
This alternative investigated was Plan 81 which is almost identical to Plan 41 just described above.
The only difference between these alternatives was the channel excavation in the channel reach just
upstream of 1st Street at X-Section 1943.47 to Illinois Route 72. The channel excavation in this reach
differs in that a 20 foot bottom width is used instead of a 10 foot bottom width. Also, vertical walls are
used instead of 2h to 1v side slopes (Figure 8). The vertical walls would be constructed using split
face block. This Alternative requires less land rights to be acquired from property owners for
construction through the channel reach where the vertical walls are used. This alternative reduces
the maximum water surface elevation for the 100-year frequency beginning at the upstream face of
the Sandra St. box culverts by about 1.1 feet from 817.48 ft. to 816.38 ft. This reduction continues
upstream but decreases to 0.5 feet about 180 feet upstream. The reduction in elevation decreases to
0 about 425 feet upstream of Sandra Street.
Because of the 1.1 foot reduction in water surface elevation upstream of Sandra Street, overflows
into the subdivision which typically have caused flooding, are reduced considerably with this
alternative (Figure 9). Even though there is still some overflow into the subdivision, it is relatively
minor and there are no structures that are damaged by flooding. This alternative minimizes
20FIGURE 8 - Alternative 2 Plan View Channel Project Description Map
21Figure 9 - Alternative 2 Channel Project 100 Year Floodplain Map
overflow into the Windhaven Drive and Sandra Street subdivision area and eliminates structural
damages.
22As a result of the channel excavation downstream of the proposed Sandra St. Box Culverts, the
maximum water surface elevation for the 100-year frequency is reduced even though the discharge
increases by about 88 cfs. The water surface reduction downstream varies from 0.04 feet just
downstream of the Sandra St. Culverts. to 1.2 feet at X-Section 3983.13, and then to 0.01 feet at
X-Section 3364.77. The elevations then begin to gradually increase and are 0.26 feet greater than
existing conditions at X-Section 3245.26 and then the change decreases to 0 feet at
X-Section 2381.22. Then the elevations drop below existing conditions and vary from 0.07 feet at
X-Section 2362.09 to around 2.07 feet at X-Section1961.81. The reduction then gradually dissipates
to 0.05 feet at X-Section 1822.36 just upstream of 1st Street.
The100-year water surface elevations are reduced just downstream of 1st St. by 0.56 feet and range
to 0.43 feet at X-Section 1431.49 about 320 feet downstream of 1st St. The reduction begins to
gradually decrease to 0.03 feet at X-Section 1337.336 about 412 feet downstream. At the next
downstream X-Section there is a gradual increase in water surface elevation to ranges up to 0.70 feet
just downstream of the Il. Route 72 bridge. The increase then ranges from 0.66 feet to 0.03 feet over
the next 400 feet and goes to 0.0 feet increase at X-Section 754.19.
As a result of the modified channel, velocities increase in some reaches throughout the conveyance
improvement. At several locations, rip rap protection is proposed to protect the channel from erosion
where the increased velocities exceeded scour velocity thresholds
Alternative 3
Alternative 3 would consist of constructing a reservoir upstream of the subdivision in the farm field
south of the Village (Figure 10). This reservoir would be a gravity in and gravity out design in that the
embankment would be constructed at the lower end of the reservoir area to impound runoff above
ground behind the embankment. One 24-inch diameter RCP culvert would be constructed through the
embankment at an invert elevation of 834.0 feet. This culvert was sized to convey some
23Figure 10 - Alternative 3 Reservoir Project Location Map
24discharge but restrict flow such that water would back up into the reservoir. As storm event runoff
decreases the culvert would drain or dewater the reservoir. This reservoir would store runoff from
Sub Area F which would reduce discharges downstream at the Sandra St. culverts.
An earthen embankment would be constructed at a height of 7.15 foot to elevation 841.15 feet, to
impound storm water runoff. The total storage volume of the reservoir at the 100-year frequency
discharge would be 12.9 acre-feet at an elevation of 839.07 feet. Total discharge through the
24-inch RCP would be 32.0 cfs. The total area inundated at the 100-year frequency would be
5.8 acres. The reservoir would have a rip rap armored earthen emergency spillway with a crest
elevation of 839.15 feet and a length of 100 feet.
By storing runoff volume in the reservoir upstream, flows are reduced at the two existing 3.5 foot by
2.5 foot corrugated metal pipe arch culverts at Sandra Street. As a result, this alternative reduces the
maximum water surface elevation for the 100-year frequency event at the upstream face of the
Sandra Street. The 100-year frequency elevation at the Sandra Street culverts is reduced by
1.56 feet from 817.48 ft. to 815.92 ft. This reduction minimizes overflow into the Windhaven Drive
and Sandra Street subdivision area and eliminates structural damages. Refer to Figure 11 which
shows the 100-year floodplain for this alternative 3.
Downstream of Sandra St. the maximum water surface elevation is reduced by 0.79 feet and
continuing downstream the reduction gradually decreases. At a distance of 1,211 feet downstream,
the reduction is 0.65 feet. Continuing further downstream the reduction ranges from 0.65 feet to
1.08 feet to 1st Street. Downstream of 1st Street the reduction in elevation ranges from 1.08 feet to
0.89 feet all the way to the most downstream railroad bridge. Downstream of the railroad bridge the
reduction ranges in elevation from 1.9 feet to 0.5 feet.
25FIGURE 11 - Alternative 3 Reservoir Project 100 Year Floodplain Map
VIII. DAM SAFETY PERMIT MODELING
26This Reservoir would likely be classified as a Small High Hazard Dam by the OWR Dam Safety
Program because of the residences located downstream of the reservoir. This would require that a
permit be obtained from the Dam Safety Program for the reservoir. There are several different
calculations and several different Hydrologic and Hydraulic models that are required for a Dam Safety
permit (Appendix E). As part of the permit application an analysis of the reservoir is required using
0.5 times the Possible Maximum Precipitation (PMP). The PMP is 32 inches of rainfall in a 24-hour
period and 0.5 times the PMP is 16 inches of precipitation. The 24-hour duration is used because
that is the duration required by OWR Dam Safety Section. Using 0.5 PMP results in the 0.5 Possible
Maximum Flood (PMF). Thus, 0.5 PMF is the amount of runoff that is generated from the drainage
area by one half of the PMP.
The total 0.5 PMF runoff amount from the drainage area located upstream of the reservoir must be
routed through the reservoir. The amount of runoff from the 0.5 PMF storm that can’t be stored in the
reservoir, must be conveyed by the 24-inch diameter RCP outlet and the emergency spillway without
overtopping the dam embankment. The HEC-RAS analysis shows that the 0.5 PMF runoff is
conveyed by the 24 -inch diameter outlet pipe and the emergency spillway at elevation 839.63 feet.
Thus, the 0.5 PMF runoff does not overtop the reservoir embankment which is at elevation 841.15
feet. Therefore, the reservoir outlet system would meet the required criteria. The maximum storage
volume for the 0.5 PMF storm event is 16.4-acre feet. The maximum discharge over the emergency
spillway and through the 24-inch diameter pipe combined is 149 cfs. The emergency spillway would
convey 117 cfs and the 24-inch diameter outlet pipe would convey 32 cfs.
The HEC-RAS analysis for the 100-year storm event with the proposed Alternative 3 Reservoir,
results in a maximum elevation of 839.07 feet. Therefore, the maximum water surface elevation in
the reservoir is below the crest of the emergency spillway which is at elevation 839.15 feet.
Wave runup and wind setup calculations were performed for the reservoir for the 100-year frequency
event. The increase in elevation that resulted was 0.93 feet. When this increase is added to the
100-year elevation of 839.07, the total water surface elevation in the reservoir is 840.0 feet. Thus,
this will not overtop the reservoir embankment at 841.15 feet and results in 1.15 feet of freeboard.
The 100-year reservoir storage volume of 12.9 acre feet would be dewatered by the 24-inch diameter
pipe in 20 hours.
27Figure 12 shows the 100-year dam breach analysis that was analyzed using HEC-RAS modeling.
The final breach width used was 30 feet with 0.5h to 1v side slopes and a final bottom elevation of
834.0 feet. The overtopping method was used along with a breach time of 0.25 hours. No damages
occurred to any structures as a result of the dam breach analysis.
The 0.5 PMF dam breach analysis was analyzed using HEC-RAS modeling (Figure 13). The final
breach width used was 30 feet with 0.5h to 1v side slopes and a final bottom elevation of 834.0 feet.
The overtopping method was used along with a breach time of 0.2 hours. The failure was triggered
using a water surface elevation plus duration. The water surface used was 834.0 feet along with a
duration of 15 hours above the 834.0 feet threshold elevation.
The 0.5PMF dam breach does result in damages to four structures (Figure 14). The four structures
would have water inside the attached garages but not inside the first floor. Three of the four
structures would sustain fewer damages than the at the 25-year frequency because the 0.5 PMF dam
breach water surface is less than the 25-year water surface elevation. The fourth structure would
have fewer damages than at the 50-Year frequency event since the 0.5PMF dam breach water
surface elevation is less than the 50-year water surface elevation.
The existing conditions 0.5 PMF storm event was also modeled using HEC-RAS and therefore, no
reservoir is included in this analysis. The existing conditions analysis was used for comparison to the
0.5 PMF dam breach analysis which of course does include the proposed reservoir (Figure 15). As
mentioned above, the 0.5 PMF is based on one half of the PMP which is 16 inches of rainfall in a
24-hour period. Thus, 0.5 PMF is the amount of runoff that occurs in the watershed from one half of
the PMP amount.
Four structures are flooded by the 0.5 PMF Plan 93 Reservoir dam breach. The 0.5 PMF dam
breach analysis elevations range from .031 feet to .327 feet lower than the 0.5 PMF existing
conditions elevations at these same structures. Therefore, all four structures have less flooding than
occurs with the existing conditions 0.5 PMF flood event.
A formal maintenance plan would be required to be developed which specifies what maintenance
activities will be performed. A timetable for each of the specified maintenance activities would also
need to be specified. In addition, an Emergency Action Plan would need to be developed which is a
28formal document that identifies the possible emergency conditions at the dam. This plan would
identify all action that would be taken in the event of an emergency and by which entities.
IX. CONCLUSIONS
A total of three Alternatives were investigated as described in this report. Two of these alternatives
increased channel conveyance and were effective to address the flood issue without causing any
additional flood issues. The Channel Conveyance Alternatives eliminated all structure damages.
These alternatives were Plan 41 and Plan 81. The Plan 93 Reservoir was a storage alternative which
also eliminated all damages (Table 2).
A total of 9 structures flooded at the 100-year frequency event, 6 at the 50-year, and
5 at the 25-year frequencies located in the Windhaven Drive and Sandra Street subdivision area.
None of these structures were damaged at the 10-, 5-, and 2-Year frequency events. These three
alternatives all provide100-year frequency flood protection for these 9 structures that sustained
damages, based on this study.
Although the three alternatives eliminate all structure damages, the Alternative recommended is the Plan 93
Reservoir. This Alternative generates average annual benefits of $10,017.71 and has a benefit to cost ratio of
0.56. This is the highest benefit to cost ratio of the alternatives considered.
29FIGURE 12 - Alternative 3 Reservoir Project 100 Year Dam Breach Floodplain Map
30FIGURE13 - Alternative 3 Reservoir Project 0.5 PMF Dam Breach Floodplain Map
31FIGURE 14 - Alternative 3 Reservoir Project 0.5 PMF Dam Breach Damaged Structures Map
(Red Dots)
32FIGURE 15 - Existing Conditions 0.5 PMF Floodplain Map
The benefit to cost ratio for Plan 41 Channel Conveyance and Plan 81 channel conveyance was 0.26
and 0.18 respectively.
33Alternative 3 Reservoir Project is also the lowest cost alternative of the alternatives. This alternative
would have a total first cost of $393,221.33 and the total annual cost would be $17,914.16. The total
annual benefits would be $10,017.71. As stated above this alternative has a benefit to cost ratio of
0.56. Alternative 1 Channel Project would have a total first cost of $935,666.54 and total annual
cost of $39,057.34. Alternative 2 Channel Project would have a total first cost of $1,343,331.73 and a
total annual cost of $55,653.94.
Since Alternative 3 Reservoir Project has the highest benefit to cost ratio, it should be considered for
implementation. The total first cost of this alternative is $393,221.33 which includes construction,
mobilization, contingencies, land rights, engineering and design (Appendix F). The land rights costs
are $195,071.05 and the construction costs are $198,150.28. The land rights costs are based on an
appraisal obtained by the Village. OWR could fund all construction costs and the Village would be
required to fund the land rights costs of $195,071.06.
The amount of funding OWR can provide is based on capitalized benefits and these are computed by
multiplying the Average Annual Benefits by 26.35185 which is the reciprocal of the Capital Recovery
Factor (CRF). The CRF is calculated using the U.S. Army CORPS of Engineers interest rate of
2.875% for Fiscal Year 2021. This interest rate is applied based on a project life of 50 years to yield
the CRF. The capitalized benefits are calculated to be $263,985.19 based on the amount of benefits.
Thus, OWR could fund construction costs of a project up to this amount. However, this is a greater
amount than the Alternative 3 construction costs and OWR can only fund up to the amount of the
construction costs, which is $198,150.28.
The Village is required to purchase all necessary land rights for the project. The Village would also be
responsible to pay for the relocation of any utilities necessary for construction of the Project. Utilities
relocation costs have not been quantified. It should be noted that all damages, benefits, and costs
are October 2018 dollars and can be found in Appendix F.
Table 2, a Kingston Alternatives Comparison Matrix spreadsheet shows the AAB, project construction
costs and total project costs for each of the alternatives. OWR funding is based on the amount of
benefits generated and is equal to the amount of capitalized benefits determined using the current
Federal Discount Rate referenced above. However, the funding amount provided can’t exceed the
total project construction costs. Also, all dollar amounts used are October 2018 dollars.
34Table 2 - Alternatives Comparison Matrix
REFERENCES
Huff, Floyd A., and James R. Angel. Frequency Distributions of Heavy Rainstorms in Illinois.
Circular172, 1989. Illinois State Water Survey, Champaign.
Huff, Floyd A. Time Distributions of Heavy Rainfall in Illinois. Circular 173, 1990.
Illinois State Water Survey, Champaign.
35Huff, Floyd A., and James R. Angel. Rainfall Distributions and Hydroclimatic Characteristics of Heavy
Rainstorms in Illinois. (Bulletin 70), 1989. Illinois State Water Survey, Champaign.
Straub and others. Equations for Estimating Clark Unit – Hydrograph Parameters for Small Rural
Watersheds in Illinois. U.S. Geological Survey Water Resources Investigations
Report 00-4184.
U.S. Department of Agriculture -Natural Resource Conservation Service, Urban Hydrology for Small
Watersheds, Technical Release 55, June 1986.
U.S. Army Corps of Engineers, Hydrologic Engineering Center, HEC-RAS River Analysis System,
Version 5.0 February 2016.
U.S. Army Corps of Engineers, Hydrologic Engineering Center, HEC-HMS Hydrologic Modeling
System, Version 4.2 August 2016.
USGS’ Streamstats website. https://www.usgs.gov/mission-areas/water-
resources/science/streamstats-streamflow-statistics-and-spatial-analysis-tools?qt-
science_center_objects=0#qt-science_center_objects Accessed 2017.
OWR’s Damages Calculator 4.3.
Procedural Guidelines for Preparation of Technical Data to be Included in Application for Permits
For Construction and Maintenance of Dams IDNR/OWR.
Freeboard Criteria And Guidelines for Computing Freeboard Allowances For Storage Dams U.S.
Department of Interior Bureau of Reclamation 1981.
Rip Rap Design For Overtopped Embankments, Colorado State University Engineering Research
Center. October 1998.
Hydraulic Design of Energy Dissipaters for Culverts And Channels, U.S. DOT FHA, Circular 14,
September 1983.
USDA Natural Resources Conservation Service, Slope Protection for Dams And Lakeshores,
36Minnesota Technical Note 2, October 1997.
Hydrologic Engineering Requirements for Reservoirs, U.S. Army CORPS of Engineers
Engineering and Design, EM 1110-2-1420, 24-Sep. 2018.
Hydrometeorological Report No. 51, Probable Maximum Precipitation Estimates, United States
East of the 105th Principal Meridian, Office of Hydrology National Weather Service. June 1978.
37You can also read