Kinesin-1 activity recorded in living cells with a precipitating dye
←
→
Page content transcription
If your browser does not render page correctly, please read the page content below

ARTICLE
                  https://doi.org/10.1038/s41467-021-21626-1                 OPEN

                  Kinesin-1 activity recorded in living cells with a
                  precipitating dye
                  Simona Angerani1, Eric Lindberg1, Nikolai Klena                        2,   Christopher K. E. Bleck            3,   Charlotte Aumeier1 ✉ &
                  Nicolas Winssinger 1 ✉
1234567890():,;

                  Kinesin-1 is a processive motor protein that uses ATP-derived energy to transport a variety of
                  intracellular cargoes toward the cell periphery. The ability to visualize and monitor kinesin
                  transport in live cells is critical to study the myriad of functions associated with cargo
                  trafficking. Herein we report the discovery of a fluorogenic small molecule substrate (QPD-
                  OTf) for kinesin-1 that yields a precipitating dye along its walking path on microtubules
                  (MTs). QPD-OTf enables to monitor native kinesin-1 transport activity in cellulo without
                  external modifications. In vitro assays show that kinesin-1 and MTs are sufficient to yield
                  fluorescent crystals; in cells, kinesin-1 specific transport of cargo from the Golgi appears as
                  trails of fluorescence over time. These findings are further supported by docking studies,
                  which suggest the binding of the activity-based substrate in the nucleotide binding site of
                  kinesin-1.

                  1 School of Chemistry and Biochemistry, NCCR Chemical Biology, Faculty of Science, University of Geneva, Geneva, Switzerland. 2 Department of Cell Biology,

                  Faculty of Science, University of Geneva, Geneva, Switzerland. 3 Electron Microscopy Core Facility, National Heart, Lung and Blood Institute, National
                  Institutes of Health, Bethesda, MD, USA. ✉email: charlotte.aumeier@unige.ch; nicolas.winssinger@unige.ch

                  NATURE COMMUNICATIONS | (2021)12:1463 | https://doi.org/10.1038/s41467-021-21626-1 | www.nature.com/naturecommunications                                 1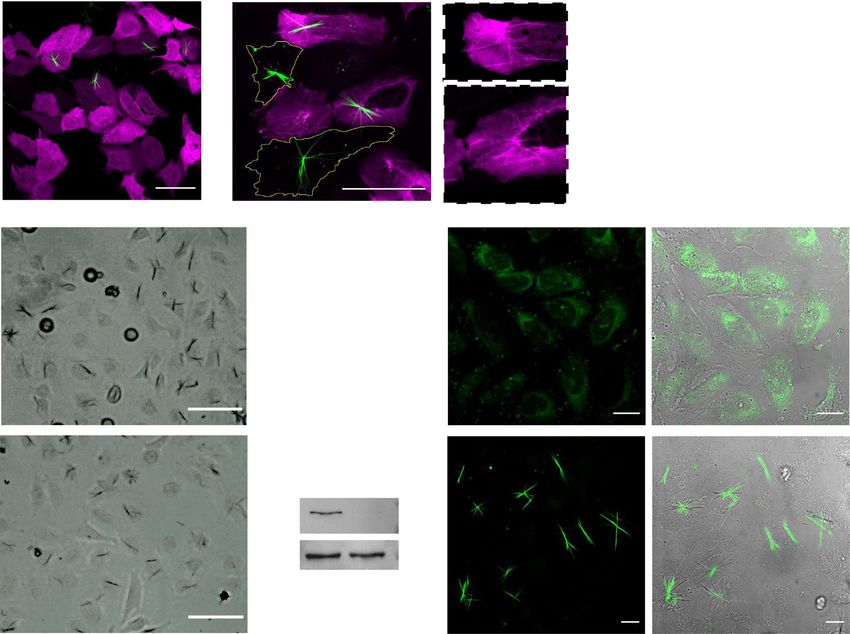
ARTICLE                                                                    NATURE COMMUNICATIONS | https://doi.org/10.1038/s41467-021-21626-1

M
           icrotubules (MTs) are polymers of α and β tubulin that              Functionalization of the phenol frees the aryl moiety out of pla-
           are involved in several functions in cells. Although the            narity with the quinazolinone, which dramatically reduces its
           majority of MTs emanates from the centrosome1, the                  aggregation and precipitation; derivatization with a polar group
main non-centrosomal MT organizing center is represented by                    renders these molecules water soluble.
the Golgi apparatus2. The minus-end of the MT is anchored at                      Herein, we report the discovery of a QPD derivative (QPD-
the MT organizing center and the dynamic plus-end orientated                   OTf) that acts as an activity-based fluorogenic substrate for
towards the cell periphery.                                                    kinesin-1 by producing a precipitating fluorescent dye along its
   Motor proteins, such as kinesins and dyneins, are ATPases that              walking path on MTs. The phenolic moiety is functionalized with
bind to MTs and walk along with them in response to cargo                      a triflate group that renders the molecule soluble in an aqueous
binding3. Kinesin-1 is a member of the kinesin family that                     buffer and non-fluorescent. Biochemical experiments show that
transports cargoes to the cell periphery walking on MTs towards                kinesin-1 and MTs are sufficient to yield fluorescent crystals and
their plus-end4. Among others, kinesin-1 is interacting with both              that inhibition of kinesin-1’s ATPase activity reduces the for-
pre-Golgi and Golgi membranes and it is involved in Golgi-to-ER                mation of fluorescent crystals. Docking studies support the
and ER-to-Golgi trafficking5,6. Kinesin-1 is autoinhibited and                  binding of the activity-based substrate in the nucleotide-binding
only functionally active once bound to cargo during Golgi-to-ER                site, aligning the triflate leaving group with the gamma-phosphate
transport. Active kinesin-1 molecules bound to microtubules run                group of ATP. In live cells, the crystals are centered in the Golgi
across hundreds of tubulin dimers without dissociating7,8.                     apparatus and radially elongate towards the cell periphery,
Truncation of the kinesin-1 heavy chain can lead to constitutively             recording kinesin-1 motion on MTs. Thus, QPD-OTf enables
active mutants of kinesin-19,10. The motion of kinesin-1 occurs                visualization of the native transport activity of kinesin-1 in cellulo
preferentially on a subset of modified, long-lived MTs, such as                 without external modifications.
acetylated and detyrosinated MTs11–13. The transport activity of
kinesin-1 can be inhibited by Taxol, a drug that stabilizes and
changes the MT structure14.                                                    Results
   To date, techniques to monitor motor proteins in cells have                 QPD-OTf forms crystals in living cells. Taking advantage from
relied on antibodies, quantum dots, or on engineered versions of               the large applicability of QPD-based profluorophores, we envi-
the motors bearing fluorescent tags15–20; these techniques require              sioned the synthesis of a QPD derivative, QPD-OTf (Fig. 1a)
sample treatment (fixation and staining) or manipulation                        initially designed to be responsive to superoxide, for the visuali-
(transfection). Moreover, these techniques stain total protein                 zation of oxidative stress in cellulo. In analogy with a reported
content, irrespectively of their motility. Only about 30 % of                  fluorescein derivative30, the trifluoromethanesulfonate ester
kinesin-1 is active in cells21; this makes it difficult to study                should be activated enough to undergo a nucleophilic attack by
kinesin-1-GFP movement along MTs within the strong back-                       O2.− affording the free phenol. Surprisingly, QPD-OTf was found
ground of immotile kinesin-1-GFP in transfected cells11.                       not to be responsive to O2.− in vitro, with no precipitation
   QPD is a quinazolinone-based precipitating dye developed to                 observed.
easily visualize enzymatic activity in cellulo22,23. Accordingly,                 QPD-OTf treatment of zymosan stimulated RAW264.7 cells
QPD has been used to design fluorogenic reporters of phospha-                   caused dotted fluorescent precipitate after 10 min that evolved
tase (PO4− derivative)24, protease (ester derivative)25, and H2O2              into complex filamentous crystals within 1 h (Supplementary
(boronic acid derivate)26 or catalysis (azide27 or picolinium28                Fig. 1). The QPD crystal is an extended, aster-like fluorescent
derivative), and these substrates have been used to label a number             crystals expanding throughout the cell (Supplementary Fig. 2 and
of organelles and cytoskeletal elements24,27. QPD fluorescence                  Supplementary Movie 1) and even able to deform the cell
derives from an excited-state intramolecular proton transfer                   membrane (Fig. 1b and Supplementary Fig. 3). While overnight
(ESIPT)29 between the phenolic group and the quinazolinone.                    exposure of 10–20 µM QPD-OTf induces cell death, temporary

                        a

            b                                                                                                  c

Fig. 1 Schema of the soluble profluorophore QPD-OTf and the insoluble fluorescent dye QPD and QPD crystal in cells. a Structure of QPD-OTf and
QPD. b Aster-like QPD crystal in live U2OS cell (20 µM QPD-OTf, 4 h); green: crystal. Left: QPD fluorescence; middle: bright field image; right: merged
channels. Scale bar 20 µm. c FIB-SEM 3D-reconstruction of the crystal inside HeLa cells; green: crystal. Scale bar 0.4 µM.

2                  NATURE COMMUNICATIONS | (2021)12:1463 | https://doi.org/10.1038/s41467-021-21626-1 | www.nature.com/naturecommunications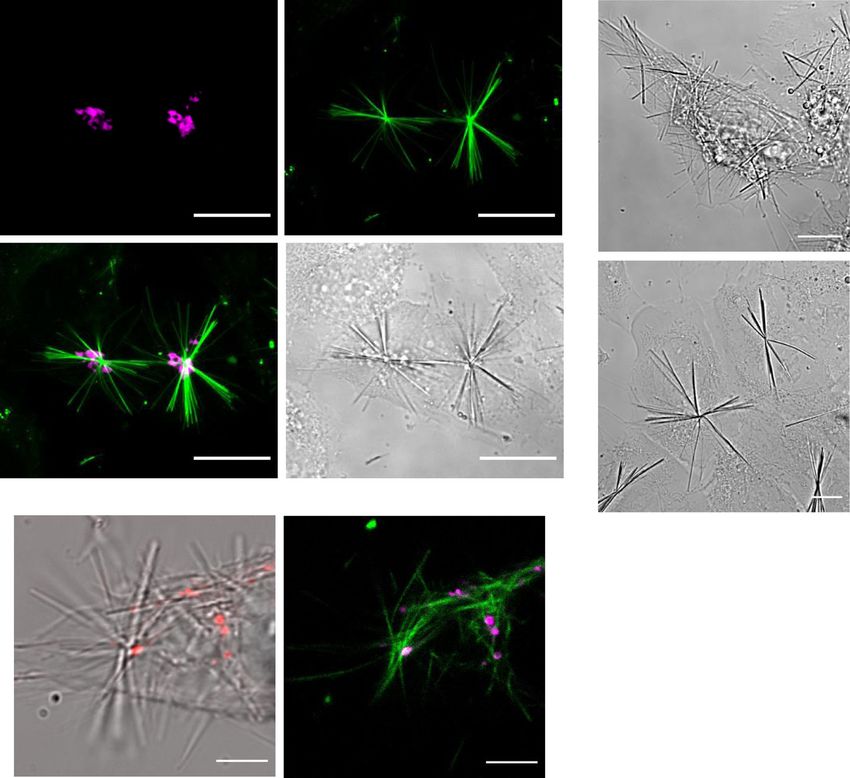
NATURE COMMUNICATIONS | https://doi.org/10.1038/s41467-021-21626-1                                                                     ARTICLE

exposure of up to 4 h followed by fresh media replacement,                       crystal within a subset of the MT network, we focused on the
preserves cell viability almost completely (Supplementary Fig. 4)                nucleation site of the crystals. In fact, most of the cells in inter-
and even dissolved the crystal over time (Supplementary Movie 2                  phase show a single crystal, originating close to the nucleus. This
and Supplementary Fig. 5). Since the fluorescent signal can only                  raises the possibility that the nucleation site of the crystal overlaps
arise from a QPD displaying an uncaged phenol, we hypothesize                    with the nucleation site of MTs. MTs nucleate mainly from MT
that the triflate caging moiety must be removed inside the cell                   organizing centers located close to the cell center. However, the
upon enzymatic activity. The observation of these crystals across                most prominent MT organizing center, the centrosome, did not
multiple cell lines from different mammalian species (RAW264.7,                  co-localize with the triggering site for QPD precipitation (Sup-
HeLa, MCF-7, HEK293, U2OS, PTK2) shows that this activity is                     plementary Fig. 10). Therefore, we investigated another MT
conserved and not restricted to a specialized cell line (Supple-                 organizing center: the Golgi apparatus. The Golgi is known to be
mentary Fig. 3). While different cell lines afforded slightly                    involved in MT nucleation2,32, and to be a key player in the
different crystal morphology, all cell lines showed fibers that                   secretory pathway33.
emanate from central points. It should be noted that different cell                 To assess whether the MT organizing center at the Golgi
lines also showed different kinetics of crystal formation which can              triggers QPD precipitation, we visualized the Golgi in U2OS cells
in part account for the differences in crystals when comparing the               by transfecting them with mCherry-Giantin. Confocal fluores-
same time point across different cell lines.                                     cence microscopy revealed that the crystals are nucleated at the
   FIB-SEM analysis of HeLa cells treated with QPD-OTf (20 µM,                   Golgi apparatus (Fig. 4a and Supplementary Movie 3) and that
4 h) showed that the crystals have a well-defined organization,                   Golgi vesicles are found along the crystal filaments (Supplemen-
with rotational symmetry order 3-like structure (Fig. 1c), and                   tary Fig. 11). The observation was confirmed by transfecting
hexagonal cross-section, whose size varies from 100 to 700 nm                    mCherry-Giantin, a Golgi-marker, in a stable expressing PTK2-
(Supplementary Fig. 6). It should be noted that the rigidity of                  GFP-tubulin cell line with subsequent treatment of QPD-OTf
crystals is such that plasma membranes of retracting cells are                   (Supplementary Fig. 12). The MT organizing center of the Golgi,
deformed (Fig. 1c). In the FIB-SEM image, a more extreme case is                 together with its transport activity could therefore play a key role
observed where the crystal penetrates through the nucleus (Fig. 1c               in determining the selective transformation of QPD-OTf to QPD
and Supplementary Fig 6a). Given the incubation time, fixation,                   in a specific cellular location.
and dehydration steps involved in the sample preparation, this                      In order to further investigate the role of the Golgi apparatus in
observation may be an artifact of sample preparation. We also                    the formation of QPD crystals, we studied the effect of Brefeldin
noted that the crystal has a clear nucleation center (Supplemen-                 A (BFA), an inhibitor of Golgi trafficking. BFA impairs the
tary Fig. 6) which spurred us to further investigate the triggering              function of Golgi, resulting in its fragmentation34,35. While the
mechanism behind the crystal formation.                                          Golgi apparatus appears as a compact complex in U2OS
                                                                                 interphase cells, treatment with 20 µM BFA showed the expected
                                                                                 scattered Golgi fragments (Supplementary Fig. 13). QPD-OTf
Crystals co-localize with MTs. Many crystals are localized at the
                                                                                 addition to BFA treated cells resulted in thinner crystals (fiber
cell center, spanning with their filamentous nature throughout the
                                                                                 thickness reduced by 58%) (Fig. 4b, c) with multiple foci of origin
cell. Due to their organization and architecture, we thought that the
                                                                                 instead of only one as in control cells (Fig. 4b). Although the
enzymatic activity generating QPD-crystals might be linked to the
                                                                                 Golgi was fragmented, the nucleation site of the crystal remained
actin or MT cytoskeleton. Labeling the cytoskeleton after QPD-OTf
                                                                                 co-localizing with the Golgi (Fig. 4d). This shows that the Golgi
treatment showed clear colocalization between the crystal and the
                                                                                 apparatus is intimately linked to crystal formation and that
MT network (Fig. 2) and only marginal correlation with actin
                                                                                 modifications of the Golgi structure correlate with crystal
(Supplementary Fig. 7). In fixed cells, immunostaining of α-tubulin
                                                                                 morphology and location.
showed alignment of crystal fibers along with MT bundles (Fig. 2a).
We observed that only a distinct subset of the MT network seemed
to co-localize with the crystal. Live-cell imaging by expressing GFP-            Purified MTs are not sufficient to generate crystals in vitro.
tubulin in Ptk2 (Fig. 2b, e) and HeLa cells (Fig. 2c, d, f and Sup-              Having established that MT dynamics is necessary for the
plementary Fig. 8), or staining MTs with SiR-Tubulin (Supple-                    development of crystals, and that the Golgi apparatus, known as
mentary Fig. 9)31, a Taxol-based fluorescent dye, confirmed the                    an MT organizing center, dictates the location of the crystals, we
colocalization of the crystal with a subset of the MT network.                   assessed whether pure MT polymerization is sufficient to generate
   Not all MTs within the cellular network have the same                         a crystal in vitro. To this end, we tried to precipitate QPD on
dynamical properties, and we wondered if MT dynamics was                         Taxol stabilized MTs, or on dynamic MTs elongating from sta-
linked to crystal formation upon QPD-OTf treatment. In order to                  bilized seeds. No crystal formation could be observed and no
test our hypothesis, we altered MT dynamics and studied the                      fluorescence of QPD was detected in our in vitro TIRF assay, even
impact on crystal formation. First, we treated U2OS cells with 1                 after 2 h (Supplementary Fig. 14). Thus, we reasoned that the
μM Taxol and 20 μM QPD-OTf for 4 h and compared to                               conversion of QPD-OTf to QPD crystals must be triggered by an
untreated cells (control). As shown in Fig. 3a and quantified in                  enzymatic event that is closely related to and dependent on the
Fig. 3b, Taxol-induced MT stabilization reduced the crystal                      MT network, but an activity that is not essential for MT elon-
formation by 75%. Moreover, the few crystals we observed in the                  gation. With these considerations, we directed our attention to
Taxol-treated sample were much thinner than in the control                       motor proteins since these proteins move cargoes along MTs in
(Fig. 3a, zoom). Second, we completely depolymerized the MT                      an energy-dependent manner.
network by cold treatment, followed by 20 µM QPD-OTf
incubation for 4 h. In this case, no crystals were observed (Fig. 3a,
                                                                                 QPD-OTf conversion to QPD depends on kinesin-1 motility.
middle). The almost complete absence of crystals with both
                                                                                 The plus-end-directed motor protein kinesin-1 transports cargo
treatments suggests that the integrity and physiological dynamic
                                                                                 from the Golgi to the ER and its enzymatic activity might be
of MTs are substantial requirements for crystal development.
                                                                                 responsible for the conversion of QPD-OTf to QPD with ensuing
                                                                                 crystal formation. We therefore genetically modified kinesin-1
QPD crystals form along MTs originating from the Golgi                           activity in cells and analyzed the effect of kinesin-1 activity on
apparatus. To identify the origin of the specific localization of the             crystal formation. Cells were treated with QPD-OTf after

NATURE COMMUNICATIONS | (2021)12:1463 | https://doi.org/10.1038/s41467-021-21626-1 | www.nature.com/naturecommunications                              3
ARTICLE                                                                                         NATURE COMMUNICATIONS | https://doi.org/10.1038/s41467-021-21626-1

    a                                                                                               c
                             Merge                                                anti-α-Tubulin

    b
                           Merge                                                      Crystal

                                                                                                   d
                        GFP-Tubulin                                                        BF

     e                                                                                              f
                                                        50
                                                                                                                                              5×10 7
                                    GrayValues (a.u.)

                                                        40
                                                                                                                          GrayValues (a.u.)

                                                                                                                                              4×10 7

                                                        30
                                                                                                                                              3×10 7

                                                        20                                                                                    2×10 7

                                                        10                                                                                    1×10 7

                                                        0                                                                                         0
                                                             0      2         4        6                                                               0.0      0.5           1.0
                                                                 Distance (microns)                                                                          Distance (microns)

Fig. 2 QPD-OTf forms crystals that strongly co-localize with MTs in cells. a Tubulin immunostaining in fixed U2OS treated with QPD-OTf (20 µM; 4 h);
white arrows indicate colocalization with crystals (anti-α-tubulin: magenta; crystal and DAPI: green; the nucleus is contoured in yellow). Scale bar 20 µM.
b Live-cell imaging of PTK2-GFP-Tubulin treated with QPD-OTf (20 µM; 2 h); white arrows indicate colocalization with crystals (GFP-tubulin: magenta;
crystal: green). Scale bar 20 µM. c Super-resolution imaging of HeLa-GFP-Tubulin live cells treated with QPD-OTf (20 µM; 2 h); white arrows indicate
colocalization with crystals (GFP-tubulin: magenta; crystal: green). Scale bar 5 µM. d Super-resolution image of live HeLa-GTP-Tubulin cells treated with
QPD-OTf at an early time point (QPD-OTf 20 µM; 20 min) (left); white arrows indicate colocalization with crystals; scale bar 5 µM. Surface plot of crystal
and MT signal (right) (GFP-tubulin: magenta; crystal: green); surface section: 1.8 × 3.0 microns. e, f Plot profiles of tubulin channel (magenta) and QPD
channel (green). Yellow lines represent the sections plotted in the graphs; (a.u. represent arbitrary units). Source data are provided as Source Data file.

transfection with Kin330-GFP or Kin560-GFP, two truncated                                          kinesin-1. Although over-activity of Kin560 in cells transfected
versions of kinesin-1 fused to GFP displaying no ability to walk                                   with Kin560-GFP did not further increase crystal formation
on MTs, and constitutively active walking on MTs                                                   (Fig. 5b, c and Supplementary Fig. 15), it was possible to correlate
respectively36,37. Cells transfected with the kinesin-1 mutant                                     the crystal filaments to the signal of Kin560-GFP on MTs (Fig. 5b,
Kin330 showed a reduction in crystal numbers by 87% compared                                       zoom). It is also noteworthy that despite the concentration of
to non-transfected cells (Fig. 5a, c and Supplementary Fig. 15),                                   Kin560-GFP and broad distribution, fluorescent crystals are only
consistent with the inhibitory effect of Kin330 on the functional                                  seen on specific tubulin axis. In order to validate that the crystal
activity of native kinesin-138. The residual formation of some                                     formation correlates with the activity of kinesin-1, we performed
crystals could be attributed to the activity of endogenous wildtype                                a siRNA knockdown of kinesin-1. We observed that the intensity

4                   NATURE COMMUNICATIONS | (2021)12:1463 | https://doi.org/10.1038/s41467-021-21626-1 | www.nature.com/naturecommunications
NATURE COMMUNICATIONS | https://doi.org/10.1038/s41467-021-21626-1                                                                            ARTICLE

Fig. 3 Formation of QPD crystals in U2OS live cells is disrupted by induced microtubule stabilization or depolymerization. a Representative images of
crystal formation in cells treated (left) with 1 µM Taxol for 1 h and 20 µM QPD-OTf for 4 h at 37 °C; (middle) on ice for 1 h and with 20 µM QPD-OTf for 4 h on
ice; and (right) with 20 µM QPD-OTf for 4 h at 37 °C. (Bottom) Zoomed-in images of cells in the black squares; white arrows indicate crystals. Scale bar 100
µM. b Quantification of the number of crystals for conditions reported in a; n = 100; data are presented as mean value ± the standard deviation (SD); data are
the average of three independent experiments; Statistics were calculated using a two-tailed t-test; ****p < 0.0001. Source data are provided as Source Data file.

of the crystals was significantly reduced in the siRNA treated                    binding is competitive (directly or allosterically) with ATP. These
sample compared to the control (Fig. 5d, e). The knockdown                       results suggest a potential interaction between QPD-OTf and the
efficiency was confirmed by western blot (Fig. 5f).                                ATP binding site of kinesin-1; the ATPase activity of the kinesin-
   To further investigate the effect of kinesin-1 activity on crystal            1 motor domain might be serving as enzymatic activity respon-
formation, we tested the effect of adding kinesore, a small                      sible for the triflate cleavage. The fact that fluorescent crystals are
molecule kinesin-1 activator39. In cells, kinesin-1 is inactive and              observed along the filaments in the absence of ATP suggests that
only gets activated upon cargo binding40,41. Kinesore interacts                  QPD-OTf can act as a substrate for kinesin-1.
with kinesin-1 at the kinesin light chain-cargo interface (Ki = 49
µM for aiKLC2TPR: SKIPWD complex), mimicking the effect of
cargo binding and resulting in kinesin-1 activation. The enhanced                QPD-OTf is a substrate analog of ATP. Taken together, the
motion causes profound rearrangement of the MT network. We                       cellular and biochemical data show the dependence of crystal
found that the addition of 100 µM kinesore to U2OS cells,                        formation upon kinesin-1 motion on MTs. Since kinesin-1
followed by incubation with 20 µM QPD-OTf inhibited the                          exploits ATP hydrolysis to propel its motor domain processively
formation of crystals, yet generated some diffuse QPD fluores-                    on MTs44, and that ATP is not required for crystal formation
cence (Fig. 5g, h). This diffused fluorescence as a result of                     while AMP-PNP reduces crystal formation, we hypothesized that
kinesore treatment is attributed to the over-activity of kinesin-1,              QPD-OTf acts as a substrate analog. We performed molecular
with a motor activity that is no longer coupled to its endogenous                docking of QPD-OTf into the ATP binding pocket of the kinesin-
localization or regulation. This result strengthens the involvement              1 motor domain. We calculated the fitting into human kinesin-1
of kinesin-1 activity in QPD formation and corroborates the                      in the ATP state (PDB: 3J8Y) using Autodock Vina45. The best
results observed with Kin330 transfection. Moreover, the fact that               pose offered calculated binding energy of −8.3 kcal/mol. Super-
QPD formation is observed in the presence of kinesore suggests                   position of this binding pose with ATP showed that the triflate
that kinesore does not compete directly with QPD-OTf binding.                    overlaps with the hydrolyzed phosphate of ATP (Fig. 6e). Based
                                                                                 on the structural similarities between QPD and ispinesib46, an
                                                                                 allosteric Eg5 inhibitor that also has a chloroquinozolinone
Kinesin-1 forms QPD crystals in vitro. In a cell, multiple pro-                  moiety, we also performed docking calculations for QPD-OTf
teins can interact and show enzymatic activity. To pin down if                   with Eg5 (PDB: 4AP0). QPD-OTf shows good pose correlation
kinesin-1 is the candidate to convert QPD-OTf to QPD crystals                    with Ispinesib (Supplementary Fig. 16), however, binding to this
we analyzed a reconstituted in vitro system with purified proteins.               allosteric pocket cannot yield QPD precipitates since it positions
We tested the crystal formation under several conditions in                      the triflate too far from the site of hydrolysis. We next docked
presence of kinesin-1, ± tubulin, MT, ATP, GTP, AMP-PNP in                       QPD-OTf in the nucleotide-binding site of Eg5, affording a good
BRB buffer. Samples containing both kinesin-1 and MTs had a                      affinity (−8.2 kcal/mol); however, this pose positioned the triflate
strong QPD fluorescence (Fig. 6a–c, samples 3–5), with the most                   towards the solvent, making the triflate hydrolysis impossible
intense signal deriving from the sample containing QPD-OTf,                      (Supplementary Fig. 17). Docking studies with kinesin-1 indi-
kinesin, tubulin, and GTP (sample 4). In addition, filamentous                    cated less favorable binding (−5.8 kcal/mol) in the allosteric site
structures were observed in the MT/kinesin/QPD-OTf samples.                      (Supplementary Fig. 18). Collectively, these docking studies
Confocal microscopy confirmed that the filamentous-QPD                             support direct hydrolysis of the triflate of QPD-OTf and provide
structures were fluorescent (Fig. 6d). In presence of a non-                      a rational for the selectivity of kinesin-1 over Eg5. In order to
hydrolysable analog of ATP (AMP-PNP), where kinesin-1 is                         verify this putative selectivity based on the docking model with in
motility is reduced while bound to MTs42,43, we observed lower                   cellulo evidence, we analyzed images of mitotic cells treated with
levels of fluorescent precipitate (Fig. 6a–c, sample 3). This                     QPD-OTf. Eg5 associates with the mitotic spindle47,48, hence, Eg5
reduced signal is consistent with our in cellulo observation where               hydrolysis should result in fluorescence at the mitotic spindle.
kinesin-1 motor activity is required for QPD-OTf conversion.                     Imaging of mitotic HeLa-GFP-Tubulin cells treated with QPD-
The presence of ATP also slightly reduced the formation of the                   OTf did not show crystals emanating from the mitotic spindle but
precipitate (Fig. 6a–c, sample 5). Collectively, this shows that                 did show the expected crystals consistent with Golgi trafficking,
kinesin-1 converts QPD-OTf to QPD and suggests that QPD-OTf                      (Supplementary Fig. 19), indicating that QPD-OTf is not a

NATURE COMMUNICATIONS | (2021)12:1463 | https://doi.org/10.1038/s41467-021-21626-1 | www.nature.com/naturecommunications                                      5
ARTICLE                                                                      NATURE COMMUNICATIONS | https://doi.org/10.1038/s41467-021-21626-1

             a                       mCherry-Giann                                        Crystal     b                                          BFA

                                                Merge                                          BF
                                                                                                                                             Control

               d                                                                                       c                        2.0

                                                                                                                         P M)
                                                                                                        Fiber thickness (P
                                                                                                                                1.5

                                                                                                                                1.0

                                                                                                                                0.5

                                                                                                                                0.0
                                                                                                                                      BFA   Control

Fig. 4 The nucleation center of the QPD crystals is localized at the Golgi apparatus. a Representative images of mCherry-Giantin transfected U2OS cells
treated with QPD-OTf (20 µM 3 h). Crystals (green), mCherry-Giantin (magenta). Scale bar 20 µM. b Representative images showing the effect of
brefeldin A (BFA) on crystal morphology and location. BFA treated cells (20 µM BFA 4 h + 20 µM QPD-OTf 2.5 h) (top). Control (20 µM QPD-OTf 2.5 h)
(bottom); scale bar 10 µM. c Quantification of images reported in b; n = 14 fibers; data are presented as mean value ± the standard error of the mean
(SEM); statistics were calculated using a two-tailed t-test; ***p = 0.0001. d Localization of crystals and Golgi vesicles after BFA treatment; Golgi (red)
crystals (bright field) (left); Golgi (magenta) crystals (green) (right); arrows indicate centers of crystal; scale bar 5 µM. Source data are provided as Source
Data file.

substrate for Eg5. This is corroborated by the data depleting                    protein since its fluorescent product precipitates and leaves a
kinesin-1 using siRNA (Fig. 5d, e) that showed a dramatic                        bright fluorescent trail along the path traveled by kinesin-1. The
reduction in crystal formation.                                                  FIB-SEM images showed a clear helicity in the fibers, indicating
                                                                                 that the crystals were staining a biological structure.
                                                                                    Until now it was difficult to record native kinesin-1 activity in
Discussion                                                                       cells. Kinesin-1-GFP expression at native level results in a high
Small molecule fluorophore conjugates have been a powerful                        fluorescent background of inactive kinesin-1-GFP and it is
approach to monitor a protein of interest and the development of                 therefore impossible to distinguish which microtubules are used
fluorogenic probes for live-cell imaging of the cytoskeleton, for                 for transport19. Complex experimental setups have been devel-
example, have empowered cellular biology studies31. Alter-                       oped, like tracing microtubule dynamics in vivo, fixing cells, and
natively, fluorogenic probes have been designed to report on a                    adding purified tagged kinesins to map which microtubules are
given enzymatic activity by introducing a masked fluorophore as                   likely to be used for transport. Our dye shows a possibility to
a leaving group in an enzymatic reaction, thus acting as an                      record native kinesin-1 activity live in a cell without any mod-
activity-based fluorescent reporter49. While this approach has                    ification or fixation. The development of QPD-OTf opens the
been very productive in image hydrolytic enzymes, such as pro-                   possibility to map the usage of a subset of microtubules within the
tease and glycosidase, with a broad tolerance for the leaving                    dense and dynamic microtubule network.
group, there are no examples reported for motor proteins. The                       In summary, we report an activity-based substrate for kinesin-1
discovery of a fluorogenic substrate (QPD-OTf) to image kinesin-                  yielding a bright precipitate in response to kinesin-1 activity along
1 in live cells shows that it is possible. Moreover, the hydrolysis of           MTs. Based on the kinesin-1’s transport activity from the Golgi,
a phenolic triflate represents an alternative modality for activity-              fibers are observed as a function of time, developing from foci at the
based probes. This substrate is particularly attractive for a motor              Golgi. The center of the crystals reflects the location of Golgi

6                   NATURE COMMUNICATIONS | (2021)12:1463 | https://doi.org/10.1038/s41467-021-21626-1 | www.nature.com/naturecommunications
NATURE COMMUNICATIONS | https://doi.org/10.1038/s41467-021-21626-1 ARTICLE
Fig. 5 Kinesin-1 activity is required for QPD crystal formation in living cells. a U2OS transfected with Kin330-GFP plasmid and treated with QPD-OTf
(20 µM, 2.5 h); green: crystals, magenta: Kin330-GFP. b U2OS transfected with Kin560-GFP plasmid and treated with QPD-OTf (20 µM, 2.5 h) (left); zoom
of highlighted boxes, arrows indicate stabilized MTs correlating with crystals (right); green: crystals, magenta: kinesin. Scale bar: 50 µm. c Quantification of
crystal formation in transfected cells vs control; n = 20; an average of three independent experiments; data are presented as mean value ± the standard
error of the mean (SEM). Statistics were calculated using a two-tailed t-test; **p = 0.0064 (Control vs Kin330), **p = 0.0024 (Kin330 vs Kin560); nsp =
0.065. d Kinesin-1 knockdown experiment. Representative images of HeLa-GFP-Tubulin treated with RNA control sequence + QPD-OTf (20 µM, 2 h) (top)
or with kinesin-1 siRNA + QPD-OTf (20 µM, 2 h) (bottom). Scale bar 100 µM. e Quantification of crystal intensity for the kinesin-1 knockdown experiment.
a.u. represent arbitrary units; n = 30; data are the average of three independent experiments; data are presented as mean value ± the standard deviation
(SD); statistics were calculated using a two-tailed t-test; ***p = 0.0007. f Kif5B and Tubulin bands from western blot assay for the kinesin-1 knockdown
experiment in HeLa cells. Samples derive from the same experiment and blots were processed in parallel. g U2OS treated with kinesore (100 µM) in
Ringer’s buffer + QPD-OTf (20 µM); green: QPD fluorescence. h Control conditions for experiment reported in d (QPD-OTf 20 µM, 2 h in Ringer’s buffer);
green: crystals. Scale bar 20 µM. Source data are provided as Source Data file.
elements; the number of crystals per cell and their thickness cor- humidified incubator. Stable expressing GFP-Tubulin Ptk2 cells (a kind gift from
relates with Golgi compactness/fragmentation. The crystal forma- Franck Perez) were cultured in alpha-MEM (Gibco) containing 10% FCS and 1%
pen–strep at 37 °C under 5% CO2 in a humidified incubator. GFP-Tubulin CRISPR
tion is sensitive to kinesin-1 motility; kinesin-1 depletion disrupts knock-in Hela cells (by C. Aumeier) were cultured in DMEM (Gibco) containing
the formation of the crystals. In addition, the presence of MTs is 10% FCS and 1% pen–strep at 37 °C under 5% CO2 in a humidified incubator. Cells
required to generate QPD fluorescence in vitro. The biochemical were regularly tested for mycoplasma contamination by staining with
data and docking studies support an ATP competitive mechanism Hoechst 33342.
involving QPD-OTf binding to the nucleotide pocket and acting as
a substrate resulting in triflate hydrolysis. The resulting QPD pro- Crystal formation in cells. QPD-OTf (20 µM) was added to cells in DMEM (−)
duct precipitates to form a bright fluorescent fiber along the without additives and incubated at 37 °C, 5% CO2 from 20 min to 4 h. Crystals can
be easily detected by a ×20 objective. Super-resolution imaging was performed
microtubules used by kinesin-1. QPD-OTf staining is compatible using adaptive deconvolution with Leica SP8 LIGHTNING with a ×63 objective.
with live-cell imaging; the possibility to dissolve the crystals in cell
media after staining provides a non-destructive method to visualize Live-cell imaging of QPD-OTf treated cells. PTK2-GFP-Tubulin or HeLa-GFP-
the motion of kinesin-1 on Golgi derived MTs. Tubulin cells (2 × 10⁵) were seeded into 3.5-cm-glass bottom dishes with 10 mm
microwell (Mattek); cells were incubated in a culture medium at 37 °C under 5%
CO2 in a humidified incubator for 24 h. Then media was removed, cells were
Methods washed twice with DMEM (−) (no additives) and QPD-OTf (20 µM) was added to
Cell culture. U2OS, HeLa, HEK293T, MCF-7, RAW246.7 cell lines were obtained cells in DMEM (−) (no additives). Cells were incubated at 37 °C under 5% CO2 for
from the American Type Culture Collection (ATCC) and cultured according to 2 h or for 20 min (early-stage crystals). Cells were washed twice with DMEM (−)
their instructions. U2OS cells were grown in McCoy’s 5A (modified) medium and imaged with a LEICA SP8 microscope or with a LIGHTNING module for
(Gibco) containing 10% FCS and 1% pen–strep at 37 °C under 5% CO2 in a super-resolution images.
NATURE COMMUNICATIONS | (2021)12:1463 | https://doi.org/10.1038/s41467-021-21626-1 | www.nature.com/naturecommunications 7ARTICLE NATURE COMMUNICATIONS | https://doi.org/10.1038/s41467-021-21626-1
a 1 2 3 4 5 6
Kinesin + + + + + +
d
QPD-OTf + + + + + +
Tubulin - - + + + -
GTP - - + + + -
ATP - - - - + +
AMP-
PNP - + + - - -
b 10000
1408 1247 7027 12571 9573 2935
5000
c
e
Fig. 6 In vitro and computational studies of QPD-OTf. a In vitro precipitation of QPD; table of conditions for the samples reported in c; red square
indicates the samples that gave detectable QPD-fluorescence. b Intensity map of emitted light by samples 1–6 under 366 nm excitation; intensity values are
expressed as gray values from the green channel of an RGB picture acquired with a smartphone camera. c Samples under 366 nm light: green channel
(top); original picture (bottom). d Confocal imaging of fluorescent filaments contained in sample 4; green: crystal. Scale bar 50 µm. e Docking of QPD-OTf
into ATP binding site of kinesin-1. Left: QPD-OTf (cyan), ATP (yellow), kinesin-1 (pink); right: QPD-OTf (cyan), ATP (green), kinesin-1 (polarized surface).
Source data are provided as Source Data file.
Sample preparation for FIB-SEM. HeLa cells were grown on MatTek™ glass structures. Images and videos were rendered using Imaris. Crystal cross-sections
coverslips for 2 days. Cells were then washed × 3 with Hank’s Balanced Salt based on surface renderings were measured in Imaris.
solution and QPD-OTf (20 μM) in DMEM without serum was added. Cells were
then incubated for 4 h at 37 °C with 5% CO2. Cells were then washed with Hank’s
Balanced Salt solution, fixed, and processed as previously described50 with some Fixed cells imaging of QPD-OTf-treated cells. U2OS cells were grown in DMEM
differences. Following dehydration, the MatTek™ glass coverslips were lifted out by medium + 10% FBS to 50% confluency on 12-mm-glass slides (seeded the day
partially dissolving the plastic using propylene oxide. Glass coverslips were then prior). Cells were treated for 24 h with QPD-OTf (20 μM). After 24 h, cells were
washed with 100% ethanol, the samples were then infiltrated with consecutively fixed with MeOH fixation at −20 °C for 5 min. Then the coverslips were washed for
increasing concentrations of Durcupan ACM in ethanol (25:75 for 1.5 h, 50:50 for 30 min in PBS. Primary antibody staining was performed with 1:1000 dilution of
1.5 h, 75:25 overnight). The following day the glass coverslips were immersed in DM1-alpha raised in mouse (T6199) and 1:1000 phalloidin raised in rabbit for 1 h.
100% Durcupan ACM for 1 h, after which the resin was replaced with fresh Coverslips were washed in PBS for 30 min. Secondary antibody staining was per-
Durcupan ACM. This was repeated four to five times. Excess Durcupan was formed with 1:400 dilution of anti-mouse ALEXA-488 and 1:400 dilution of 1:400
removed using filter paper, after which the glass coverslips were heated in an oven anti-rabbit ALEXA-568. Coverslips were washed in PBS for 30 min. Then cover-
for 10 min at 60 °C. In order to ensure a thin resin layer, the glass coverslips were slips were placed over DABCO mounting medium containing DAPI and imaged
centrifuged for 15 min at 37 °C and 750 RCF by placing the coverslips vertically in with an LSM700 microscope.
folded filter paper inside 50 mL Falcon tubes. The samples were then placed in an
oven to polymerize at 60° under vacuum for 2 days. The coverslips were then
prepared for FIB-SEM by first sputter coating with 50 nm gold, painted with silver MTs stabilization with Taxol in live U2OS cells. U2OS cells (2 × 10⁵) were
paint, and dried under vacuum. seeded into 3.5-cm-glass bottom dishes with 10 mm microwell (Mattek); cells were
incubated in McCoy’s 5A medium at 37 °C under 5% CO2 in a humidified incu-
bator for 24 h. Then media was removed, cells were washed twice with DMEM (−)
FIB-SEM. Data sets were acquired using a Zeiss Crossbeam 540 (Carl Zeiss (no additives), Taxol (1 µM) was added to cells in DMEM (−) (no additives) and
Microscopy GmbH, Jena, Germany). Platinum and Carbon was deposited over the cells were incubated at 37 °C under 5% CO2 for 1 h. QPD-OTf (20 µM) was then
region of interest and the run was set up and controlled by Atlas5 software (Fibics) added and cells were incubated at 37 °C under 5% CO2 for 4 h. Cells were imaged
SEM settings: 1.5 kV; 2.5 nA; Milling probe: 300 pA. The Slice thickness and the with a ×20 objective on an EVOS XL Core.
voxel size was set to 5 nm. The total volume acquired was: 16.36 × 9.87 × 7.31 μm
(XYZ) and 23.5 × 9.60 × 7.47 μm (XYZ).
MTs depolymerization on ice in live U2OS cells. U2OS cells (2 × 10⁵) were
seeded into 3.5-cm-glass bottom dishes with 10 mm microwell (Mattek); cells were
FIB-SEM data analysis, segmentation, and rendering. The FIB-SEM data sets incubated in McCoy’s 5A medium at 37 °C under 5% CO2 in a humidified incu-
were aligned using Atlas5 software (Fibics). Data were then imported into Fiji bator for 24 h. Then media was removed, cells were washed twice with DMEM (−)
software2 and binned 3×, to 15 × 15 × 15 nm isotropic voxels. Segmentation of (no additives) and put on ice for 1 h. QPD-OTf (20 µM) was then added and cells
structures of interest was performed using the Pixel Classification module in the were incubated on ice for 4 h. Cells were imaged with a ×20 objective on an EVOS
Ilastik software package (Ilastik.org)3. The probability maps were then imported XL Core. Control cells were washed with DMEM (−) (no additives) and incubated
into Imaris (Bitplane.com) and surfaces were generated around fully segmented with QPD-OTf (20 µM) at 37 °C under 5% CO2 for 4 h.
8 NATURE COMMUNICATIONS | (2021)12:1463 | https://doi.org/10.1038/s41467-021-21626-1 | www.nature.com/naturecommunicationsNATURE COMMUNICATIONS | https://doi.org/10.1038/s41467-021-21626-1 ARTICLE
Transient transfection with mCherry-Giantin plasmid. U2OS or PTK2-GFP- Molecular docking. Docking calculations were performed with Autodock4 Vina.
Tubulin cells (1.5 × 10⁵) were seeded into 3.5 cm glass bottom dishes with 10 mm Receptor (PDB structure: 3J8Y for kinesin-1, 4AP0 for Eg5) and ligand preparation
microwell (Mattek); cells were incubated in a culture medium at 37 °C under 5% were performed in AutodockTools1.5.6. Results were displayed with PyMOL2.
CO2 in a humidified incubator for 24 h. pSF-mCherry-SNAP-Giantin plasmid
(kind gift of Riezman’s lab; University of Geneva, Switzerland) was transfected with
Statistics and reproducibility. All microscopy experiments were repeated at least
FugeneHD reagent in Optimem (100 µL); cells were incubated at 37 °C under 5%
three times with similar results.
CO2 for 24 h. Cells were washed twice with DMEM (−) (no additives) and QPD-
OTf (20 µM) was added to cells in DMEM (−) (no additives). Cells were incubated
at 37 °C under 5% CO2 for 3 h. Cells were washed twice with DMEM (−) and Reporting summary. Further information on research design is available in the Nature
imaged with a LEICA SP8 microscope. Research Reporting Summary linked to this article.
Brefeldin A treatment in live U2OS cells. U2OS cells (2 × 10⁵) were seeded into Data availability
3.5 cm glass bottom dishes with 10 mm microwell (Mattek); cells were incubated in The authors declare that all data supporting the findings of this study are available within
McCoy’s 5A medium at 37 °C under 5% CO2 in a humidified incubator overnight. the article and its supplementary information files. Source data are provided with this
Then media was removed, cells were washed twice with DMEM (−) (no additives), paper. The data sets generated during and/or analyzed during the current study, together
Brefeldin A (20 µM) was added to cells in DMEM (−) (no additives) and cells were with the Source Data have been deposited in the Zenodo repository (https://doi.org/
incubated at 37 °C under 5% CO2 for 4 h. Then media was replaced with fresh one 10.5281/zenodo.4461867).
containing Brefeldin A (20 µM) and QPD-OTf (20 µM) and cells were incubated at
37 °C under 5% CO2 for 2.5 h. Cells were washed twice with DMEM (−) and
imaged with a LEICA SP8 microscope. The same protocol was used for cells Code availability
transfected with mCherry-Giantin plasmid. The codes generated during the current study have been deposited in the Zenodo
repository (https://doi.org/10.5281/zenodo.4461867) Autodock4 Vina is an open-source
program for molecular docking designed and implemented by Dr. Oleg Trott in the
Kinesore + QPD-OTf treatment in live cells. U2OS or PTK2-GFP-Tubulin cells Molecular Graphics Lab at The Scripps Research Institute.
(1.5 × 10⁵) were seeded into 3.5-cm-glass bottom dishes with 10 mm microwell
(Mattek); cells were incubated in a culture medium at 37 °C under 5% CO2 in a
humidified incubator for 24 h. Then media was removed, cells were washed twice Received: 29 July 2020; Accepted: 3 February 2021;
with DMEM (−) (no additives), Kinesore (100 µM) + QPD-OTf (20 µM) were
then added to cells in Ringer’s buffer and cells were incubated at 37 °C under 0%
CO2 for (1.5 h for PTK2; 2 h for U2OS). Cells were imaged with a LEICA SP8.
Kinesore treatment in live cells. U2OS cells (1.5 × 10⁵) were seeded into 3.5-cm-
glass bottom dishes with 10 mm microwell (Mattek); cells were incubated in a References
culture medium at 37 °C under 5% CO2 in a humidified incubator for 24 h. Then 1. Schatten, H. The mammalian centrosome and its functional significance.
media was removed, cells were washed twice with DMEM (−) (no additives), Histochem. Cell Biol. 129, 667–686 (2008).
Kinesore (100 µM) was added to cells in Ringer’s buffer and cells were incubated at 2. Chabin-Brion, K. et al. The Golgi complex is a microtubule-organizing
37 °C under 0% CO2 for 1.5 h. Cells were imaged with a LEICA SP8. organelle. Mol. Biol. Cell 12, 2047–2060 (2001).
3. Alberts, B. et al. Molecular Biology of the Cell 4th edn (2002).
4. Woehlke, G. & Schliwa, M. Directional motility of kinesin motor proteins.
Transient transfection with Kin330-GFP/Kin560-GFP. U2OS cells (1.5 × 10⁵) Biochim. Biophys. Acta Mol. Cell Res. 1496, 117–127 (2000).
were seeded into 3.5-cm-glass bottom dishes with 10 mm microwell (MatTek); cells 5. Lippincottschwartz, J., Cole, N. B., Marotta, A., Conrad, P. A. & Bloom, G. S.
were incubated in a culture medium at 37 °C under 5% CO2 in a humidified
Kinesin is the motor for microtubule-mediated Golgi-to-Er membrane traffic.
incubator for 24 h. Kin330-GFP or Kin560-GFP plasmid was transfected with
J. Cell Biol. 128, 293–306 (1995).
FugeneHD reagent in Opti-Mem (100 µL); cells were incubated at 37 °C under 5%
6. Gupta, V., Palmer, K. J., Spence, P., Hudson, A. & Stephens, D. J. Kinesin-1
CO2 for 24 h. Cells were washed twice with DMEM (−) (no additives) and QPD-
(uKHC/KIF5B) is required for bidirectional motility of ER exit sites and
OTf (20 µM) was added to cells in DMEM (−) (no additives). Cells were incubated
at 37 °C under 5% CO2 for 3 h. Cells were washed twice with DMEM (−) and efficient ER-to-Golgi transport. Traffic 9, 1850–1866 (2008).
imaged with a LEICA SP8 microscope. 7. Block, S. M., Goldstein, L. S. & Schnapp, B. J. Bead movement by single
kinesin molecules studied with optical tweezers. Nature 348, 348–352 (1990).
8. Hancock, W. O. & Howard, J. Processivity of the motor protein kinesin
Kinesin-1 knockdown. HeLa-GFP-Tubulin cells (7.5 × 10⁴) were seeded into 6 well requires two heads. J. Cell. Biol. 140, 1395–1405 (1998).
plates; cells were incubated in a culture medium at 37 °C under 5% CO2 in a 9. Friedman, D. S. & Vale, R. D. Single-molecule analysis of kinesin motility
humidified incubator overnight. Then media was replaced with a fresh one and reveals regulation by the cargo-binding tail domain. Nat. Cell Biol. 1, 293–297
cells were transfected with AllStars Negative Control siRNA or with a combination (1999).
of four siRNA duplexes against Kif5B subunit of kinesin-1 (GeneSolution siRNA, 10. Thorn, K. S., Ubersax, J. A. & Vale, R. D. Engineering the processive run
Qiagen) at a final concentration of 10 nM in Lipofectamine RNAiMAX. Cells were length of the kinesin motor. J. Cell Biol. 151, 1093–1100 (2000).
incubated at 37 °C under 5% CO2 in a humidified incubator for 72 h. Cells were 11. Cai, D. W., McEwen, D. P., Martens, J. R., Meyhofer, E. & Verhey, K. J. Single
washed with DMEM (−) (no additives), incubated with QPD-OTf (20 µM), and molecule imaging reveals differences in microtubule track selection between
imaged after 2 h. kinesin motors. PLoS Biol. 7, e1000216 (2009).
12. Reed, N. A. et al. Microtubule acetylation promotes kinesin-1 binding and
In vitro precipitation of QPD. 20 µM QPD was precipitated in Eppendorf tubes at transport. Curr. Biol. 16, 2166–2172 (2006).
room temperature for 6 h in BRB80 in presence of different combinations of 13. Dunn, S. et al. Differential trafficking of Kif5c on tyrosinated and
unlabeled 14 µM tubulin, 150 nM kinesin-1, 2.7 mM AMP-PNP, 2.7 mM ATP, 1 detyrosinated microtubules in live cells. J. Cell Sci. 121, 1085–1095 (2008).
mM GTP. Samples were visualized under a 366 nm lamp. The content of samples 14. LaPointe, N. E. et al. Effects of eribulin, vincristine, paclitaxel and ixabepilone
containing fluorescent precipitate was imaged by a LEICA SP8 microscope. on fast axonal transport and kinesin-1 driven microtubule gliding:
Implications for chemotherapy-induced peripheral neuropathy. Neurotoxicol
37, 231–239 (2013).
Western blot. To HeLa-GFP-Tubulin transfected with siRNA was added lysis 15. Courty, S., Luccardini, C., Bellaiche, Y., Cappello, G. & Dahan, M. Tracking
buffer and cells were let 5 min on ice before being scraped. The cell lysate was individual kinesin motors in living cells using single quantum-dot imaging.
transferred into Eppendorf tubes and incubated on ice for 30 min, and then cen- Nano Lett. 6, 1491–1495 (2006).
trifuged at 14,000×g at 4 °C for 20 min. An aliquot of the supernatant was mixed
16. Pfister, K. K., Wagner, M. C., Stenoien, D. L., Brady, S. T. & Bloom, G. S.
with Laemli buffer (5×) and loaded on 8% acrylamide gel. Proteins were transferred
Monoclonal antibodies to kinesin heavy and light chains stain vesicle-like
onto PVDF membrane and blocked in 5% BDA in TBST buffer for 1 h at r.t. The
structures, but not microtubules, in cultured cells. J. Cell Biol. 108, 1453–1463
membrane was incubated with anti-UKHC (kinesin) primary antibody (1: 1000) or
(1989).
anti-α-tubulin primary antibody (1:1000) in 5% dehydrated milk in TBST buffer at
17. Endow, S. A. in Kinesin Protocols (ed. Vernos, I.) 123–131 (2001).
4 °C overnight. The membrane was washed with TBST buffer (3 × 10 min) and
incubated with secondary HRP antibody (1:10,000) in 5% dehydrated milk in TBST 18. Tanenbaum, M. E., Gilbert, L. A., Qi, L. S., Weissman, J. S. & Vale, R. D. A
buffer for 1 h at r.t. The membrane was washed with TBST buffer (3 × 10 min). The protein-tagging system for signal amplification in gene expression and
membrane was then rinsed several times with a mixture of peroxide/luminol fluorescence imaging. Cell 159, 635–646 (2014).
solution and the chemiluminescent signal was acquired. The uncropped version of 19. Tas, R. P. et al. Differentiation between oppositely oriented microtubules
the blots is provided in the Source Data file. controls polarized neuronal transport. Neuron 96, 1264–1271 (2017).
NATURE COMMUNICATIONS | (2021)12:1463 | https://doi.org/10.1038/s41467-021-21626-1 | www.nature.com/naturecommunications 9ARTICLE NATURE COMMUNICATIONS | https://doi.org/10.1038/s41467-021-21626-1
20. Katrukha, E. A. et al. Probing cytoskeletal modulation of passive and active 46. Luo, L. et al. ATP-competitive inhibitors of the mitotic kinesin KSP that
intracellular dynamics using nanobody-functionalized quantum dots. Nat. function via an allosteric mechanism. Nat. Chem. Biol. 3, 722–726 (2007).
Commun. 8, 14772 (2017). 47. Castillo, A. & Justice, M. J. The kinesin related motor protein, Eg5, is essential
21. Hollenbeck, P. J. The distribution, abundance and subcellular-localization of for maintenance of pre-implantation embryogenesis. Biochem. Biophys. Res.
kinesin. J. Cell Biol. 108, 2335–2342 (1989). Commun. 357, 694–699 (2007).
22. Naleway, J. J. et al. Synthesis and use of new fluorogenic precipitating 48. Wojcik, E. J. et al. Kinesin-5: cross-bridging mechanism to targeted clinical
substrates. Tetrahedron Lett. 35, 8569–8572 (1994). therapy. Gene 531, 133–149 (2013).
23. Diwu, Z. et al. Fluorescent molecular probes I. The synthesis and biological 49. Chyan, W. & Raines, R. T. Enzyme-activated fluorogenic probes for live-cell
properties of an ELF® β-glucuronidase substrate that yields fluorescent and in vivo imaging. ACS Chem. Biol. 13, 1810–1823 (2018).
precipitates at the enzymatic activity sites. Tetrahedron 53, 7159–7164 (1997). 50. Bleck, C. K. E., Kim, Y., Willingham, T. B. & Glancy, B. Subcellular
24. Paragas, V. B., Kramer, J. A., Fox, C., Haugland, R. P. & Singer, V. L. The connectomic analyses of energy networks in striated muscle. Nat. Commun. 9,
ELF®-97 phosphatase substrate provides a sensitive, photostable method for 5111 (2018).
labelling cytological targets. J. Microsc. 206, 106–119 (2002).
25. Thorn-Seshold, O., Vargas-Sanchez, M., McKeon, S. & Hasserodt, J. A robust,
high-sensitivity stealth probe for peptidases. Chem. Commun. 48, 6253–6255 Acknowledgements
(2012). We thank Howard Riezman’s group for providing the mCherry-Giantin plasmid. We
26. Lindberg, E. & Winssinger, N. High spatial resolution imaging of endogenous thank Paul Guichard’s group for providing useful reagents and for constructive criticism
hydrogen peroxide in living cells by solid-state fluorescence. ChemBioChem of the manuscript. We thank the BioImaging Centre of the University of Geneva and
17, 1612–1615 (2016). ACCESS for technical assistance with super-resolution imaging. This work was sup-
27. Sadhu, K. K., Lindberg, E. & Winssinger, N. In cellulo protein labelling with ported by the NCCR chemical biology and the Department de l’instruction publique
Ru-conjugate for luminescence imaging and bioorthogonal photocatalysis. (DIP), Geneva.
Chem. Commun. 51, 16664–16666 (2015).
28. Anzola, M. & Winssinger, N. Turn on of a ruthenium(II) photocatalyst by Author contributions
DNA-templated ligation. Chem. Eur. J. 25, 334–342 (2019). E.L. discovered QPD-OTf and performed initial experiments in cellulo. S.A. performed
29. Heller, A. & Williams, D. L. Intramolecular proton transfer reactions in or contributed to all experiments. E.L. and C.B. performed FIB-SEM experiments. N.K.
excited fluorescent compounds. J. Phys. Chem. 74, 4473–4480 (1970). performed immunostaining experiments. C.A. performed TIRF microscopy and in vitro
30. Hu, J. J. et al. Fluorescent probe HKSOX-1 for imaging and detection of experiments. S.A., E.L., N.K., C.A., and N.W. designed experiments. N.W. and C.A.
endogenous superoxide in live cells and in vivo. J. Am. Chem. Soc. 137, supervised the project. S.A., C.A., and N.W. wrote the paper. All the authors discussed
6837–6843 (2015). and commented on the manuscript.
31. Lukinavicius, G. et al. Fluorogenic probes for live-cell imaging of the
cytoskeleton. Nat. Meth. 11, 731–768 (2014).
32. Sanders, A. A. W. M. & Kaverina, I. Nucleation and dynamics of golgi-derived Competing interests
microtubules. Front. Neurosci. 9, 431 (2015). The authors declare no competing interests.
33. Arvan, P., Zhao, X., Ramos-Castaneda, J. & Chang, A. Secretory pathway
quality control operating in golgi, plasmalemmal, and endosomal systems.
Traffic 3, 771–780 (2002).
Additional information
Supplementary information The online version contains supplementary material
34. Fujiwara, T., Oda, K., Yokota, S., Takatsuki, A. & Ikehara, Y. Brefeldin-a causes
available at https://doi.org/10.1038/s41467-021-21626-1.
disassembly of the Golgi-complex and accumulation of secretory proteins in the
endoplasmic-reticulum. J. Biol. Chem. 263, 18545–18552 (1988).
Correspondence and requests for materials should be addressed to C.A. or N.W.
35. Lippincott-Schwartz, J., Yuan, L. C., Bonifacino, J. S. & Klausner, R. D. Rapid
redistribution of Golgi proteins into the ER in cells treated with brefeldin A:
Peer review information Nature Communications thanks the anonymous reviewer(s) for
evidence for membrane cycling from Golgi to ER. Cell 56, 801–813 (1989).
their contribution to the peer review of this work. Peer reviewer reports are available.
36. Inoue, Y. et al. Movements of truncated kinesin fragments with a short or an
artificial flexible neck. Biophys. J. 72, Mp211–Mp211 (1997).
Reprints and permission information is available at http://www.nature.com/reprints
37. Romberg, L., Pierce, D. W. & Vale, R. D. Role of the kinesin neck region in
processive microtubule-based motility. J. Cell Biol. 140, 1407–1416 (1998).
Publisher’s note Springer Nature remains neutral with regard to jurisdictional claims in
38. Schepis, A., Stauber, T. & Locker, J. K. Kinesin-1 plays multiple roles during
published maps and institutional affiliations.
the vaccinia virus life cycle. Cell Microbiol. 9, 1960–1973 (2007).
39. Randall, T. S. et al. A small-molecule activator of kinesin-1 drives remodeling of
the microtubule network. Proc. Natl Acad. Sci. USA 114, 13738–13743 (2017).
40. Cockburn, J. J. B. et al. Insights into Kinesin-1 activation from the crystal Open Access This article is licensed under a Creative Commons
structure of KLC2 bound to JIP3. Structure 26, 1486–1498.e1486 (2018). Attribution 4.0 International License, which permits use, sharing,
41. Verhey, K. J. & Hammond, J. W. Traffic control: regulation of kinesin motors. adaptation, distribution and reproduction in any medium or format, as long as you give
Nat. Rev. Mol. Cell Biol. 10, 765–777 (2009). appropriate credit to the original author(s) and the source, provide a link to the Creative
42. Vugmeyster, Y., Berliner, E. & Gelles, J. Release of isolated single kinesin Commons license, and indicate if changes were made. The images or other third party
molecules from microtubules. Biochemistry 37, 747–757 (1998). material in this article are included in the article’s Creative Commons license, unless
43. Hancock, W. O. & Howard, J. Kinesin’s processivity results from mechanical indicated otherwise in a credit line to the material. If material is not included in the
and chemical coordination between the ATP hydrolysis cycles of the two article’s Creative Commons license and your intended use is not permitted by statutory
motor domains. Proc. Natl Acad. Sci. USA 96, 13147–13152 (1999). regulation or exceeds the permitted use, you will need to obtain permission directly from
44. Cross, R. A. Mechanochemistry of the Kinesin-1 ATPase. Biopolymers 105, the copyright holder. To view a copy of this license, visit http://creativecommons.org/
476–482 (2016). licenses/by/4.0/.
45. Trott, O. & Olson, A. J. Software news and update autodock vina: improving
the speed and accuracy of docking with a new scoring function, efficient
optimization, and multithreading. J. Computat. Chem. 31, 455–461 (2010). © The Author(s) 2021
10 NATURE COMMUNICATIONS | (2021)12:1463 | https://doi.org/10.1038/s41467-021-21626-1 | www.nature.com/naturecommunicationsYou can also read