JOURNAL OF ASFMRA - online donation form
←
→
Page content transcription
If your browser does not render page correctly, please read the page content below
JOURNAL
OF ASFMRA

    2021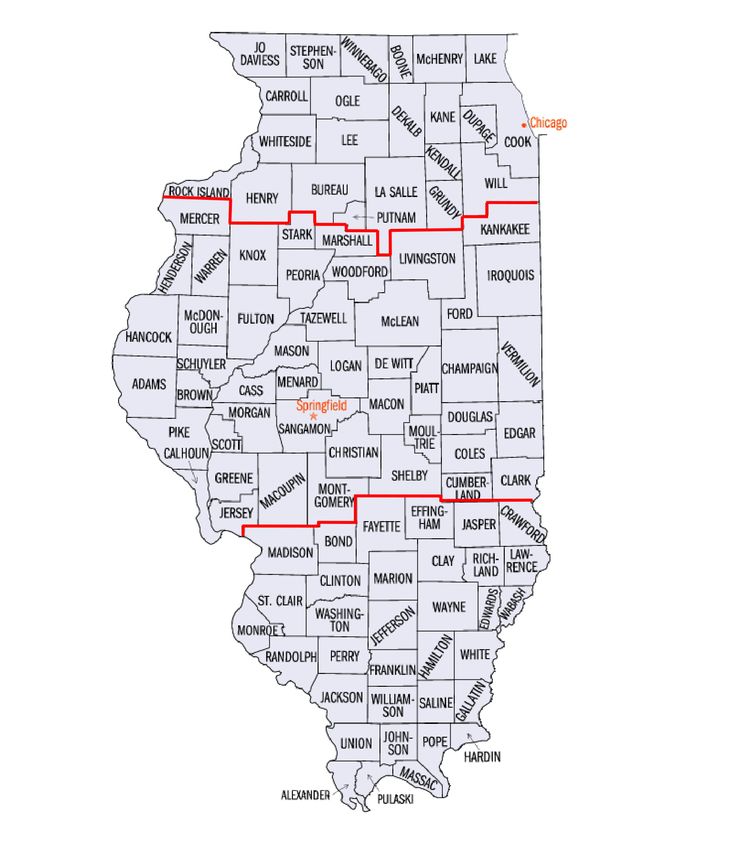
Letter from the ASFMRA President

                           Dear ASFMRA Members and Friends of Agriculture:
                           The American Society of Farm Managers and Rural Appraisers is proud to present its
                           2021 Journal of ASFMRA.

                           The 2021 Journal contains the most up-to-date collection of rural appraisal, agricultural
                           consulting, and farm management topics available in the world. In the following pages
                           you will find cutting-edge manuscripts documenting research, field studies, practices,
                           and methodologies proposed by the leading academic, appraisal, consulting, and
                           management leaders of agriculture. This edition of the Journal continues to provide our
                           membership and the agri-business community with topics on newly evolved issues and
                           concepts for your review and consideration.

DENNIS                     Despite a year heavily impacted by the COVID-19 pandemic, 10 papers were reviewed
REYMAN,                    and accepted for publication in the Journal by the ASFMRA’s Editorial Committee.
                           The Editorial Committee worked with the authors to ensure that each article was
AFM, ARA                   informative, clear, and precise in the presentation of data and conclusions, as well as
                           consistent with Society goals.
2020-21 ASFMRA President
                           The Editorial Committee and ASFMRA continue their challenge to all readers to join
                           our highly acclaimed group of published authors. Share some of your experiences and
                           wisdom! Most of us have encountered at least one unusual problem or situation that
                           required original and innovative thinking to develop workable solutions. If it was new
                           for you, chances are it will be interesting and usable by others.

                           Thank you all for your continued interest in the ASFMRA, agriculture, and the entire
                           agricultural community.

                           Dennis Reyman, AFM, ARA
                           2020-21 ASFMRA President

                                                              2
                                               A S F M R A 20 2 1 J O U R N A L
Thank You to the 2020–21
Editorial Committee
COMMITTEE
                          Committee Members
CHAIR
                          Jim Jansen, AFM, AAC                        Daniel Peery, ARA
Gregory Ibendahl, Ph.D.
                          University of Nebraska-Lincoln              Agriculture & Industry, LLC
Kansas State University
                          jjansen4@unl.edu                            dan@agindustry.land
ibendahl@ksu.edu
                          Simon Jette Nantel, Ph.D.                   Alejandro Plastina, Ph.D.
                          University of Wisconsin-                    Iowa State University
                          River Falls                                 plastina@iastate.edu
OFFICER
                          simon.jettenantel@uwrf.edu
LIAISON                                                               Nathan Thompson, Ph.D.
                          Notie Lansford, Jr., Ph.D.                  Purdue University
Tyler Mark, Ph.D.
                          Oklahoma State University                   thomp530@purdue.edu
University of Kentucky
                          notie.lansford@okstate.edu
tyler.mark@uky.edu                                                    William J. Thompson, AFM
                          James Libbin, Ph.D.                         Texas A&M University (retired)
                          New Mexico State University                 thompsonsintx@gmail.com
                          jlibbin@nmsu.edu
                                                                      Wendong Zhang, Ph.D.
                          Ward Nefstead, Ph.D.                        Iowa State University
                          University of Minnesota                     wdzhang@iastate.edu
                          nefst002@umn.edu

                                                  3
                                   A S F M R A 20 2 1 J O U R N A L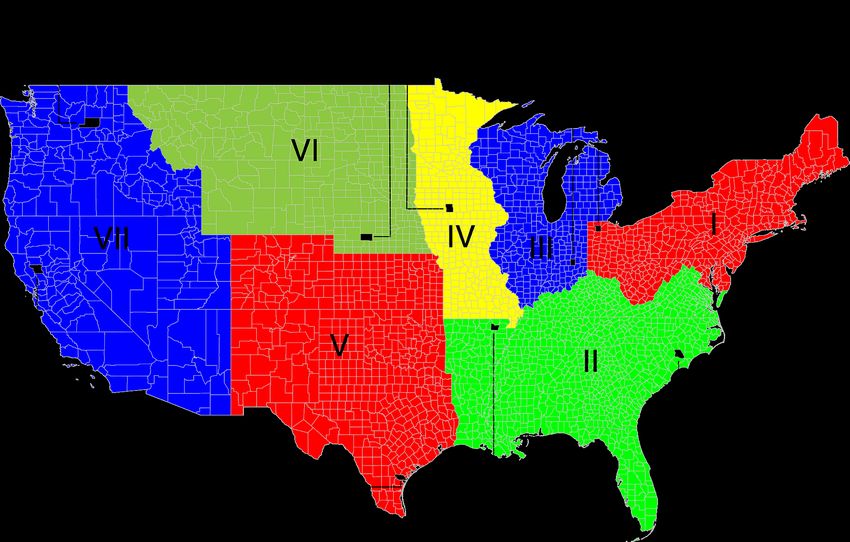
Table of Contents
Factors Influencing Increased Usage of Cash Rent Leases in Illinois . . . . . . . . . . . . . . . . . . . . . . .                                            6
By Jacob Styan, Maria A. Boerngen, and Michael J. Barrowclough
The authors examine the impact of multiple factors on farmland leasing choices.

Irrigated Acreage Change and Groundwater Status in Eastern Arkansas  . . . . . . . . . . . . . . . . .                                                       17
By Tej K. Gautam and K. Bradley Watkins
This study provides a comparative status of eastern Arkansas major crops acreage and
groundwater over the past Census of Agriculture periods.

Farm Management Instructors Expect More Farm Transitions in Coming Years  . . . . . . . . . .                                                                29
By Megan L. Roberts
This study quantifies farm business transition within the Minnesota State Farm Business
Management (FBM) education program.

Evaluating the New Agriculture Risk Coverage and Price Loss Coverage
Elections for the 2021 Crop Year . . . . . . . . . . . . . . . . . . . . . . . . . . . . . . . . . . . . . . . . . . . . . . . . . . . . . . . . . . . . .   35
By Bart L. Fischer, J. Marc Raulston, Henry L. Bryant, and Joe L. Outlaw
The authors analyze the enrollment decision on several representative farms across the
United States between the Agriculture Risk Coverage (ARC) and Price Loss
Coverage (PLC) programs.

Cost Cutting Strategies for Midwestern Row Crop Producers . . . . . . . . . . . . . . . . . . . . . . . . . . . . . .                                        45
By Sarah C. Sellars, Laura F. Gentry, Krista J. Swanson, Nicholas D. Paulson,
and Gary D. Schnitkey
This article uses farm- and field-level data from Illinois to examine approaches other than
reduction in land cost to reduce costs and improve returns.

Machinery Replacement Strategies . . . . . . . . . . . . . . . . . . . . . . . . . . . . . . . . . . . . . . . . . . . . . . . . . . . . . . . . .           55
By Gregory Ibendahl and Terry W. Griffin
The authors test the hypothesis that farmers manage their machinery purchases in order to
minimize cash flow variability.

Transferring Farm Assets to a Younger Generation . . . . . . . . . . . . . . . . . . . . . . . . . . . . . . . . . . . . . . . . .                           59
By Michael Langemeier
The author explores options pertaining to the transfer of farm assets from an older
generation to a younger generation, using a case farm example.

Examining Differences in Risk Adjusted Returns Among Farms . . . . . . . . . . . . . . . . . . . . . . . . . . .                                             66
By Michael Langemeier and Elizabeth Yeager
This study examines differences in risk adjusted returns among Kansas farms using data from
1996 to 2018 in order to benchmark long-run financial performance.

                                                                                  4
                                                                   A S F M R A 20 2 1 J O U R N A L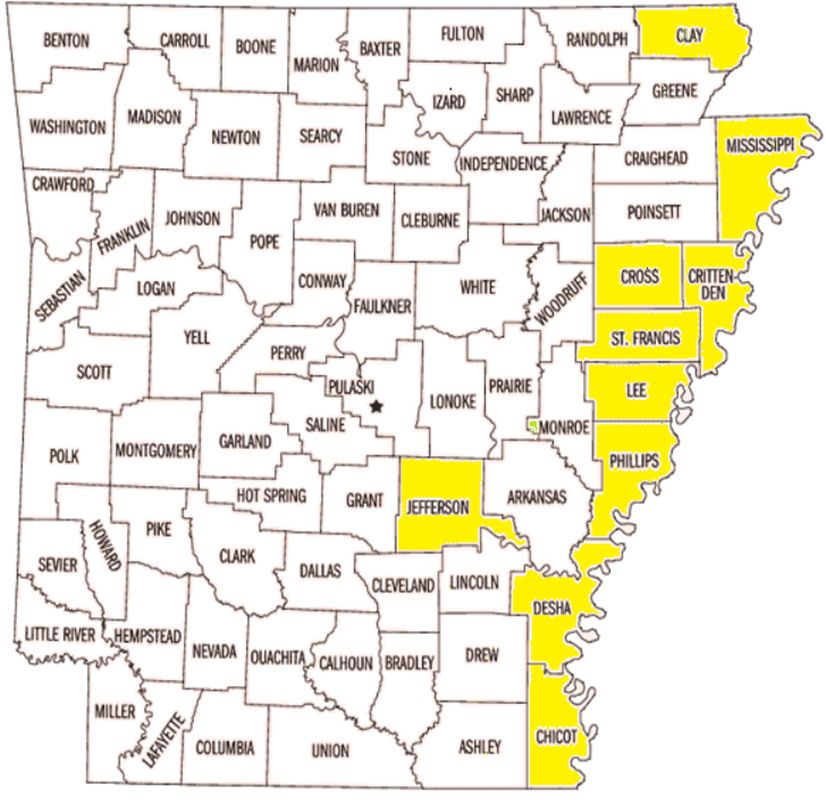
Table of Contents
Continued

Converting Texas Land from Agricultural to Wildlife Use Tax Valuation .  .  .  .  .  .  .  .  .  .  .  .  .  .  .  .  .  .  .                                                                                                                                     71
By Justin R. Benavidez, Tiffany Dowell-Lashmet, David P. Anderson,
and Kasey Ullrich
This paper examines trends in land valuation categorization and its potential impact
on agricultural production.

Downy Mildew Impacts and Control Measures on Cucurbits in the
United States .  .  .  .  .  .  .  .  .  .  .  .  .  .  .  .  .  .  .  .  .  .  .  .  .  .  .  .  .  .  .  .  .  .  .  .  .  .  .  .  .  .  .  .  .  .  .  .  .  .  .  .  .  .  .  .  .  .  .  .  .  .  .  .  .  .  .  .  .  .  .  .  .  .  .  .  .  .  .  .  .   78
By Ramu Govindasamy, Surendran Arumugam, Qun Gao, Mary Hausbeck,
C. Andrew Wyenandt, and James E. Simon
This study describes the impact of downy mildew in high-value cucurbit crops grown in
the United States.

                                                                                                                                        5
                                                                                                                A S F M R A 20 2 1 J O U R N A L
Factors Influencing Increased Usage of Cash
Rent Leases in Illinois
                                                                    expenditures, and commodity payments
                                                                    have influenced the increasing use of cash
                                                                    rent leases.

By Jacob Styan, Maria A. Boerngen,
                                                                    INTRODUCTION
and Michael J. Barrowclough                                         Over the past two decades, Illinois has experienced a
Jacob Styan is a Product Specialist at Illinois Foundation          dramatic increase in the use of cash rent leases. From
Seed, Inc. Maria A. Boerngen is an Assistant Professor              1995 to 2015, the proportion of acres operated under
of Agribusiness at Illinois State University. Michael J.            cash rent leases increased from 41% to 59% (a 44% rise)
Barrowclough is an Assistant Professor of Agribusiness              in northern Illinois, 18% to 39% (a 117% rise) in central
at Illinois State University.                                       Illinois, and 20% to 41% (a 105% rise) in southern Illinois,
                                                                    among farms enrolled in the Illinois Farm Business
                                                                    Farm Management (FBFM) Association. Share rent
                                                                    acres fell from 42% to 21% in northern Illinois, 68% to
                                                                    46% in central Illinois, and 58% to 37% in southern
Abstract
                                                                    Illinois, with the proportion of owner-operated acres
                                                                    remaining relatively consistent through the same time
In recent years, cash rent leases have
                                                                    period (Lattz, 2016; Lattz and Zwilling, 2020; Schnitkey,
become increasingly popular among farm                              2002; Zwilling, Krapf, and Raab, 2013). These three
                                                                    regions are illustrated in Figure 1, with their respective
landowners in Illinois. Since 1995, acres                           changes shown in Figures 2–4. Following the trend
operated under cash rent leases have                                toward greater cash rent lease usage, per-acre cash
                                                                    rent rates have also increased. From 1987 to 2014, per-
increased 44%, 105%, and 117% in northern,                          acre cash rent rates increased by an average of 3.6%
                                                                    each year. Since 2006, per-acre cash rent prices have
southern, and central Illinois, respectively, for
                                                                    increased by 7.4% annually (Schnitkey, 2017).
farms enrolled in the Illinois Farm Business
                                                                    According to the 2017 Census of Agriculture, just over
Farm Management (FBFM) Association.                                 58% of farmland in Illinois is leased, while nearly 42% is
Using data collected from the United States                         owner-operated. Nationally, 39% of all farmland acres in
                                                                    the United States are rented, with 61% owner-operated
Department of Agriculture (USDA) National                           (USDA NASS, 2017). This study aims to identify the
Agricultural Statistics Service (NASS), Illinois                    factors that may influence the shift toward increased
                                                                    use of cash rent leases in Illinois.
FBFM Association, University of Illinois
farmdoc, and Environmental Working Group                            BACKGROUND
(EWG), we examined the impact of multiple                           Under a typical cash rent agreement, the farm
factors on farmland leasing choices. Results                        operator pays the landowner a set annual fee per acre,
                                                                    furnishes all operating inputs for the crop, and receives
indicate that commodity prices, soybean                             the crop produced on the rented land. Share rent
                                                                    leases entail the landowner and operator splitting the
revenue, government crop insurance

                                                                6
                                                 A S F M R A 20 2 1 J O U R N A L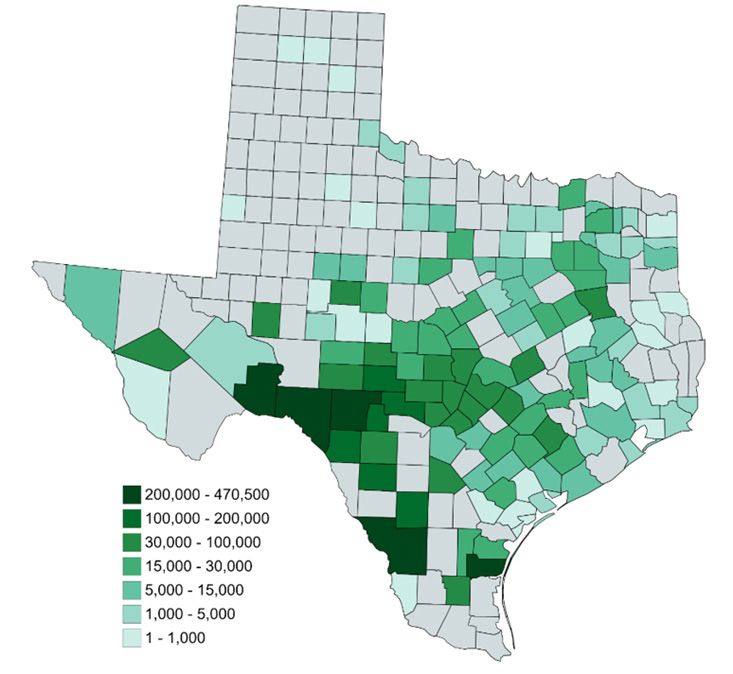
input costs, where the landowner receives a portion
                                                                     DATA
of the crop as “rent” for the farmland (Lattz, 2017a,
2017c). A 50-50 split is the most common crop share
                                                                     To identify potential factors influencing the shift toward
agreement in Illinois (Lattz, 2017b). A typical farmland
                                                                     cash rent leases that has occurred throughout Illinois
lease in Illinois begins on March 1 and expires on the
                                                                     over the past two decades, we divided the state into
last day of February. The generally accepted deadline
                                                                     three regions (northern, central, and southern) based
to terminate or make changes to a lease is four
                                                                     on standard reporting regions used by the University
months prior to the expiration date, and most leases
                                                                     of Illinois farmdoc (Figure 1). There are 22 counties in
are written to automatically renew for another year
                                                                     the northern region, 44 counties in the central region,
without change if no notification is provided by either
                                                                     and 36 counties in the southern region. We collected
the owner or operator (Troendle, 2019). In addition, the
                                                                     secondary data of potential factors affecting cash rent
lease type determines the distribution of government
                                                                     usage in Illinois from the United States Department
commodity subsidy payments between landowner
                                                                     of Agriculture (USDA) National Agricultural Statistics
and operator, based on who is “actively engaged in
                                                                     Service (NASS), Illinois FBFM Association, University of
farming.” Being actively engaged in farming requires
                                                                     Illinois farmdoc, and Environmental Working Group
an individual to provide “significant contributions to
                                                                     (EWG). Land tenure data, which includes percent
the farming operation,” with “active personal labor
                                                                     usage of cash rent leases, share rent leases, and owner-
and/or active management” required to meet the
                                                                     operated acres, was collected from the University
definition (USDA FSA, 2015, 1). Under a cash rent lease,
                                                                     of Illinois farmdoc for the years 1995–2015. This data
the farm operator receives all government commodity
                                                                     is representative of farms enrolled in FBFM, which
subsidy payments associated with the farm (Lattz,
                                                                     provides “a cooperative educational-service program
2017c). With a crop share lease, the landowner and the
                                                                     designed to assist farmers with management decision-
operator split the commodity payments according to
                                                                     making” (Illinois FBFM Association, n.d.) and currently
how the shares are defined (e.g., 50-50, one-third to
                                                                     includes more than 5,500 Illinois farms (Lattz and
two-thirds) (Leibold, 2018). Cash rent leases provide
                                                                     Zwilling, 2020). All farms in this dataset are 260 acres
autonomy to the farm operator, while shielding the
                                                                     or more and receive the majority of their income from
landowner from production risk. Share rent leases
                                                                     grain farming. While this does not include all Illinois
provide opportunity for the landowner to participate
                                                                     farms, it does provide a good framework for land tenure
in on-farm decision-making, while protecting farm
                                                                     in the state (Lattz and Zwilling, 2020).
operators from bearing all production risk.
                                                                     Potential factors influencing the shift toward cash
Previous research has addressed factors that affect
                                                                     rent leases examined in this study include commodity
farmland values and per-acre cash rent rates,
                                                                     prices and crop yields for both corn and soybeans
including corn and soybean prices, corn and soybean
                                                                     (USDA NASS, n.d.), government commodity subsidy
yields, government payments, and crop insurance
                                                                     payments (EWG, n.d.), and government expenses
(Barnard et al., 2001; Du, Hennessy, and Edwards,
                                                                     on crop insurance (EWG, n.d.). With the exception of
2007; Goodwin, Mishra, and Ortalo-Magné, 2004;
                                                                     commodity prices, all factors were collected at the
Helmers, Shaik, and Johnson, 2005; Ibendahl and
                                                                     county level in Illinois from 1995 to 2015. Yearly per-
Griffin, 2013; Kirwan, 2009; Lambert and Griffin,
                                                                     acre corn and soybean yields for each region were
2004; Lence and Mishra, 2003; Roberts, Kirwan, and
                                                                     calculated by averaging the annual yields across all
Hopkins, 2003; Ryan et al., 2001; Zhang, Zhang, and
                                                                     counties within each region. Similarly, commodity
Hart, 2018). However, the literature is scarce on factors
                                                                     subsidy payments and government expenditures
influencing the use of cash rent leases (Allen and
                                                                     on crop insurance were calculated by averaging the
Lueck, 1992; Hauger and Burton, 2015; Sotomayor,
                                                                     annual payment and expenditures across all counties
Ellinger, and Barry, 2000). In addition to identifying
                                                                     within each region. Commodity prices were collected
factors that influence farmland values and per-acre
                                                                     from the University of Illinois farmdoc and reflect the
cash rent, Sotomayor, Ellinger, and Barry (2000)
                                                                     average price that was received statewide in each
specifically examined the contract choice between
                                                                     calendar year. There was one annual observation for
cash rent and crop share leases. They found that
                                                                     each variable within each region between the years
soil productivity, tract size, non-farm income, length
                                                                     1995–2015.
of business relationship between landowner and
operator, debt-to-asset ratio, net worth, number of
landowners on the farm, and changes in revenue
were significant in choosing between cash rent and
crop share.

                                                                 7
                                                  A S F M R A 20 2 1 J O U R N A L
ANALYSIS                                                                  Model 1: Crop yields and prices:

Based on the panel nature of the dataset (i.e., multiple
number of observations over time for a given number
of variables), a fixed-effect regression model was
employed to examine potential factors influencing
cash rent usage on Illinois farms (Wooldridge, 2002).
Contradictory to cross-sectional data, panel datasets
include two types of variation that must be accounted
for: “within” and “between” variation. In this dataset,
between-region variation refers to the annual variation                   CornYield and SoybeanYield represent the average
of cash rent usage across the three regions. Within-                      corn and soybean yields, measured in bushels per
region variation refers to the variation of cash rent                     acre for region i in year t-1, respectively. CornPrice
usage occurring within each region over time. Because                     and SoybeanPrice are the average per-bushel price
unobservable factors not captured in the data could                       for each crop in year t-1. CommodityPayments and
influence the between-region variation in the dataset,                    CropInsurance represent the average amount of
there may be omitted variable bias present if a simple                    government commodity subsidy payments and
linear regression were run. Accounting for potential                      government crop insurance expenditures per county
omitted variable bias, regional dummy variables                           in region i in year t-1. Northern and Central are dummy
were created for each of the three regions. Selecting                     variables representing the northern and central region
a “base” region to compare the remaining regions                          of the state. The error term for region i in year t is
against allows for the differences that occur between                     denoted as u. As previously discussed, all explanatory
regions to be observed without issue. This removes                        variables are lagged by one year to more accurately
any between-region variation and omitted variable                         reflect the influence those variables have on contract
bias from time-invariant variables (Greene, 2003;                         choice.
Kennedy, 2003). Explanatory variables were lagged
one year due to timing differences, specifically the                      Model 2: Crop revenues:
time between when cash rent leases are signed and
when receipts are received. To avoid multicollinearity
issues, the southern region was used as the base
region, to which the northern and central region
will be compared. Analysis was conducted with IBM
SPSS Statistics 24, using the generalized linear model
(GLM) function with the univariate option to run the
fixed-effects regression model. As described in the
following sections, we ran two versions of the model.
In the first, we included corn and soybean yields and                     Model 2 includes the same lagged variables as Model 1,
prices as separate explanatory variables. Yields and                      with one change: CornRevenue and SoybeanRevenue
prices were replaced with crop revenues in the second                     replace the separate crop price and yield variables
model. Each version of the model included commodity                       to reflect the influence that per-acre revenue has on
subsidy payments and government expenditures on                           decision-making. These variables were created by
crop insurance as explanatory variables.                                  multiplying the annual price and county average yield
                                                                          for each crop. From there, an average annual county
MODELS                                                                    revenue was determined for each crop within each
                                                                          region.
In each model, the dependent variable ri,t represents the
percent of acres operated under cash rent in region i in                  RESULTS
year t where:
                                                                          Tables 1–4 provide descriptive statistics of the dataset.
    i = 1, 2, 3 (1 = northern, 2 = central, and 3 = southern)             Each table includes the minimum, maximum,
                                                                          mean, and standard deviation of the dependent and
    t = 1, 2, … , 21 (1 = 1995…21 = 2015)                                 explanatory variables. Table 1 provides a description
                                                                          for all of Illinois, while the remaining tables show the
                                                                          northern (Table 2), central (Table 3), and southern

                                                                      8
                                                       A S F M R A 20 2 1 J O U R N A L
(Table 4) regions. It is noted that the central region               (Table 1), suggesting that fluctuations of $5 million
had the highest averages for each of the explanatory                 are quite plausible. The northern region was found
variables, aside from commodity prices that reflected                to have around 15% more cash rented land (β = 15.23)
statewide averages, while the northern region                        when compared to the southern region, with cash rent
averaged the highest percentage of cash rent usage.                  usage in the central region approximately 7% lower
Tables 5 and 6 present the results for each model.                   (β = –7.34) than in the southern region. Table 5 shows
A more in-depth discussion of the model results is                   the complete results of Model 1.
included in the following sections.
                                                                     Model 2 Results
Model 1 Results                                                      Model 2 produced an R2 value of 0.917, indicating that
Model 1 produced an R of 0.934, indicating that 93%
                        2
                                                                     92% of the variation in cash rent usage is explained
of the variation in cash rent usage is explained by                  by the variation of the explanatory factors used in
the variation in the explanatory factors used in the                 the model. The impact of commodity payments and
model. It was found that corn price, soybean price,                  crop insurance remains unchanged from Model 1. In
government commodity subsidy payments, and                           addition, results from Model 2 indicate a significant
government crop insurance expenditures were all                      positive relationship between per-acre soybean
significant predictors of the usage of cash rent leases.             revenue and the usage of cash rent leases. A $1
                                                                     increase in per-acre soybean revenue is expected to
Government expenditures on crop insurance were                       bring a 0.015% increase in cash rent usage, with a $67
found to be highly significant (p < 0.001), with                     revenue increase associated with a 1% rise in cash
every $10,000 increase in expenditures leading to a                  rented acres. Historical crop budgets produced by
0.039% rise in cash rent lease usage. For example, an                farmdoc (University of Illinois, n.d.) indicate that this
additional $250,000 in government expenditures is                    type of revenue fluctuation is realistic from one crop
expected to increase cash rent usage by 1%. Putting                  year to another. Similar results to Model 1 were found
this result in context, the average annual per-county                for the northern and central regions. Table 6 shows the
government expenditure on crop insurance between                     complete results of Model 2.
1995 and 2015 was approximately $2.2 million with
a range of $330,000 to nearly $6 million (Table 1),                  IMPLICATIONS AND
suggesting that a $250,000 increase in this variable
from one year to another is not an unreasonable                      CONCLUSIONS
expectation.
                                                                     In recent decades, a major shift in land rental practices
The price of corn was found to be significant at the                 has been taking place throughout Illinois. Since 1995,
5% level (p < 0.05). However, there was an inverse                   cash rent lease usage has risen dramatically, with a
relationship between corn price and cash rent usage.                 44% increase in northern Illinois, a 105% increase in
This suggests that for every dollar increase in corn                 southern Illinois, and a 117% increase in central Illinois
price, a drop of just over 3% in cash rent usage can be              among farms enrolled in FBFM (Lattz, 2016; Lattz
expected. The positive relationship between soybean                  and Zwilling, 2020; Schnitkey, 2002; Zwilling, Krapf,
price (p < 0.05) and cash rent usage indicated that for              and Raab, 2013). The results of this study indicate that
every dollar increase in soybean price, a 1.3% rise in               government expenditures on crop insurance, corn
cash rent usage will occur in Illinois. The per-bushel               price, soybean price, soybean revenue, and commodity
corn price varied from $1.90 to $6.72, with the soybean              payments all influence cash rent lease usage in Illinois.
price ranging from $4.53 to $14.25 (Table 1), indicating             With prices, yields, and commodity payment levels
that a $1 increase in these commodity prices is                      continually changing, the effects of these fluctuations
realistic.                                                           are reflected in cash rent usage. Increases in soybean
                                                                     price, soybean revenue, commodity payments, and
The positive relationship between government                         crop insurance expenditures are associated with a
commodity subsidy payments and cash rent usage                       greater proportion of farmland acres being operated
(p < 0.10) indicates that a $10,000 increase in payments             under cash rent contracts. A rise in the value of these
will lead to a 0.002% increase in cash rent lease usage.             variables enables the farm operator to pay a higher
For every $5 million of commodity payments paid out,                 per-acre cash rent, allowing the landowner to earn a
a 1% rise in cash rent usage is expected to occur. The               greater return on his or her farmland. The cash rent
average level of per-county government payments                      contract then protects the landowner from production
during the years of this study was approximately $7.16               and financial risk associated with active engagement
million, with a range of $1.8 million to nearly $24 million          in farming, making this a “win-win” for the landowner.

                                                                 9
                                                  A S F M R A 20 2 1 J O U R N A L
However, it seems counterintuitive that increased corn                         American Society of Farm Managers and Rural Appraisers 68:
                                                                               77–84.
prices are associated with a lower usage of cash rent
acres. This may be explained in part by the correlation                        Ibendahl, G., and T. Griffin. 2013. “The Connection Between Cash
                                                                               Rents and Land Values.” Journal of the American Society of Farm
between high corn prices and high nitrogen fertilizer
                                                                               Managers and Rural Appraisers 76: 239–247.
prices, which keeps farm operators’ profit margins
                                                                               Illinois FBFM Association. n.d. “Who We Are.” Accessed March 4,
thin and increases their financial risk, perhaps making
                                                                               2020. http://www.fbfm.org/who.asp.
share rent leases a more attractive option than cash
                                                                               Kennedy, P. 2003. A Guide to Econometrics. 5th ed. Cambridge:
rent when the price of corn rises.
                                                                               MIT Press.

                                                                               Kirwan, B.E. 2009. “The Incidence of U.S. Agricultural Subsidies
Changes in commodity payment structure or types
                                                                               on Farmland Rental Rates.” Journal of Political Economy 117 (1):
could have a major effect on cash rent usage. Similarly,                       138–164.
changes in the structure or type of government
                                                                               Lambert, D.M., and T.W. Griffin. 2004. “Analysis of government
expenditures on crop insurance could possibly lead                             farm subsidies on farmland cash rental rates using a fixed effect
to large increases in cash rent usage. While only                              spatial distributed lag model and a translog cost model.” Paper
                                                                               presented at the American Agricultural Economics Association,
5,500 Illinois farms were examined in this study, these
                                                                               Denver, Colorado, 2004. https://ageconsearch.umn.edu/
findings are a starting point for understanding why                            record/19977/?ln=en.
the usage of cash rent leases is increasing in Illinois.
                                                                               Lattz, D. 2016. “Tenure Characteristics of Illinois Farmland.”
With the majority of farmland in the state falling under                       Accessed December 10, 2018. https://farmdocdaily.illinois.edu/
some type of rental agreement, understanding what                              2016/10/tenure-characteristics-of-illinois-farmland.html.
is driving the change toward a greater use of cash                             Lattz, D. 2017a. “Cash Rent Leases.” Accessed November 28, 2019.
rent leases can help farm operators as well as farm                            https://farmdoc.illinois.edu/handbook/cash-rent-leasing-fact-
                                                                               sheet.
landowners and the professional farm managers
representing them in the process of negotiating rental                         Lattz, D. 2017b “Crop Share Leases.” Accessed October 28, 2019.
                                                                               https://farmdoc.illinois.edu/handbook/share-rent-leasing-fact-
contracts. Future studies could examine the impact of
                                                                               sheet.
absentee landownership and changing preferences of
                                                                               Lattz, D. 2017c. “Variable Cash Rent Leases.” Accessed November
those landowners on contract choice. Fluctuations in
                                                                               28, 2019. https://farmdoc.illinois.edu/handbook/variable-cash-
crop prices, yields, revenues, and government outlays                          rent-leasing-fact-sheet.
for commodity payments and crop insurance may have
                                                                               Lattz, D., and B. Zwilling. 2020. “Tenure Characteristics of Illinois
major ramifications on the leasing market in the years                         Farmland.” Accessed March 1, 2020. https://farmdocdaily.illinois
to come.                                                                       .edu/2020/02/tenure-characteristics-of-illinois-farmland-2.html.

                                                                               Leibold, K. 2018. “Improving Your Farm Lease Contract.” Ag
REFERENCES                                                                     Decision Maker, Iowa State University Extension and Outreach,
                                                                               File C2-01. Accessed January 20, 2019. https://www.extension
Allen, D.W., and D. Lueck. 1992. “Contract Choice in Modern                    .iastate.edu/agdm/wholefarm/html/c2-01.html.
Agriculture: Cash Rent Versus Cropshare.” Journal of Law and                   Lence, S.H., and A.K. Mishra. 2003. “The Impacts of Different
Economics 35 (2): 397–426.                                                     Farm Programs on Cash Rents.” American Journal of Agricultural
Barnard, C., R. Nehring, J. Ryan, R. Collender, and B. Quinby. 2001.           Economics 85 (3): 753–761.
“Higher Cropland Value from Farm Program Payments: Who                         Roberts, M.J., B. Kirwan, and J. Hopkins. 2003. “The Incidence of
Gains?” Agricultural Outlook November (AGO-286): 26–30.                        Government Program Payments on Agricultural Land Rents: The
Du, X., D.A. Hennessy, and W.M. Edwards. 2007. “Determinants                   Challenges of Identification.” American Journal of Agricultural
of Iowa Cropland Cash Rental Rates: Testing Ricardian Rent                     Economics 85 (3): 762–769.
Theory.” Accessed March 4, 2019. https://lib.dr.iastate.edu/cgi/               Ryan, J., C. Barnard, R. Collender, and K. Erickson. 2001.
viewcontent.cgi?referer=&httpsredir=1&article=1476&context=card_               “Government Payments to Farmers Contribute to Rising Land
workingpapers.                                                                 Values.” Agricultural Outlook June-July (AGO-282): 22–26.
Environmental Working Group (EWG). n.d. “EWG’s Farm Subsidy                    Schnitkey, G.D. 2002. Farmland Leasing Update. Accessed
Database.” Accessed October 28, 2019. https://farm.ewg.org.                    December 10, 2018. http://www.farmdoc.illinois.edu/manage/
Goodwin, B.K., A.K. Mishra, and F. Ortalo-Magné. 2004.                         newsletters/fefo02_21/fefo02_21.html.
“Landowners’ Riches: The Distribution of Agricultural Subsidies.”              Schnitkey, G.D. 2017. “Negative Cash Rent Farmland Returns Since
Accessed February 15, 2019. http://citeseerx.ist.psu.edu/viewdoc/              2014 Reduced Farmer Net Incomes.” Accessed November 10,
download?doi=10.1.1.199.9345&rep=rep1&type=pdf.                                2019. https://farmdocdaily.illinois.edu/2017/08/negative-cash-
Greene, W.H. 2003. Econometric Analysis. 5th ed. Harlow:                       rent-farmland-returns-since-2014.html.
Longman.                                                                       Sotomayor, N.L., P.N. Ellinger, and P.J. Barry. 2000. “Choice Among
Hauger, M.H., and R.O. Burton, Jr. 2015. “What to Do with a Gift of            Leasing Contracts in Farm Real Estate.” Agricultural Finance
Farmland.” Journal of the American Society of Farm Managers                    Review 60 (1): 71–83.
and Rural Appraisers 78: 87–96.                                                Troendle, M. 2019. “A State-by-State Guide to Midwest Farm Lease
Helmers, G.A., S. Shaik, and B.B. Johnson. 2005. “Forecasting                  Termination Deadlines.” Tillable. Accessed January 10, 2020.
Agricultural Land Values in the Midwest States.” Journal of the

                                                                          10
                                                            A S F M R A 20 2 1 J O U R N A L
https://tillable.com/a-state-by-state-guide-to-midwest-farm- Wikimedia Commons. n.d. Illinois Counties Map. Accessed
lease-termination-deadlines. February 25, 2020. https://commons.wikimedia.org/wiki/
File:Illinois-counties-map.gif.
University of Illinois. n.d. “farmdoc.” Accessed October 27, 2019.
https://farmdoc.illinois.edu. Wooldridge, J.M. 2002. Econometric Analysis of Cross Section
and Panel Data. London: MIT Press.
USDA FSA. 2015. “Payment Eligibility and Payment Limitations.”
2014 Farm Bill Fact Sheet. Accessed February 19, 2020. https:// Zhang, W., W. Zhang, and C. Hart. 2018. “Are Agricultural
www.fsa.usda.gov/Assets/USDA-FSA-Public/usdafiles/FactSheets/ Professionals’ Farmland Value and Crop Price Forecasts
archived-fact-sheets/payment_eligibility_payment_limitations Consistent?” Center for Agricultural and Rural Development
.pdf. (CARD) at Iowa State University. Accessed February 19, 2019.
https://www.card.iastate.edu/products/publications/pdf/
USDA NASS. 2017. “2017 Census of Agriculture.” Accessed 18wp578.pdf.
February 23, 2019. https://www.nass.usda.gov/Publications/
AgCensus/2017/Full_Report/Volume_1,_Chapter_1_State_Level/ Zwilling, B., B. Krapf, and D. Raab. 2013. “Illinois Farmland Leasing
Illinois/st17_1_0011_0012.pdf. Changes.” Accessed December 10, 2018. https://farmdocdaily
.illinois.edu/2013/10/illinois-farmland-leasing-changes.html.
USDA NASS. n.d. “Quick Stats Lite.” Accessed October 28, 2019.
https://www.nass.usda.gov/Quick_Stats/Lite.
11
A S F M R A 20 2 1 J O U R N A LFigure 1. Map showing the northern, central, and southern regions of Illinois used in this study. The standard
farmdoc reporting regions were overlaid onto a county map of Illinois (Wikimedia Commons, n.d.). The northern
region contains 22 counties, the central region contains 44 counties, and the southern region contains the
remaining 36 counties.
12
A S F M R A 20 2 1 J O U R N A LFigure 2. Land tenure in northern Illinois
Figure 3. Land tenure in central Illinois
13
A S F M R A 20 2 1 J O U R N A LFigure 4. Land tenure in southern Illinois
Table 1. Descriptive Statistics of Illinois for All Counties, 1995–2015
Variables Minimum Maximum Mean Std. Deviation
Cash Rent Usage (%) 17 59 36.24 12.27
Corn Yield (bu/acre) 42.83 209.43 147.37 29.8
Soybean Yield (bu/acre) 29.36 58.57 44.7 7.31
Corn Price ($/bu) a
1.9 6.72 3.39 1.46
Soybean Price ($/bu) a
4.53 14.25 8.33 3.18
Corn Revenue ($/acre) 183.11 1103.07 503.54 251.04
Soybean Revenue ($/acre) 141.85 764.12 381.01 178.51
Commodity Payments ($10,000) 182.94 2396.56 715.5 592.05
Crop Insurance ($10,000) 33.31 596.22 218.1 170.15
a
Crop prices are average per-bushel prices statewide, 1995–2015.
14
A S F M R A 20 2 1 J O U R N A LTable 2. Descriptive Statistics of the Counties in the Northern Region, 1995–2015
Variables Minimum Maximum Mean Std. Deviation
Cash Rent Usage (%) 37 59 49.76 7.39
Corn Yield (bu/acre) 114.59 188.47 156.2 22.34
Soybean Yield (bu/acre) 32.09 57.4 47.43 6.38
Corn Price ($/bu) a
1.9 6.72 3.39 1.48
Soybean Price ($/bu) a
4.53 14.25 8.33 3.23
Corn Revenue ($/acre) 264.65 1101.84 539.51 267.03
Soybean Revenue ($/acre) 197.03 764.12 406.3 193.75
Commodity Payments ($10,000) 361.06 2005.41 830.78 563.44
Crop Insurance ($10,000) 36.04 528.32 223.09 170.56
a
Crop prices are average per-bushel prices statewide, 1995–2015.
Table 3. Descriptive Statistics of the Counties in the Central Region, 1995–2015
Variables Minimum Maximum Mean Std. Deviation
Cash Rent Usage (%) 17 39 28.62 7.81
Corn Yield (bu/acre) 112.1 209.43 159.27 24.07
Soybean Yield (bu/acre) 40.64 58.57 48.53 4.76
Corn Price ($/bu) a
1.9 6.72 3.39 1.48
Soybean Price ($/bu) a
4.53 14.25 8.33 3.23
Corn Revenue ($/acre) 286.36 1103.07 541.92 251.35
Soybean Revenue ($/acre) 209.66 751.87 412.02 183.12
Commodity Payments ($10,000) 387.19 2396.56 934.2 709.26
Crop Insurance ($10,000) 42.02 596.22 254.46 191.9
a
Crop prices are average per-bushel prices statewide, 1995–2015.
Table 4. Descriptive Statistics of the Counties in the Southern Region, 1995–2015
Variables Minimum Maximum Mean Std. Deviation
Cash Rent Usage (%) 20 41 30.33 7.86
Corn Yield (bu/acre) 42.83 179.48 126.63 31.51
Soybean Yield (bu/acre) 29.36 48.92 38.14 5.82
Corn Price ($/bu)a 1.9 6.72 3.39 1.48
Soybean Price ($/bu) a
4.53 14.25 8.33 3.23
Corn Revenue ($/acre) 183.11 994.68 429.18 228.41
Soybean Revenue ($/acre) 141.85 612.97 324.7 150.67
Commodity Payments ($10,000) 182.94 995.69 381.53 291.25
Crop Insurance ($10,000) 33.31 414.9 176.74 143.62
a
Crop prices are average per-bushel prices statewide, 1995–2015.
15
A S F M R A 20 2 1 J O U R N A LTable 5. Effect of Crop Yields, Crop Prices, Commodity Payments, Crop Insurance, and Region on the Usage of
Cash Rent Leases (Model 1)
Parameter β Std. Error t
Intercept 17.916*** 4.391 4.08
Corn Yield (bu/acre) 0.016 0.027 0.615
Soybean Yield (bu/acre) 0.075 0.126 0.598
Corn Price ($/bu) –3.076** 1.256 –2.45
Soybean Price ($/bu) 1.345** 0.608 2.211
Commodity Payments (per $10,000) 0.002* 0.001 1.824
Crop Insurance (per $10,000) 0.039*** 0.006 6.553
Northern Region a
15.229*** 1.497 10.173
Central Region a
–7.337*** 1.605 –4.571
R 2
0.934
Degrees of Freedom 51
The southern region was selected as the base region.
a
*, **, and *** denote significance at the 0.1, 0.05, and 0.01 levels, respectively.
Table 6. Effect of Commodity Payments, Crop Insurance, Crop Revenues, and Region on the Usage of
Cash Rent Leases (Model 2)
Parameter β Std. Error t
Intercept 22.165*** 1.741 12.731
Commodity Payments (per $10,000) 0.002** 0.001 2.081
Crop Insurance (per $10,000) 0.039*** 0.006 6.498
Corn Revenue ($/acre) –0.009 0.006 –1.523
Soybean Revenue ($/acre) 0.015* 0.008 1.895
Northern Region a
15.934*** 1.373 11.607
Central Region a
–6.598*** 1.452 –4.546
R 2
0.917
Degrees of Freedom 53
The southern region was selected as the base region.
a
*, **, and *** denote significance at the 0.1, 0.05, and 0.01 levels, respectively.
16
A S F M R A 20 2 1 J O U R N A LIrrigated Acreage Change and
Groundwater Status in Eastern Arkansas
By Tej K. INTRODUCTION
Gautam and
K. Bradley Arkansas ranks first, fourth, and tenth in the United
Watkins States in rice, cotton, and soybean production,
respectively. Although corn production is not ranked as
Tej K. Gautam highly, corn has recently become a major commercial
is a Program crop in Arkansas, overtaking cotton in sales value in
Associate in the 2012. Rice and soybeans are the state’s high-valued
Department of commodities and top export products, accounting for
Agricultural Economics and Agribusiness, University thousands of jobs and contributing billions of dollars
of Arkansas System Division of Agriculture, Rice to the state’s economy. Eastern Arkansas accounts
Research & Extension Center, Stuttgart, Arkansas. for approximately 98% of rice, 96% of soybeans, 98%
K. Bradley Watkins is a Professor in the Department of of cotton, and 96% of corn production in the state.
Agricultural Economics and Agribusiness, University of Irrigation water is a crucial factor for the crops grown
Arkansas System Division of Agriculture, Rice Research in the region, because frequent periods of drought
& Extension Center, Stuttgart, Arkansas. during the growing season can cause large yield
losses. Rice is the most intensively irrigated crop in
the region, but corn, cotton, and soybean producers
have become more reliant on irrigation over time
Abstract as a means to reduce the yield uncertainty caused
by frequent drought conditions during the summer
Arkansas rice, soybeans, cotton, and corn, months. As a result, more than 80% of harvested corn,
cotton, and soybean farms are irrigated—and the
which are mostly irrigated and predominantly trend is increasing.
produced in eastern Arkansas, are crucially
Agriculture in eastern Arkansas accounts for 96% of
important to the state’s economy. However, the total water coming from the Mississippi River
Valley alluvial aquifer (MRVAA) (Kresse et al., 2014).
increased production cost, lower commodity
Excessive pumping has resulted in overexploitation
prices, and unsustainable groundwater of this groundwater resource, as evidenced by cones
of depression1 in key crop-producing areas of eastern
withdrawals impose threats to sustainable Arkansas. Declining groundwater availability has two
farming. This study provides a comparative major implications. First, it imposes additional costs on
groundwater withdrawal for irrigation—which tends
status of eastern Arkansas major crops to increase other input costs, eventually resulting in
acreage and groundwater over the past diminishing marginal farm profit. Second, excessive
pumping of groundwater will likely jeopardize the
Census of Agriculture periods. Results indicate sustainability of both farming and groundwater
resources in the long run. For instance, in 2014, 7,255
that rice acreage remained almost stable,
Mgal/day2 were pumped from the alluvial aquifer
but soybeans and corn gained more irrigated despite an estimated sustainable yield of 3,374.33
Mgal/day—leaving an unmet demand of 3,880.67
acres in 2017 than in preceding census years. Mgal/day (Kresse et al., 2014). Many efforts have been
Groundwater level decline seemed to be more implemented to conserve groundwater resources.
However, the declining trend has not been improved
severe during 2007 than in 2012 and 2017. significantly, as reported by the Arkansas Natural
Resources Commission (ANRC) in 2018. For example,
of the total 290 wells monitored in 2016 and 2017, 169
17
A S F M R A 20 2 1 J O U R N A Lwells experienced a decline in the static water level county-level changes in groundwater at both the
(Battreal, 2018). regional level (representing all 26 counties) and the
district level. Changes in groundwater are measured
The main objective of this study is to evaluate harvested in feet and are reported in 1-year, 5-year, and 10-year
acreage statistics of four major irrigated crops grown monitoring periods (Table 2).
in eastern Arkansas (corn, cotton, rice, and soybeans)
over the past Census of Agriculture periods 1982–2017. RESULTS AND DISCUSSION
Additionally, we illustrate changes in groundwater
levels during the past three census periods and discuss Harvested, non-irrigated, and irrigated acreage of
some policy implications concerning crop production rice, soybeans, corn, and cotton during each census
and groundwater sustainability in the region. We period is presented in tabular form (Table 1) and
feel this information will be helpful for visualizing the diagrammatically (Figures 1–6). Similarly, Table 2
strengths, weaknesses, and challenges of eastern displays groundwater level changes in 1-year, 5-year,
Arkansas cropland management and groundwater and 10-year monitoring periods. Furthermore,
sustainability. The remainder of this study is organized diagrammatic illustrations of groundwater changes are
as follows. The Data and Methods section provides the shown in Figures 7 and 8.
data description and methodology used in the study.
In the Results and Discussion section, we explain the
comparative facts of harvested, irrigated, and non-
Harvested, Irrigated, and Non-Irrigated
irrigated acreage of corn, cotton, rice, and soybeans Acreage of Four Major Crops
over the past eight census periods (from 1982 to 2017), The total number of harvested crop acres in eastern
as well as the groundwater status of the MRVAA in Arkansas remained steady, hovering around six million
eastern Arkansas over the past three census periods acres over the past eight census years (Figure 1).
(from 2007 to 2017). Finally, the study concludes with However, irrigated acres in the region grew remarkably
both a summary and potential policy implications of from 1.96 million in 1982 to 4.73 million in 2017 (Table 1).
the findings. In census year 1982, harvested irrigated and non-
irrigated acreage in eastern Arkansas accounted
DATA AND METHODS for 32% and 68%, respectively, with the majority of
harvested irrigated crop acres dominated by rice.
The main focus of our study is the comparison of crop However, with the passage of time, producers have
acreages for corn, cotton, rice, and soybeans, as well as increasingly converted to irrigation to mitigate the
comparisons of groundwater depth changes in eastern negative yield effects of frequent drought periods
Arkansas over past census periods. For this purpose, occurring during the summer months (Vories and
we gathered eastern Arkansas county-specific crop Evett, 2010). As a result of this advantage, reliance
acreage and groundwater information from two on irrigation grew over time and the number of
sources. We obtained corn, cotton, rice, and soybean harvested irrigated acres outpaced the number of
acreage data from the United State Department of non-irrigated acres during census year 1997, with the
Agriculture (USDA) National Agricultural Statistics share of irrigated and non-irrigated acres being 58%
Service (NASS) Census of Agriculture (USDA NASS, and 42%, respectively. Proliferation of irrigated acres
1982–2017) and groundwater information from the continued until the latest census year 2017, during
ANRC. The eastern Arkansas region consists of 26 which the number of harvested irrigated and non-
counties, which are subdivided into NASS crop irrigated acres in eastern Arkansas accounted for 4.73
reporting districts:3 District 3 (northeast Arkansas), million (83%) and 0.97 million (17%), respectively, of the
District 6 (east central Arkansas), and District 9 total 5.7 million harvested acres (Table 1). This irrigated
(southeast Arkansas) for statistical reporting purposes. crop acreage expansion in the region has been driven
We aggregated the crop acreage data at the regional mainly by marginal profit, water resource availability,
and district level, as shown in Table 1. Crop acreage and weather.
information over the past census periods includes
harvested, irrigated, and non-irrigated acres (in 1,000 Harvested acres devoted to irrigation have changed
acres) of corn, cotton, rice, and soybeans. over time for every major irrigated field crop except
rice (Figure 2). Rice acres have remained fairly constant
Groundwater status across the MRVAA in eastern over the eight census years, hovering above or below
Arkansas is based on the number of wells monitored approximately 1.3 million acres since 1982. However,
by the United States Geological Survey (USGS) in each irrigated soybean acres increased significantly over
county as reported by the ANRC. We aggregated time since 1982, and irrigated corn acres increased
18
A S F M R A 20 2 1 J O U R N A Lsignificantly starting in 2007 (Figure 2). Irrigated cotton The change in corn irrigated acres from census
acres increased steadily from census years 1982–2002 years 1982–2017 is presented by county in Figure 6.
but began to decline from census year 2007 onward Although irrigated acreage changes have not been as
(Figure 2). dramatic for corn as for soybeans, Figure 6 reveals that
irrigated corn acres have increased for every county in
Of the four major crops evaluated in the study, eastern Arkansas since the early 1980s. The increase
soybeans have seen the largest increase in irrigated in irrigated corn acres in eastern Arkansas occurred in
acres since 1982. In the early 1980s, soybeans were the mid-2000s as corn prices increased due to the U.S.
primarily a non-irrigated crop—but since census year Ethanol Mandate and significant drought occurring
1982, irrigated soybeans have increased significantly throughout the Corn Belt and southwest regions of the
relative to non-irrigated soybeans, with the former United States in 2012. Arkansas also has a significant
surpassing the latter in census year 2002 (Figure 3). poultry industry, and much of the corn grown in
In addition, irrigated soybean acres have increased eastern Arkansas supplies this industry. Counties
significantly in all three eastern Arkansas NASS experiencing the largest increases in irrigated corn
reporting districts (Figure 4), indicating an upward acres since 1982 tend to be rice-producing counties
trend in irrigated soybean acres throughout eastern (Arkansas, Craighead, and Lonoke), cotton-producing
Arkansas. A major factor for the upward trend in counties (Lee and Phillips), or counties growing both
irrigated soybean acres is increased world demand for rice and cotton (Desha and Jackson). These counties
this crop since the early 1980s, particularly in China. collectively account for 225,000 additional irrigated
Increased world demand for soybeans has increased corn acres since census year 1982. The rise in irrigated
the value of this crop relative to other irrigated field corn acres within these counties has been largely
crops grown in the state. due to substitution of rice or irrigated cotton area for
irrigated corn area resulting from relative crop prices
As mentioned previously, the two crops that have favoring corn over rice and cotton, particularly in the
experienced the largest increases in irrigated acres early to mid-2000s.
since the early 1980s are soybeans and corn. Figures 5
and 6 show where the most change occurred in Groundwater Status
eastern Arkansas for these respective crops. The
change in soybean irrigated acres from census years Groundwater use is extremely important for the
1982–2017 is presented by county in Figure 5. Figure 5 state because groundwater irrigation is critical to
indicates that all counties in eastern Arkansas have agriculture—the keystone in the state economy
experienced a positive increase in irrigated soybean (McGraw, Popp, and Miller, 2012). Irrigation accounts
acres since 1982. However, the counties experiencing for the highest percentage of groundwater use in
the largest increases in irrigated soybean acres Arkansas (Holland, 2007), especially for rice production
are those that border the Mississippi River (Chicot, that requires large volumes of water during its growing
Crittenden, Desha, Mississippi, Phillips, and St. Francis). season. Eastern Arkansas gets plenty of precipitation,
The top 10 counties gaining irrigated soybean acres ranging from 45 to 55 inches annually in a normal year
over the study period are shown in Figure 5A and (NOAA, 2017). However, most of this precipitation falls
are highlighted in yellow. These counties account during post-harvest and pre-harvest periods such as
for almost one million additional irrigated soybean winter and early spring. As a result, row crop producers
acres since 1982. All of these counties produced in the region rely heavily on irrigation water for crop
predominantly non-irrigated soybeans in the early production during the summer months. Additionally,
1980s, but their close proximity to the Mississippi eastern Arkansas is an important waterfowl flyway,
River means they have ample groundwater because and flooded rice fields in the winter provide important
of lateral flows from the river recharging the MRVAA. habitat for ducks and geese. Around 28.8% of rice
These counties have thus taken advantage of plentiful fields are flooded with groundwater from irrigation
groundwater and have converted most of their non- wells for migratory bird habitat following the rice
irrigated soybean acres to irrigated acres over time. In harvest (Hardke, 2020). This event accounts for a
other counties farther removed from the Mississippi certain amount of groundwater withdrawal during
River and where groundwater is more limiting, the the period from the last week of November to the last
rise in irrigated soybean acres has been the result of week of January.
marketing decisions by producers when relative crop
prices favored soybeans over other crops such as Average groundwater level changes across the MRVAA
irrigated cotton and rice. during the three census years within the eastern
Arkansas region are presented in Table 2 and Figure 7.
19
A S F M R A 20 2 1 J O U R N A LThis information shows groundwater depth changes The groundwater decline rate is significantly larger
in 1-year, 5-year, and 10-year monitoring periods.4 than the regional values reported in many counties,
Here, 1-year, 5-year, and 10-year monitoring periods such as Jefferson, Monroe, Poinsett, St. Francis, and
for census year 2017 are 2016–2017, 2012–2017, and Woodruff. This overexploitation of groundwater might
2007–2017, respectively. On average, groundwater be attributed to inefficient irrigation management.
declined by 0.92, 1.35, and 2.41 feet in eastern Arkansas For example, Watkins et al. (2019a, 2019b) found that
during the periods 2016–17, 2012–2017, and 2007– irrigation water was overapplied on average by 37%
2017, respectively. These numbers clearly indicate when comparing water use efficiencies for 142 rice
that the groundwater pumping rate in the region fields enrolled in the University of Arkansas Rice
exceeded the aquifer recharge rate (the rate of water Research Verification Program (RRVP). That same
that moves from the land surface to the aquifer— study found that multiple-inlet rice irrigation (MIRI)
in other words, aquifer recharge is the process of and precision land grading (straight levees; zero-grade)
replenishment of aquifer with the surface water) significantly improved irrigation water efficiency on
during those monitoring periods. The rate at which rice fields. A study conducted by Gautam, Paudel, and
groundwater is being pumped cannot be sustained Guidry (2020) in Louisiana using farm-level survey data
in the long run if that trend continues for several determined similar soybean irrigation efficiency to that
years. Groundwater decline rates seem to be slightly found in Arkansas rice irrigation.
improved in 2017 compared to 2007, potentially due to
continuous efforts and initiatives taken by producers SUMMARY AND CONCLUDING
toward irrigation efficiency enhancement and water
conservation but also due to some movement in acres REMARKS
away from water-intensive rice to less water-intensive
crops such as soybeans and corn. From Table 2 and This study highlighted the comparative overview of
Figure 7, we see that the greatest level of groundwater harvested and irrigated corn, cotton, rice, and soybean
decline occurred in 2007. On average, groundwater acreage in eastern Arkansas over the past eight
declined by 0.44, 2.4, and 7.46 feet in eastern Arkansas census years (1982–2017). Additionally, it illustrated the
in 1-year, 5-year, and 10-year monitoring periods ending information concerning groundwater level change
in 2007, respectively. across the alluvial aquifer within the region over the
past three census years 2007, 2012, and 2017. The
Figure 8 shows district-level groundwater changes in a census data revealed a significant increase in irrigated
5-year monitoring period (district cluster). Districts 6 acres since the early 1980s, and most of this increase
and 9 had declines in groundwater level of 2.26 feet was due to a switch from non-irritated to irrigated
and 1.80 feet, respectively, during the 2012–2017 period. soybeans across the entire region. Most of the increase
However, District 3 gained 0.21 feet during the same in irrigated soybean acres occurred in counties along
period. Note that District 6 and District 3 gained more the Mississippi River, where water is plentiful. Some
irrigated corn and soybean acres from 1982 to 2017. of the increase in irrigated soybean acres was due to
Over the period of 2002–2007, more than 2 feet of marketing decisions and favorable prices for soybeans,
groundwater decline occurred in all three districts. leading to substitution of soybean acres for rice and
However, the rate of decline improved slightly during irrigated cotton. Irrigated corn acres also grew during
the 2007–2012 period, as shown in Figure 8. But a the eight census periods, primarily starting in census
groundwater report produced by the ANRC indicated year 2007. During this period, irrigated corn acres
that water-level declines are persistent in areas where replaced rice and irrigated cotton acres as a direct
water use is highest, as evidenced by the presence result of marketing decisions made by producers.
of significant cones of depression in the MRVAA,
especially in the Grand Prairie and in the Cache Study Changes in groundwater levels during a 1-year, 5-year,
Area west of Crowley’s Ridge (Battreal, 2018). In all and 10-year monitoring period across the eastern
three census years, groundwater withdrawal rates are Arkansas region indicate that the groundwater
higher than recharge rates, indicating that effective pumping rate is beyond its sustainable range.
policy and proper action are needed to address this Groundwater decline appeared to be less pronounced
issue. Clark, Hart, and Gurdak (2011) reported that in 2017 and 2012 than in 2007 for the 5-year and 10-year
an approximately 216-mile area within the MRVAA periods. This relaxation in groundwater withdrawal
showed declines of more than 100 feet of groundwater might be partially attributed to continuous efforts
between 1927 and 2007. In Arkansas, there is no made by producers toward irrigation efficiency
groundwater pumping limitation as imposed in some enhancement and water conservation but also may be
other states such as Texas and California. due to movement in acres away from water-intensive
20
A S F M R A 20 2 1 J O U R N A Lrice to less water-intensive crops such as soybeans
REFERENCES
and corn. Eastern Arkansas has tremendous potential
Arkansas Natural Resources Commission (ANRC). Arkansas
for crop production, which contributes significantly to
Groundwater Protection and Management Reports for 2007,
the state’s economy. This region is unique mainly due 2012, and 2017. https://www.agriculture.arkansas.gov/natural-
to its ability to grow multiple crops to meet changing resources/news/annual-reports.
market conditions. However, overdependence on Battreal, J.L. 2018. “Arkansas Groundwater Protection and
groundwater for irrigation has imposed a threat to the Management Report for 2017.” Arkansas Natural Resources
Commission.
sustainability of invaluable groundwater resources. The
major concern in the present context is to maintain Clark, B.R., R.M. Hart, and J.J. Gurdak. 2011. “Groundwater
Availability of the Mississippi Embayment.” Reston, VA: U.S.
groundwater sustainability in the region. More
Geological Survey.
specifically, groundwater sustainability can be achieved
Gautam, T.K., K.P. Paudel, and K.M. Guidry. 2020. “An Evaluation
by encouraging producers to implement efficient
of Irrigation Water Use Efficiency in Crop Production Using a
irrigation technology. In general, a combined effort Data Envelopment Analysis Approach: A Case of Louisiana, USA.”
from producers, the research community, and policy Water 12 (11): 3193.
makers would be effective for achieving this goal. Hardke, J.T. 2020. “Trends in Arkansas Rice Production, 2019.”
In: B.R. Wells Arkansas Rice Research Studies 2019, edited by
K.A.K Moldenhauer, B. Scott, and J. Hardke, 11–17. Fayetteville, AK:
Eastern Arkansas was the focus of this study. However,
Arkansas Agricultural Experiment Station, University of Arkansas
many of the findings—particularly with regard to System Division of Agriculture.
groundwater availability, aquifer depletion, and water
Holland, T.W. 2007. “Water Use in Arkansas, 2005.” U.S. Geological
management—can be applied to the other regions Survey Scientific Investigations Report 2007–5241.
bordering eastern Arkansas, such as northeastern
Kresse, T.M., P.D. Hays, K.R. Merriman, J.A. Gillip, D.T. Fugitt, J.L.
Louisiana, northeastern Mississippi, and the Missouri Spellman, A.M. Nottmeier, D.A. Westerman, J.M. Blackstock,
Bootheel (Reba et al., 2017). A good follow-up to and J.L. Battreal. 2014. “Aquifers of Arkansas—Protection,
Management, and Hydrologic and Geochemical Characteristics
this study would be to determine if similar trends in
of Groundwater Resources in Arkansas.” U.S. Geological Survey
irrigation area have also occurred over the same period Scientific Investigations Report 2014–5149.
in these regions.
McGraw, K., J. Popp, and W. Miller. 2012. “Economic Contribution
of the Agricultural Sector to the Arkansas Economy in 2010.”
FOOTNOTES Fayetteville, AK: Arkansas Agricultural Experiment Station,
University of Arkansas System Division of Agriculture.
1. A cone of depression forms in an aquifer when groundwater is
National Oceanic and Atmospheric Administration (NOAA). 2017.
withdrawn excessively from a well. When the groundwater is
“A Review of 2017 Weather and Climate Data for the State of
pumped, the water level in the well is lowered. As the decline
Arkansas.” National Weather Service. https://www.weather.gov/
in groundwater level continues, water pressure around the
lzk/cli2017atxt.htm.
well decreases, which results in the formation of a cone-
shaped depression known as cone of depression. The shape Reba, M.L., J.H. Massey, M.A. Adviento-Borbe, D. Leslie, M.A.
of cone depends on many factors such as pumping rate, Yaeger, M. Anders, and J. Farris. 2017. “Aquifer Depletion in the
aquifer material, thickness of the aquifer, and so on. Lower Mississippi River Basin: Challenges and Solutions.” Journal
of Contemporary Water Research & Education 162 (1): 128–139.
2. The abbreviation “Mgal” stands for million gallons of water,
which is equivalent to 3,785,412 liters. Alternatively, assuming USDA NASS. Census of Agriculture, 1982–2017. https://www.nass
8.34 pounds per gallon, a million gallons is equivalent to .usda.gov/AgCensus/index.php.
8,340,000 pounds.
Vories, E.D., and S.R. Evett. 2010. “Irrigation Research Needs in the
3. Counties in District 3 (Clay, Craighead, Greene, Independence, USA Mid-South and Southeast, Humid and Sub-Humid Regions.”
Jackson, Lawrence, Mississippi, Poinsett, Randolph, and Paper presented at the 5th National Decennial Irrigation
White), District 6 (Arkansas, Crittenden, Cross, Lee, Lonoke, Conference, Phoenix, December 5–8, 2010.
Monroe, Phillips, Prairie, St. Francis, and Woodruff), and
District 9 (Ashley, Chicot, Desha, Drew, Jefferson, and Watkins, K.B., C.G. Henry, J.T. Hardke, R.U. Mane, R. Mazzanti,
Lincoln). and R. Baker. 2019a. “Effects of Field Characteristics on Irrigation
Water Efficiency in Arkansas Rice Production.” In B.R. Wells
4. For census year 2017, time periods 2016–2017, 2012–2017, and Arkansas Rice Research Studies 2018, edited by R.J. Norman
2007–2017 represent 1-year, 5-year, and 10-year monitoring and K.A.K. Moldenhauer, 431–438. Fayetteville, AK: Arkansas
periods, respectively. For census years 2012 and 2007, similar Agricultural Experiment Station, University of Arkansas System
patterns represent groundwater monitoring periods. Division of Agriculture.
Watkins, K.B., C.G. Henry, J.T. Hardke, R.U. Mane, R. Mazzanti,
and R. Baker 2019b. “Efficiency Measurement of Irrigation Water
and Other Inputs in Arkansas Rice Production Using Data from
the Rice Research Verification Program.” In B.R. Wells Arkansas
Rice Research Studies 2018, edited by R.J. Norman and K.A.K.
Moldenhauer, 424–430. Fayetteville, AK: Arkansas Agricultural
Experiment Station, University of Arkansas System Division of
Agriculture.
21
A S F M R A 20 2 1 J O U R N A LYou can also read