JORDAN: COMPANY PERSPECTIVES - AN ITC SERIES ON NON-TARIFF MEASURES - TRADE IMPACT FOR GOOD - International Trade ...
←
→
Page content transcription
If your browser does not render page correctly, please read the page content below
JORDAN:
COMPANY PERSPECTIVES
AN ITC SERIES ON
NON-TARIFF MEASURES

                       TRADE IMPACT
                          FOR GOOD

JORDAN:
COMPANY PERSPECTIVES

An ITC Series on Non-Tariff Measures

JORDAN: COMPANY PERSPECTIVES

About the paper

More than two-thirds of Jordanian companies face difficulties with non-tariff measures when exporting
or importing.

Inconsistent application of regulations creates major obstacles for Jordanian exporters. The problems
caused by conformity assessment requirements and procedures are a key source of concern.

This report recommends strengthening officials’ capacity, increasing assistance to the private sector
and deepening the dialogue with Saudi Arabia to facilitate transit and direct trade.

Publisher: International Trade Centre

Title: Jordan: Company Perspectives. An ITC Series on Non-Tariff Measures

Publication date and place: Geneva, June 2018

Page count: 62

Language: English

ITC Document Number: TMI-18-17.E

Citation: International Trade Centre (2018). Jordan: Company Perspectives. An ITC Series on Non-Tariff Measures. ITC,
Geneva.

For more information, contact: Ursula Hermelink (hermelink@intracen.org)

For more information on ITC’s NTM Business Surveys, see: www.ntmsurvey.org

ITC encourages the reprinting and translation of its publications to achieve wider dissemination. Short extracts of this paper may
be freely reproduced, with due acknowledgement of the source. Permission should be requested for more extensive reproduction
or translation. A copy of the reprinted or translated material should be sent to ITC.

Digital image(s) on the cover: © Shutterstock

© International Trade Centre (ITC)

ITC is the joint agency of the World Trade Organization and the United Nations.

ii

JORDAN: COMPANY PERSPECTIVES

Acknowledgments

The International Trade Centre (ITC) thanks representatives of enterprises and experts who shared
their experiences with non-tariff measures and trade obstacles they face when trading.
Abdellatif Benzakri (ITC) and Suha Batarseh (Jordanian international consultant) wrote this report.
Abdellatif Benzakri and Cristian Ugarte (ITC) launched, implemented and monitored the survey. Ursula
Hermelink (ITC) participated in the launch and managed ITC’s overall NTM Programme. IPSOS Jordan
conducted interviews by telephone and face to face.
We thank the Ministry of Industry, Trade and Supply of Jordan for its trust and support throughout the
project, especially Zaher Qatarneh, Director of Foreign Trade Policies and Relations Department, and
his team. We express our gratitude to all partners, stakeholders and ITC colleagues, particularly
Mathieu Loridan and participants in the stakeholder meeting, for their comments, suggestions and
recommendations.
Special thanks to Jennifer Freedman who edited the report, and to the ITC publications team for
production management and quality control.
The Non-Tariff Measures Survey in Jordan was implemented as part of the ITC Programme on Non-
Tariff Measures under the general supervision of Mondher Mimouni, Chief, Trade and Market
Intelligence Section. The NTM team thanks the ITC Office for Arab States for its guidance and support.
ITC thanks the Aid for Trade Initiative for the Arab States and the United Kingdom Department for
International Development for their financial contributions.

                                                                                                      iii
JORDAN: COMPANY PERSPECTIVES

Contents

Acknowledgments                                                       iii
Contents                                                              iv
Acronyms                                                              vi
Executive summary                                                     vii

INTRODUCTION TO NON-TARIFF MEASURES                                    1

Chapter 1     TRADE OVERVIEW                                           2

Jordan: Country overview                                               2
Trade agreements and tariffs                                           6
National trade and development strategies                              8

Chapter 2     SURVEY METHODOLOGY AND IMPLEMENTATION IN JORDAN          9

Survey implementation and sampling                                     9
Company profiles                                                      11
Captured data and method of evaluation                                12

Chapter 3     THE COMPANY PERSPECTIVE                                 13

Most companies in Jordan say NTMs impede trade                        13
     Agricultural exports face most NTMs                              16
     Rules of origin challenge many exporters                         17
     Arab markets are often difficult to access                       19
     Steps to comply with NTMs cause most problems for exporters      20
     Trade-related business environment adds to traders’ woes         24
Burdensome non-tariff measures and other import obstacles             25
     Why are NTMs perceived as obstacles?                             26
     Where do procedural obstacles occur?                             27
Zoom on specific issues                                               29
     The biggest technical burden: testing and certification          29
     Complex and lengthy delivery of certificate of origin            32
     Inconsistent customs clearance and inspections in Saudi Arabia   33
     Other trade rules                                                34

Chapter 4      CONCLUSIONS AND POLICY OPTIONS                         36

APPENDICES                                                            42
REFERENCES                                                            53
ITC SERIES ON NON-TARIFF MEASURES                                     54

iv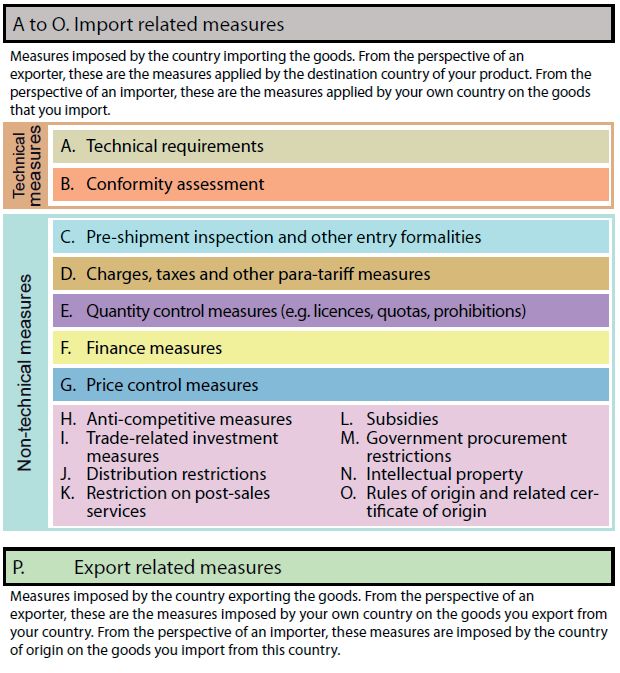
JORDAN: COMPANY PERSPECTIVES

Tables, Figures, Boxes

Table 1     Export sectors: shares and evolution                                             3
Table 2     Import sectors: shares and evolution                                             5
Table 3     Jordan’s main trade agreements                                                   6
Table 4     Applied tariffs and preferences                                                  7
Table 5     Average number of product-partner trade flows per size                          14
Table 6     Share of affected product-partner flows                                         14
Table 7     The most challenging NTMs                                                       18
Table 8     Share of trade, NTMs and affectedness per destination                           19
Table 9     Jordanian agencies with export regulations                                      23
Table 10    Jordanian agencies linked to POs that obstruct importers                        28

Figure 1    Annual GDP and inflation rates                                                    2
Figure 2    Evolution of export values                                                        4
Figure 3    Evolution of export shares                                                        4
Figure 4    Imports per partner region                                                        6
Figure 5    Vision 2025: national vision and strategy goals                                   8
Figure 6    Overview of surveyed companies                                                   10
Figure 7    Company size and location                                                        11
Figure 8    Shares of female employees and managers/owners                                   12
Figure 9    Breakdown of companies affected by NTMs                                          13
Figure 10   Affectedness based on exporter size                                              14
Figure 11   Affectedness per sector                                                          15
Figure 12   Main exporting and importing partner regions                                     16
Figure 13   Affectedness when exporting                                                      16
Figure 14   Country applying regulations on exports                                          16
Figure 15   Type of NTMs per sector                                                          17
Figure 16   Arab states account for 51% of exports, but 93% of partners’ NTMs                20
Figure 17   Why are NTMs burdensome?                                                         21
Figure 18   Why do companies perceive a specific NTM as an obstacle?                         21
Figure 19   Procedural obstacles occur not only at home but also in partner countries        22
Figure 20   Main challenges in the business environment and their evolution                  25
Figure 21   NTMs that affect importers                                                       26
Figure 22   Reasons NTMs hinder imports                                                      26
Figure 23   Types of procedures that encumber importers                                      26
Figure 24   Breakdown of procedural obstacles                                                27
Figure 25   Technical burdensome NTMs                                                        29
Figure 26   Procedural obstacles that occur in Jordan                                        29
Figure 27   Procedural obstacles that occur abroad                                           31
Figure 28   Non-technical NTMs affecting exports and imports                                 32
Figure 29   Reasons non-technical NTMs are problematic                                       32

Box 1       Jordanian laboratories address traders' complaints                               24
Box 2       Public-private sectors discussions on certificates of origin                     33

                                                                                              v
JORDAN: COMPANY PERSPECTIVES

Acronyms

Unless otherwise specified, all references to dollars ($) are to United States dollars, and all references
to tons are to metric tons.

 CoO         Certificate of origin
 EU          European Union
 GAFTA       Greater Arab Free Trade Area
 GDP         Gross domestic product
 HS          Harmonized System
 ITC         International Trade Centre
 JFDA        Jordan Food and Drug Administration
 JSMO        Jordan Standards and Metrology Organization
 LAS         League of Arab States
 MFN         Most-favoured nation
 MITS        Ministry of Industry, Trade and Supply
 NTM         Non-tariff measure
 OECD        Organisation for Economic Co-operation and Development
 PO          Procedural obstacle
 RSS         Royal Scientific Society
 UNCTAD      United Nations Conference on Trade and Development
 WTO         World Trade Organization

vi
JORDAN: COMPANY PERSPECTIVES

Executive summary

Understanding non-tariff measures is a key to better international trade
Economic liberalization and tariff reduction across the world mean non-tariff measures (NTMs) have
become a major impediment to trade. These measures are imposed to protect human, animal or plant
health, to ensure product quality and to inform consumers about content or the production process.
NTMs particularly concern exporters and importers in developing and least developed countries, who
struggle with complex requirements.

The International Trade Centre (ITC) business survey shows that burdensome NTMs affect 64% of
Jordanian companies when they export or import. Pre-shipment inspections, the way officials apply
regulations, high fees and charges, and rules of origin are the main obstacles that affect Jordanian
businesses at their border, as well as in destination markets.

Enterprises that primarily import or export agricultural products are more affected than those in
manufacturing. Large exporters face NTMs more frequently than small ones, although the share of such
measures is relatively lower because it is spread out among all their trading operations.

Procedures impede compliance with most of the NTMs
About 88% of the NTMs that hinder companies in Jordan are due to procedural obstacles rather than
overly strict regulations. Exporters in other surveyed developing countries perceive such delays as the
sole burden in 60% of the NTM cases.

This difference means Jordanian companies consider themselves to be more ‘export-ready’, which
suggests improvements should be sought in the field rather than through revised regulations.

Exporters cite lack of capacity, high fees, rules of origin
Officials fail to apply regulations coherently and systematically, which causes a third of the obstacles
that exporters face. Some exporting companies believe that government agencies lack capacity and
resources.

Jordanian exporters complain that agencies charge too much for services, certificates and testing. They
also report problems tied to recognition of Jordanian documents and certificates: partner countries often
reject exporters’ certificates of origin or documents certifying that their products conform.

More than a third of the NTMs that partner countries apply to Jordanian exports involve rules of origin
and related certificates of origin. They often require different documents from multiple agencies and
charge high fees. Jordanian traders report that the officials who issue certificates often lack knowledge
and expertise about the procedures, which delays the processing of demands for documents.

Lack of testing and certification facilities adds to exporters’ costs
Companies report inadequate facilities for testing and certification. Some tests take longer than
expected because the number of laboratories is limited and reaching them can be difficult. Technical
problems at facilities also cause delays. Machines may be unavailable because broken equipment can’t
be repaired quickly enough. Restricted testing hours at some laboratories also create bottlenecks.

Foreign regulations aren’t applied transparently
Officials in partner countries, notably Saudi Arabia and Iraq, do not systematically recognize Jordanian
testing certificates. Exporters want greater transparency about mandatory requirements and consistent
decisions by customs officials.

Difficulties accessing Arab states’ markets
Members of the League of Arab States are responsible for 93% of the NTMs that Jordanian traders
face, though only about 53% of Jordanian exports are destined for this region. The Greater Arab Free
Trade Area (GAFTA) remains a challenging destination for Jordanian exporters.

                                                                                                      vii
JORDAN: COMPANY PERSPECTIVES Saudi Arabia, which plays a central role as a destination for Jordanian products and as a transit country, is harder to access than the United States. Saudi Arabia bought 16% of Jordan’s exports in 2015, but accounted for 33% of the NTMs. The United States buys 20% of exports, but is responsible for just 2% of the NTMs, which indicates that its free trade agreement with Jordan is functioning efficiently. Classification and valuation of imports lack inconsistency The survey found that Jordan Customs calculates the value of goods inconsistently. Customs officials do not recognize invoices and they base valuations on their personal assessments. Companies report that Jordanian customs officials use different methods to evaluate goods and to determine their codes in the Harmonized System (HS) classification. This results in unpredictable tariffs, a lack of transparency and additional delays. Difficulties with the business environment Traders also struggle with the general business environment, particularly administrative burdens. More than 70% of the companies surveyed complain about delays and 60% say insufficient human resources and officials’ inconsistent behaviour lead to inefficiencies. Complex clearance mechanisms also obstruct trade. Almost half of the traders report that informal payments remain an issue and many say the transport system, especially air transportation, is inadequate. Some called for better electronic or computerized procedures and more e-procedures. The general business environment hinders traders’ efforts to comply with NTMs. Questions about the business environment were only asked of companies that participated in the face-to-face interviews. The way forward The survey finds that border clearance controls are a major challenge to trade. There are several ways to help exporters and importers cope with trade barriers and to support greater export development. Stakeholders proposed creating a national assessment centre to oversee, coordinate and unify all requirements – particularly when testing goods in government-run laboratories – and to simplify the steps related to export and import. The Government of Jordan should upgrade public laboratories and attract investment to modernize facilities. Laboratory officials’ roles should be expanded and assessment teams taught advanced skills. The Government should also offer in-depth technical assistance to companies so they know more about the planning process before they trade. Deeper discussions between the authorities in Jordan and Saudi Arabia on land trade facilitation would ease cross-border procedures and improve transparency. Communication channels between the private and public sectors must be optimized to save time and money and to increase transparency. Public agencies must accelerate work to set up a single window that will be a ‘one-stop shop’ for traders. Jordan Customs should improve and clarify how import duties are calculated to improve consistency and to give traders more understanding about the valuation process. ITC survey on non-tariff measures ITC’s NTM programme seeks to understand how official regulations hinder cross-border trade and to propose solutions to tackle these barriers. Understanding traders’ concerns about NTMs, procedures that cause delays and trade-related business environments can help define national strategies to overcome the identified obstacles. The results presented in this report are based on a business survey implemented by ITC, in collaboration with the Ministry of Industry, Trade and Supply. The NTM surveys cover all major export sectors and importing partners. They allow companies to report the most onerous NTMs and how they affect their businesses. Exporters and importers encounter obstacles every day. Because they know the challenges they face, a business perspective on NTMs is indispensable. viii
JORDAN: COMPANY PERSPECTIVES

INTRODUCTION TO NON-TARIFF MEASURES

        Defining non-tariff measures
        Non-tariff measures (NTMs) are defined as ‘policy measures, other than customs tariffs,
        that can potentially have an economic effect on international trade in goods, changing
        quantities traded, or prices or both’. 1 The concept of NTMs is neutral and does not imply
        a direction of impact. 2

        Being ‘defined by what they are not’, 3 NTMs comprise a myriad of policies other than tariff
        duties. NTMs are complex legal texts specific to the product and applying country. They
        are more difficult to quantify or compare than tariffs.

        Given that legitimate reasons, including the protection of human, animal and plant health
        may lead to NTMs, this report avoids making judgements on intentions and the term NTM
        is used. By design, the survey only captures NTMs that cause major difficulties for trading
        companies. NTMs analysed in this report refer to ‘burdensome NTMs’. Because
        obstacles to trade are complex, understanding their terminology and classification are
        important.

        The diversity of NTMs requires a classification system. ITC’s NTM surveys are based on
        the international classification developed by the Multi-Agency Support Team,
        incorporating minor adaptations to the ITC NTM survey approach. 4

        Procedural obstacles and trade-related business environment
        Procedural obstacles (POs) refer to practical challenges directly related to the
        implementation of NTMs. For instance, problems caused by the lack of adequate testing
        facilities to comply with technical measures or excessive paperwork in the administration
        of licences. Inefficiencies in the trade-related business environment may have similar
        effects, but are unrelated to specific NTMs. Examples include delays and costs due to
        poor infrastructure or inconsistent behaviour of officials at customs or ports.

        A business perspective is imperative
        The ITC NTM Programme, launched in 2010, incorporates large-scale company surveys
        on NTMs, POs and trade-related business environment inefficiencies. The NTM surveys
        evaluate all major export sectors and all major importing partners.

        The NTM surveys also allow companies to report their most burdensome NTMs and how
        they impact their businesses. Exporters and importers face NTMs and other obstacles
        every day. Because they know the challenges they face, a business perspective on NTMs
        is indispensable. At government level, understanding companies’ key concerns regarding
        NTMs, POs and trade-related business environments can help define national strategies
        to overcome obstacles to trade.
        The full survey methodology is documented in ITC’s technical paper, The Invisible Barriers to Trade – How
        Businesses Experience Non-Tariff Measures (2015). 5

1
    Multi-Agency Support Team (2009).
2
  The term ‘non-tariff barrier’ implies a negative impact on trade. The Multi-Agency Support Team and the Group of Eminent
Persons on Non-Tariff Barriers proposed that non-tariff barriers to trade be a subset of NTMs with a ‘protectionist or discriminatory
intent’.
3
    Deardorff and Stern (1998).
4
    For further details on the Multi-Agency Support Team NTM classification, see Appendix II.
5
    www.ntmsurvey.org/publications/itc-series-on-ntms/

                                                                                                                                   1
JORDAN: COMPANY PERSPECTIVES
CHAPTER 1 TRADE OVERVIEW
© Shutterstock
Jordan: Country overview
Economic indicators
The Hashemite Kingdom of Jordan shares its borders with Syria to the north, Iraq to the east, Saudi
Arabia to the east and south, and the State of Palestine and Israel to the west. Aqaba, the only coastal
city, is on the Red Sea. Jordan's location affects its trade patterns and encourages the need for an
economic reform (see further details below under points 2 and 3).
Jordan’s economy grew steadily from 2009–2015. Gross domestic product (GDP) averaged 2.7%
growth over this period, reaching $37.5 billion in 2015 (Figure 1). With GDP per capita of $4,100 in
2015, 6 Jordan is classified as an upper middle-income country. The inflation rate in this period averaged
2.8%, with the highest at 5% in 2010 and deflation of 0.9% in 2015 (Figure 1).
Figure 1 Annual GDP and inflation rates
6%
5%
4%
3%
2%
1%
0%
2009 2010 2011 2012 2013 2014 2015
-1%
GDP growth (annual %) Inflation, consumer prices (annual %)
Source: The World Bank (2015), World Data Bank.
6
The World Bank (2015), World Data Bank
2JORDAN: COMPANY PERSPECTIVES
The farming sector represents 4.2% of Jordan’s economy today. Agriculture contributed more than 10%
of GDP in the 1960s, but narrowed to record low share of 2.3% in 2001. Agricultural production has
multiplied by almost 10 times in the past 15 years. The industry and services sectors account for 29.6%
and 66.2% of GDP, respectively.
Jordan benefits from large-scale investments by the Gulf countries that reached $3.5 billion in 2006. 7
Foreign direct investment has declined since then due to the international economic crisis and regional
instability. Foreign direct investment inward flow reached $2.2 billion and then decreased on annual
basis, reaching $1.5 billion in 2016 according to the United National Conference on Trade and
Development (UNCTAD).
The country’s population grew by 87% over a decade and reached 9.5 million in 2015, of which 6.6
million are Jordanians. 8 Jordan's young and skilled population is one of its assets: 70% are under age
30. Political stability and skilled labour mean Jordan is a gateway for trade and business.
Trade patterns
Jordan is a member of the both World Trade Organization (WTO) and the Organization of Islamic
Conference. Strong trade relations, supported by preferential rate agreements, were in place until the
2008 global economic crisis. Political turmoil, mainly in Iraq and Syria, has disrupted regional and
international trade.
Transport is a vital sector in the economy, contributing 10% of GDP. Jordan’s location – with its 90,000
km² of land, road network and connections with neighbouring countries – makes transport strategic in
trading. Jordan is considered a regional transport hub between Gulf markets and eastern nations, and
to Turkey, Europe and Iraq. The transport sector contributes to economic growth, and the Government
has an ambitious plan for its development.
Aqaba, administered by the Aqaba Special Economic Zone Authority, is a low-tax, duty-free city. Aqaba
Port’s importance has grown due to restrictions at Jordan’s land borders with Syria and Iraq. Despite
the higher costs, Western markets and North Africa are accessed by sea rather than by land.
Turmoil in Iraq and Syria has caused substantial losses in Jordan, according to the Jordan Truck
Owners Association. Before 2003, 400 trucks laden with commodities entered Iraq every day, and a
similar number crossed into Syria daily before its crisis. The Karameh-Tureibil border crossing between
Jordan and Iraq, the gateway for Jordanian products to reach Iraqi and European markets, was closed
in 2015. More than 6,000 trucks of the 17,000-truck fleet are “almost idle” today.
Exports
Table 1 Export sectors: shares and evolution
Annualized
Export values in Export shares
Sector growth rate
2015 (in 000 USD) in 2015
(2009–2015)
Agricultural products 1,559,934 21.8% 7.0%
Chemicals 2,275,337 31.8% 3.8%
Computer, telecom, electronic components 286,619 4.0% -2.4%
Fabrics, clothing and leather 1,504,931 21.1% 8.6%
Metal and other basic manufacturing 397,668 5.6% -1.3%
Miscellaneous manufacturing 929,064 13.0% 1.4%
Transport equipment 190,193 2.7% -4.8%
Total 7,143,746 100.0% 4.0%
Source: ITC, Trade Map, 2016.
7
UNCTAD Stat, http://unctadstat.unctad.org
8
Jordan Department of Statistics.
3JORDAN: COMPANY PERSPECTIVES
The main export sectors in Jordan are processed and unprocessed agricultural goods, chemicals and
clothing (Table 1).
Raw agricultural products such as fresh fruits, vegetables and live sheep, together with processed
goods including prepared foods, comprised 21.8% of Jordan exports in 2015. Chemicals such as
medicaments and fertilisers represented 31.9% of exports that year. About 70% of chemical sales are
exports destined mainly for Arab countries like Saudi Arabia or Algeria.
Special garments, t-shirts and tracksuits represent the biggest share in Jordan’s textile and garment
industry, which represented 21.1% of annual exports. This is due mainly to the free trade agreement
with the United States for exports from the Qualifying Industrial Zones – industrial parks that house
manufacturing operations.
These three sectors enjoyed the highest export growth rate from 2009–2015. The annualized growth
rate (Table 1) shows how much each sector evolved on average during the considered period.
Figure 2 Evolution of export values
$ billion
5.0
4.0
3.0
2.0
1.0
0.0
2009 2010 2011 2012 2013 2014 2015
Asia EU28 LAS North America Rest of the world
Source: ITC, Trade Map, 2016.
Exports to members of the League of Arab States (LAS) grew until 2014 (Figure 2), when the political
situation in neighbouring countries deteriorated. Exports to Iraq decreased 41% in 2015 and to Syria,
38%. Increased trade with Saudi Arabia and Kuwait partially compensated for declines in exports to
other Middle Eastern countries.
Figure 3 Evolution of export shares
60%
50%
40%
30%
20%
10%
0%
Asia EU28 LAS North America Rest of the world
Share 2009 Share 2015
Source: ITC, Trade Map, 2016.
Trade with North America – mainly the United States – increased from 2009–2015 while trade with the
LAS tapered off (Figure 3).
4JORDAN: COMPANY PERSPECTIVES
Although trade with the European Union (EU) remains quite low, at just 3%, Jordanian companies –
encouraged by the Government – are trying to diversify their partners and see the EU as a destination
with potential. Jordan’s authorities point to the challenging requirements and standards imposed by
European markets, especially on rules of origin.
In July 2016, Jordan extended an agreement to relax the rules of origin for 52 product groups of
Jordanian exports to the EU manufactured in the 18 development zones. 9 The main objectives are to
attract more investment in the industrial sector, increase exports to Europe, create jobs for Jordanian
and Syrian workers after the Syrian crisis, and integrate more Syrian refugees in the labour force.
Imports
Table 2 Import sectors: shares and evolution
Import values Annualized
Import shares
Sector in 2015 (in 000 growth rate
in 2015
USD) (2009–2015)
Fresh food and raw agro-based products 2,021,014 12.9% 11.0%
Processed food and agro-based products 1,939,301 12.4% 6.1%
Wood, wood products and paper 583,698 3.7% 3.0%
Yarn, fabrics and textiles 845,118 5.4% 8.5%
Chemicals 2,259,276 14.5% 6.0%
Leather and leather products 108,416 0.7% 10.2%
Metal and other basic manufacturing 1,784,656 11.4% 2.7%
Non-electric machinery 1,413,792 9.1% 6.2%
Computer, telecom, consumer electronics 792,990 5.1% 3.7%
Electronic components 601,744 3.9% 4.2%
Transport equipment 1,894,770 12.1% 2.9%
Clothing 454,371 2.9% 7.3%
Miscellaneous manufacturing 917,561 5.9% 6.0%
Total 15,616,707 100.0% 5.6%
Source: ITC, Trade Map, 2016.
Jordanian imports topped $15 billion in 2015, with raw and processed food making up almost $4 billion
of the total. Imports of foods such as cereals, live animals, sugar and food preparations grew in the six-
year period to represent a bigger share of overall imports. Imports of chemicals including polyethylene
and medicaments were worth almost $2.3 billion, followed by vehicles and transport equipment at $1.9
billion.
Beyond the survey scope, it is worth mentioning that Jordan imports 97% of its energy and fuel. Costs
for imported energy fell 40.6% to $3.7 billion in 2015 and constituted about 17.8% of total imports.
9
http://europa.eu/rapid/press-release_IP-16-2570_en.htm
5JORDAN: COMPANY PERSPECTIVES
Figure 4 Imports per partner region
7,000,000
6,000,000
5,000,000 Asia
EU28
4,000,000
LAS
3,000,000 Latin America
2,000,000 North America
1,000,000 Rest of the world
0
2009 2010 2011 2012 2013 2014 2015
Source: ITC, Trade Map, 2016.
Jordan continues to import large quantities of high-value goods from Asia (Figure 4). Imports of products
such as electronics, garments and metals from Asia – China in particular – amounted to $6.2 billion and
made up 40% of total imports in 2015.
Trade agreements and tariffs
Trade agreements
Jordan’s foreign trade policy is based on economic openness and integration into the rapidly globalizing
world economy. Economic partnerships are considered necessary to achieve mutual interests and fair
dividends.
Today, Jordan is at the forefront of the liberal Middle Eastern countries that gained wide respect and
recognition for their reforms and economic endeavours. The country has established a network of free
trade agreements with major economic blocs worldwide, offering a gateway to more than a billion
consumers.
Table 3 Jordan’s main trade agreements
Dated of Date of Entry
Agreement
Signature into Force
Greater Arab Free Trade Area 19/02/1997 01/01/1998
United States free trade agreement 24/10/2000 17/12/2001
EU association agreement – Barcelona Declaration 24/11/1997 01/05/2002
Singapore free trade agreement 16/05/2004 22/08/2005
Agadir Agreement (Egypt, Jordan, Morocco and Tunisia) 25/02/2004 06/09/2006
Turkey free trade agreement 01/12/2009 01/03/2011
Canada free trade agreement 28/06/2009 01/10/2012
European free trade agreement 21/06/2001 01/09/2002
Jordan-EU simplified rules of origin 19/07/2016 19/07/2016
Source: ITC, Market Access Map, 2016.
The United States and Jordan signed a free trade agreement in 2000 that entered into force in 2001. It
gives products manufactured in Jordan’s Qualifying Industrial Zones duty-free access to the US market.
Jordanian exports to the US, especially of garments and textiles, grew markedly as a result.
6JORDAN: COMPANY PERSPECTIVES
Jordan negotiated its most recent trade deal with the EU to ease rules of origin for a decade, through
2026. The initiative allows Jordanian goods to contain more than 70% of non-local materials. Rules of
origin were relaxed for exports that are manufactured in 18 designated development zones and
industrial areas and estates in Jordan, including for 52 product groups in industrial goods. This allows
most Jordanian products to enter the EU market.
Trade policy reviews, mandated in the WTO agreements, are an exercise to examine and evaluate
member countries' trade and related policies. The latest review of Jordan took place in November
2015 10 and found: “Jordan has been affected by severe exogenous shocks that have led to large
numbers of refugees fleeing to Jordan, disrupted trade routes, and affected inward investment. Despite
these problems, Jordan has maintained an open economy with the value of trade in goods and services
(imports and exports) greater than GDP, the economy has grown and reforms to improve the trade and
investment climate have continued.”
Tariffs and preferences
Table 4 Applied tariffs and preferences
Diversification
Average MFN rate of Preferential
95% trade in no. Duty-free imports
traded tariff lines margin
of
Major markets Share of
Value
HS 2- HS 6- Simple Weighted Weighted tariff
share
digit digit (in %) (in %) (in %) lines
(in %)
(in %)
Agricultural products
1. Saudi Arabia 16 42 5.7 1.9 1.9 100 100
2. United Arab Emirates 12 31 6.6 45.7 45.7 100 100
3. Israel 6 11 12.9 12.9 9.6 76.9 62.0
4. Kuwait 15 42 3.8 1.9 1.9 100 100
5. Qatar 13 39 5.4 1.1 1.1 100 100
Manufactured products
1. United States 6 36 6.4 23.1 23.1 100 100
2. India 5 9 8.4 5.7 0 3.5 1.1
3. Saudi Arabia 29 127 4.7 3.5 3.5 100 100
4. European Union 30 87 4.4 3.7 3.7 100 100
5. Israel 18 43 4.9 1.2 1 78.6 98.2
Source: WTO, World Tariffs Profiles, 2016.
The exports of Jordan are quite diversified with its main partners as the number of different products
needed to reach 95% of the bilateral trade is high. When exporting to Israel, however, the diversification
index shows the trade is more concentrated on a limited number of products: 11 different HS6 represent
95% of the exports to this destination, whereas for Saudi Arabia for example, 95% of the trade is
covered with the 42 biggest exported products to that destination.
Saudi Arabia applies a preferential zero percent rate to Jordanian agricultural and manufactured
imports. GAFTA allows Jordan to benefit from the same duty-free conditions when exporting to other
Arab countries such as the United Arab Emirates, Kuwait and Qatar.
10
https://www.wto.org/english/tratop_e/tpr_e/tp425_e.htm
7JORDAN: COMPANY PERSPECTIVES National trade and development strategies Trade promotion and facilitation The Government’s priorities are to implement the Jordan Compact, develop fast-track infrastructure and identify and agree on flagship investment deals. The Jordan Compact provides the country with $1.8 billion in grants and loans from the EU as well as preferential trade terms for certain products from Jordanian businesses employing at least 15% Syrian refugees. In exchange, Jordan will expand educational and economic access for Syrian refugees in the country. National development framework and Vision 2025 Vision 2025 is a national strategy to structure economic and social work under the noble principle of rule of law and equal opportunity. The plan aims to increase participatory policymaking, achieve fiscal sustainability and strengthen institutions. It targets a 7.5% growth rate and a reduction in poverty and unemployment by 8% and 9%, respectively, by 2026. Stakeholders include the Jordanian Government, the private sector and civil societies. Figure 5 Vision 2025: national vision and strategy goals Source: Jordan Relaunched, www.jorelaunched.jo, 2015. Jordan's ranking on rule of law under the World Bank’s worldwide governance indicators has improved in recent years, rising to 68 in 2015 from 82 in 2009. However, the ease of doing business in the country fell to 118 in 2017 from 101 in 2009. Despite this drop in ranking, the country still shows a high level of resilience, considering political developments in the region that, as described previously, affected trade patterns and reduced income. Jordan improved its ranking by 15 positions to 103 in 2018, which could be seen as promising progress given the context in which the country operates. 8
JORDAN: COMPANY PERSPECTIVES

CHAPTER 2              SURVEY METHODOLOGY AND
                       IMPLEMENTATION IN JORDAN

                                                                                                            © Shutterstock
Survey implementation and sampling

Timeline and principal counterparts
The NTM survey began in April 2015 following a request by the Ministry of Industry, Trade and Supply
(MITS). ITC selected Ipsos Jordan to carry out interviews and collect information from commercial firms.
Before data were captured, the ITC team provided a one-week training and technical guidance on NTMs
and the survey methodology to 10 staff members of Ipsos Jordan. Telephone and face-to-face
interviews with Jordanian companies took place until July 2016.

MITS was a partner throughout the process, offering local guidance and support. ITC and the ministry
jointly organized several meetings with local stakeholders. A national roundtable was held in Amman
on 29 November 2016 to validate the survey results, promote dialogue on burdensome NTMs and
procedural obstacles, and formulate recommendations for policy action. The workshop agenda and a
list of participating stakeholders are in Appendix IV and V.

Survey process
The first step was to identify local companies that had traded internationally in the previous 12 months.
ITC compiled registers of exporters and importers from MITS, multiple chambers of commerce and
industry, and from a list of active companies registered in the Aqaba Special Economic Zone Authority.
This resulted in a register of some 6,000 firms that included the names of company contacts and the
main sector of activity. This information was used to define the stratified random sampling to be applied
in Jordan to determine how many interviews should be conducted in each sector. Following this process
ensured the quality and the precision of the results.

The local research company first interviewed companies to capture basic information and then
conducted face-to-face interviews with those facing NTMs.

                                                                                                       9
JORDAN: COMPANY PERSPECTIVES
Survey design and scope
ITC designed the NTM survey to cover all sectors in Jordan. Smaller industries were not excluded, but
were merged and counted as new, larger sectors. This implies that these new sectors will reach a
precision similar to others. However, even if these smaller industries are included, it is not
recommended to draw conclusions only based on this small subset, as the precision of the results will
not be sufficient.
The survey aimed to single out the specific NTMs that affect exports, so all companies interviewed were
active exporters. NTMs related to imports were identified as well when businesses were active in both
exporting and importing, but the sample did not include interviews with companies that only import.
Eighty-four percent of interviewed companies were exporting and importing, while 16% were exporting
only.
The survey did not include businesses involved in cross-border trade in services such as tourism,
banking, finance, telecommunications or business process outsourcing. 11
Figure 6 Overview of surveyed companies
Phone screening interviews
Companies facing restrictive regulations
Companies in the face-to-face interviews
0 100 200 300 400 500 600
Exporting and importing companies Exporting companies
Source: ITC, NTM Business survey in Jordan, 2015–2016.
Phone interviews
Phone interviews are referred to as phone screening in this report. A total of 570 registered companies
were approached for a phone screening. Most (479 firms) have both exporting and importing activities
and 91 are only exporting. Of the total, 367 companies, or 64%, said they had been affected by
restrictive regulations when they imported or exported in the past year.
Each phone screening takes an average of six to eight minutes to identify a company’s main export and
primary trading partner, and to determine whether if it faces burdensome regulations. The data gathered
at company level included the number of employees and destination/origin market, as well as gender-
related information (firm management, ownership and employment), abiding by ITC’s gender-related
rules and regulations.
Face-to-face interviews
Ipsos then met with companies that faced burdensome NTMs and were willing to share their
experiences. The confidential interviews, which captured specific details, were carried out according to
the standard ITC questionnaire that had been localised and translated in Arabic. The interviewees were
mainly directors and people in charge of the import-export process.
More than half of the companies that reported facing restrictive regulations (56%) participated in the
second part of the survey, leading to 207 face-to-face interviews. These took an average of 40–60
minutes each. The questions addressed all traded products and partner countries; burdensome
regulations (description, official name, category of NTM, implementing body and applying country);
11 A survey on trade in services requires a different methodology which is under consideration and may be developed soon.
10JORDAN: COMPANY PERSPECTIVES
related obstacles (description, category of obstacles, implementing agency and location); and
recommendation to overcome the obstacles.
Company profiles
Size and location of participating companies
Figure 7 Company size and location
NA Zarqa
Large 4% Micro 9% Amman
11% 18%
Aqaba
Free Zone
Medium
26% Irbid
Small Zarqa
Amman
41% 85% Other
Source: ITC, NTM Business survey in Jordan, 2015–2016.
Most of the 570 companies that were interviewed by telephone were small businesses (230 or 41%),
followed by 149 medium-sized firms (26%) as shown in Figure 7. There were 104 representatives from
micro enterprises and 64 from large companies. The following size classification is used in the report:
micro enterprises have five or fewer employees; small enterprises have six to 20; medium-sized
enterprises have 21 to 100, and large enterprises have 101 employees or more.
Eighty-five percent of interviewed companies are in the capital, Amman Governorate, and 9% are in
Zarqa. The survey took into consideration the geographical distribution of companies across the country
and efforts were made to interview businesses in different areas. The results reflect the centralisation
and concentration of headquarters in Amman.
Main partner regions
A clear majority of exporting companies named Arab states as their main export destination. A company
derives the lion’s share of its sales from the main destination, though it could also export to other trade
partners. This distribution does not precisely reflect the value of trade or the importance of the main
destination relative to others, but rather serves only to identify exporters’ main partners.
Importers have a more diversified basket of partners than exporters. Asia, and China in particular, is
the main supplier of 39% of Jordanian importers, followed by Europe (about a third) and the LAS (17%).
Women as workers and managers
The fact that 43% of Jordanian companies employ only men implies a low share of female workers per
company. On average, 14% of all employees are women (Figure 8). The biggest enterprises have the
most female workers, and 32% of these companies employ more women than men. This share drops
to 9% for medium-sized firms and 4% and 2% for small and micro companies, respectively.
Few women are in top management positions at these trading companies; only 8% are owned and/or
managed by a woman.
11JORDAN: COMPANY PERSPECTIVES
Figure 8 Shares of female employees and managers/owners
8%
14%
Women
Men
86% 92%
Source: ITC, NTM Business survey in Jordan, 2015–2016.
Captured data and method of evaluation
Product and partner identification
Companies that wanted to participate in face-to-face interviews provided a list of their products using
the Harmonized System at the six-digit level and the destination country (for exports) or country of origin
(for imports). Each pair of product and partner country is referred to as ‘product-partner trade flow’.
For each product-partner trade flow, companies were asked to provide additional information about the
NTMs they faced. This enabled the interviews to categorize the described NTMs and related procedural
obstacles following the classification in Appendix II. The final step of data analysis is to calculate
frequency and coverage statistics, taking account of product and sector, the main NTM category –
technical or quality-control measures, for example – and company characteristics mentioned above.
Quantifying NTMs and POs: the case definition
Most frequency and coverage statistics are defined by ‘cases’ that reflect the least aggregated category
of the analysis. Each representative interviewed in person faced at least one burdensome NTM. A case
is then counted by the type of NTM, who imposed it, the product affected and the company reporting
the measure. If, for example, a company reports that one partner country applies the same NTM to
three of its products, this is recorded as three separate cases. If two firms report that they face the same
issue, this is counted as two separate cases. This counting system makes the individual cases the most
disaggregated in the analysis of the NTM surveys.
Case counting also took into consideration whether the exporting or importing country applied the NTM.
When several importing countries apply the same type of measure on Jordanian goods, each case is
recorded separately because the detail and the specifics of the NTM are presumed to vary between
markets. But such cases are counted as one when the reported NTM is imposed locally.
PO cases follow the same counting system. Problems related to the business environment are
calculated at the company level and are listed separately, even though sometimes they were closely
related to NTM statistics. For example, pre-shipment requirements may cause unexpected delays.
Although POs are directly related to a given NTM, inefficiencies in the business environment occur
irrespective of the NTMs.
12JORDAN: COMPANY PERSPECTIVES
CHAPTER 3 THE COMPANY PERSPECTIVE
© Shutterstock
Results of the initial phone screening indicate that NTMs affect the trading operations of 367 companies.
This chapter covers companies’ perspectives about the major obstacles they face, based on their own
experiences.
Most companies in Jordan say NTMs impede trade
Burdensome NTMs affect 64% of Jordanian enterprises (Figure 9) when they export or import. This
means such measures impede trade in Jordan more than in other countries (48% on average), including
other surveyed Arab states. A company is considered affected if at least one of its products faced an
obstacle during cross-border trade in the 12 months preceding the survey (cf. Appendix I for details).
Companies mainly active in exporting or importing agricultural products are more affected (48% in both
trade flows) than those in the manufacturing sectors (42% and 38%, respectively). These sectoral
differences are less pronounced in Jordan than in other countries that were surveyed.
Figure 9 Breakdown of companies affected by NTMs
All companies 64% 36%
Agriculture
Exports
48% 52%
Manufacturing 42% 58%
Agriculture 48% 52%
Imports
Manufacturing 38% 62%
0% 10% 20% 30% 40% 50% 60% 70% 80% 90% 100%
Companies affected Companies not affected
Source: ITC, NTM Business survey in Jordan, 2015–2016.
NTMs affect large exporters in Jordan more frequently than small ones (Figure 10). Bigger companies
export more products and ship to more destinations, so it is logical that they face a greater number of
NTMs.
13JORDAN: COMPANY PERSPECTIVES
Figure 10 Affectedness based on exporter size
Micro 28%
Small 37%
Medium 51%
Large 69%
0% 10% 20% 30% 40% 50% 60% 70% 80%
Source: ITC, NTM Business survey in Jordan, 2015–2016.
The number of product-partner trade flows 12 is linked to a company’s size. Micro companies report 2.8
product-partner flows on average while larger firms report 4.3. Table 5 is based on information collected
during the face-to-face interviews, when a company, products and partners are identified.
Table 5 Average number of product-partner trade flows per size
Average number of
Company size product-partner trade
flows
Micro 2.8
Small 3.1
Medium 3.1
Large 4.3
Total 3.3
Source: ITC, NTM Business survey in Jordan, 2015–2016.
The magnitude of the impact of NTMs varies depending on the number of product-partner trade flows;
exporters with the fewest have more difficulties coping with regulations. On average, about half of the
trading operations of exporters with seven or more product-partner flows are affected (Table 6). On the
other hand, NTMs affect more than 80% of the trading operations of a company with three or fewer
product-partner flows.
Table 6 Share of affected product-partner flows
Number of product- Average share of
partner trade flows affected flows
1-3 82%
4-6 67%
7-more 50%
All companies 75%
Source: ITC, NTM Business survey in Jordan, 2015–2016.
This result indicates that bigger companies either tend to diversify destinations for their goods or acquire
experience to manage the regulations and their trading operations more efficiently.
12 A company exporting three different products to two different partners will have 3x2 = six product-partner trade flows.
14JORDAN: COMPANY PERSPECTIVES
Small differences between agriculture and manufacturing also emerge when specific sectors are
examined (Figure 11). Companies are probably affected similarly across sectors because they face
cross-cutting issues rather than sector-specific problems. This means that, regardless of the sector,
companies will follow similar procedures to comply with requirements and will face similar difficulties.
This finding is confirmed by the low share (2%) of technical requirements (Table 7). These NTMs,
directly linked to the traded product, represent a very small share of all reported burdensome
regulations.
Processed food is the most affected export sector, with 51% of the companies reporting onerous NTMs.
Foods that fall into this category include prepared or processed bovine meat, sauces and sweets. The
sector covering information technology equipment and electronic components is the least affected
(27%), though it is quite small in terms of export value ($300 million in 2015).
In terms of imports, the biggest impact is felt in the fresh food and processed food sectors (50%).
Processed vegetables used for animal feed and flavouring by the food and drink industries are affected
more than other imports. NTMs have little impact on imports of vehicle or transport equipment (16%).
Figure 11 Affectedness per sector
Fresh food and raw agro-based products 46%
51%
Processed food and agro-based products 51%
50%
Fabrics, clothing and leather products 47%
32%
Chemicals 47%
37%
Computer, telecom., electronics & electronic comp. 27%
39%
Metal and other basic manufacturing 44%
44%
Transport equipment 28%
16%
Other miscellaneous manufacturing 46%
44%
0% 10% 20% 30% 40% 50% 60%
Companies affected by NTMs when exporting Companies affected by NTMs when importing
Source: ITC, NTM Business survey in Jordan, 2015–2016.
Most companies (86%) consider Arab states as their main export partners in terms of value (Figure 12),
though total trade to this region accounts for just 51% of Jordanian exports. Only 4% or fewer of the
exporters see other regions of the world – such as the EU, Asia and North America – as their most
important destinations.
15JORDAN: COMPANY PERSPECTIVES
Figure 12 Main exporting and importing partner regions
League of Arab States 86% 17%
Europe 4% 32%
Asia 4% 40%
North America 3% 7%
Rest of the world 2% 3%
Sub-Saharan Africa 1% 1%
100% 80% 60% 40% 20% 0% 20% 40% 60%
Exports Imports
Source: ITC, NTM Business survey in Jordan, 2015–2016.
Asia and Europe are the chief suppliers of goods to Jordan, with respectively 40% and 32% of importers
identifying these regions as their main partners. The Arab states are the main suppliers for 17% of the
companies.
Agricultural exports face most NTMs
NTMs hinder 43% of Jordanian exporters. This share varies slightly between sectors: NTMs affect 42%
of exporters in manufacturing and 48% in agriculture.
Figure 13 Affectedness when exporting
All exporters 43% 57%
Manufacturing sectors 42% 58%
Agriculture sectors 48% 52%
0% 10% 20% 30% 40% 50% 60% 70% 80% 90% 100%
Companies affected Companies not affected
Source: ITC, NTM Business survey in Jordan, 2015–2016.
Partner countries and transit countries apply most NTMs on exports (69%), with Jordanian authorities
imposing the remainder. This proportion is similar to what has been observed in other surveyed
countries, where domestic authorities apply about a quarter of the burdensome regulations.
Figure 14 Country applying regulations on exports
6%
Partner Country
31%
Jordan
Transit Country
63%
Source: ITC, NTM Business survey in Jordan, 2015–2016.
16JORDAN: COMPANY PERSPECTIVES
The type of NTMs companies face varies according to industry, as some requirements are more
relevant to certain sectors than others (Figure 15). Conformity assessment regulations are the most
burdensome measures for exporters of agricultural goods, accounting for more than a third of all NTMs.
They are less predominant in manufacturing (14%).
In general, companies across all sectors reported few technical requirements. This can be seen as an
sign that Jordanian goods are export-ready in terms of quality. If technical requirements are not an issue
for exporters, this means they can meet the minimum standards imposed by trading partners. This NTM
represents 2% of all reported agricultural cases and 3% of manufacturing cases. This shows that the
quality of Jordanian products is not an issue, but proving quality through conformity assessments is a
problem.
Exporters of manufactured goods report more NTMs related to rules and certificates of origin than those
in the agricultural sector. Rules of origin are often more straightforward when it comes to food products
than in manufacturing.
Figure 15 Type of NTMs per sector
Agriculture Manufacturing All exporters
2% 3% 2%
3%
14% 2%
28% 22%
31%
36% 33%
22%
19%
18%
24%
14% 27%
Technical requirements Conformity assessment
Pre-shipment inspection/entry formalities Rules/certificate of origin
Export related measures Other measures
Source: ITC, NTM Business survey in Jordan, 2015–2016.
Rules of origin challenge many exporters
Partner markets’ NTMs are the source of 63% of all burdensome regulations, rules of origin and related
certificate of origin identified as the biggest obstacles (23% of NTM cases). Certification and testing
requirements under the conformity assessment follow, at 11% and 10%, respectively.
17JORDAN: COMPANY PERSPECTIVES
Table 7 The most challenging NTMs
Origin of Share
the NTM Chapter Measure Category Code of NTM
NTMs cases
Technical requirements 2.4%
Product certification 11.0%
Conformity assessment
Testing 10.2%
Pre-shipment inspection 8.8%
Partner Pre-shipment inspection and
other entry formalities Other pre-shipment inspection and other entry
4.5%
formalities
Rules of origin and related
Rules of origin and related certificate of origin 23.4%
certificate of origin
Other measures 2.6%
Pre-shipment inspection and
Pre-shipment inspection 5.3%
Transit other entry formalities
Other measures 0.8%
Export inspection 4.3%
Certification 5.3%
Jordan Export related regulations Tax refund 4.1%
Export taxes and charges 3.9%
Other export related measures 13.4%
Total 100%
Source: ITC, NTM Business survey in Jordan, 2015–2016.
Of the 309 reported NTMs that partner countries impose
on Jordanian exporters, 115 involve rules of origin and Certificate of origin for each copy of invoice is
required for local use only [...] this is costly and
related certificates of origin. Related obstacles include the time consuming.
large number of required documents and high fees and
charges to certify or regulate agriculture products. One- Exporter of office furniture
third of burdensome NTMs applied by partners are
conformity assessments and about 21% are pre-
shipment inspections and other entry formalities.
Required tests take a long time to be finalised
and laboratories are limited, which delays the
For example, companies say that exporting agricultural
exporting process, and this affects agriculture
products to the State of Palestine and Saudi Arabia is products’ quality.
time-consuming and costly because of the way their
authorities inspect the goods and handle samples. This Exporter of vegetables
affects the quality of the exports and leaders to higher
costs for traders.
Lack of care by customs staff in country and
Transit regulations account for 6% of reported NTMs. transit markets with poor refrigerating facilities
These are primarily Saudi regulations when exporters sell affects the quality and price of exported
to companies in Gulf countries (including Saudi Arabia as agriculture products.
a final destination). Many of these NTMs are pre-
shipment inspections, i.e. controls by Saudi Customs and Exporter of fruits
the way assessments are carried out lead to partial loss
of the shipments.
When it comes to domestic regulations, 30% of NTM cases pertain to export-related regulations
categorized into inspection, certification, value-added tax refund, and export taxes.
18JORDAN: COMPANY PERSPECTIVES
Table 8 Share of trade, NTMs and affectedness per destination
Jordan exports Surveyed Share of Share in
NTMs
companies affected total
applied by
Region Destination exporting to companies reported
this
Value in this to this NTM
Share destination
2015 (in destination destination cases (%)
(in %)
000 USD)
Saudi Arabia 1,155,385 16 113 60 101 32.6
Iraq 747,560 10 97 57 75 24.3
United Arab
368,527 5 47 45 27 8.7
Emirates
League Kuwait 306,579 4 40 35 16 5.2
of Arab
States State of
133,524 2 29 38 13 4.2
Palestine
Egypt 107,965 2 20 40 12 3.9
Qatar 157,714 2 30 27 11 3.6
Other LAS
709,734 10 99 26 31 10.0
countries
United States
North 1,442,742 20 20 35 7 2.3
of America
America
Canada 54,351 1 7 14 1 0.3
Asia 762,628 11 20 15 4 1.3
EU28 213,738 3 30 20 7 2.3
Rest of the World 983,299 14 17 24 4 1.3
Total 7,143,746 100 309 100.0
Source: ITC, NTM Business survey in Jordan, 2015–2016.
Arab markets are often difficult to access
Arab markets remain challenging for Jordanian exporters,
Each copy of the certificates of origin requires
even though GAFTA came into existence in 1997.
to be stamped by the Iraqi Embassy in
Countries in the League of Arab States are the source of Amman, this is costly and time consuming.
93% of all NTMs that Jordanian traders face, even though
only 53% of Jordanian exports are destined for this Exporter of metal tubes
region.
The main destinations for Jordanian exports, which were […] when exporting to Saudi Arabia, the
worth $7.1 billion in 2015 13, are the League of Arab States classification is not always right which leads to
(primarily Saudi Arabia, Iraq, United Arab Emirates, a new set of testing which required additional
Kuwait and Qatar) and the United States. These two payments and time delays […]
export destinations account for 51% and 20% of the
export value, respectively. Exporter of perfumes
Figure 16 compares the share of exports channelled to the main exporting markets with the share of
NTMs they face during the exporting process. It shows that Saudi Arabia, which bought 16% of
Jordanian exports in 2015, is more difficult to access than the United States, which bought 20%.
However, Saudi Arabia applied 33% of NTMs while the United States imposed only 2%. Similar
conclusions can be made by analysing other LAS members. For example, Iraq accounts for 10% ($700
13
See www.TradeMap.org for more details.
19You can also read