IR Presentation Explore the Kontron Group - February 2023

Page created by Neil Mack
 
CONTINUE READING
IR Presentation Explore the Kontron Group - February 2023
Explore the
Kontron Group
We are a fast-moving
multinational
technology leader.

IR Presentation
February 2023
IR Presentation Explore the Kontron Group - February 2023
Focused on the large, diverse and growing Industrial IoT market (IIoT)
Pure-Play Leader of
Smart Industrial IoT
                                                                             Fully integrated technology platform addressing high-growth end markets
Solutions                                                                    Integrated (SW+HW) solutions for smart factories, transportation, data connectivity, medical and smart energy

                                                                             Custom-built solutions for high-growth Industrial IoT end markets
                                                                             Industrial, Communications, Medical, Smart Energy and Transportation

 Member
 of SDAX®                       1.2bn                            4,343
   HQ in Austria;
                                                                             Driven by customers success, leading disruptive technologies, blue-chip customers
                                2022 Revenue                       2022
listed in Germany                  (EUR)                         Employees
                                                      60m
                    >10%                         60m
                                                  Net Profit
                                                   (EUR)
                      oranic                   2022 Net result               Leading provider of disruptive IoT connectivity technology
                    growth pa                      (EUR)                     Real time 5G/6G connectivity, susietec® Toolset, over 3,200 SW/HW engineers

                                                                                                                                                                                             2
IR Presentation Explore the Kontron Group - February 2023
Transformation update – 2022 summary
Highlights                                            Lowlights

    ›   Divestment of IT Services                       › Chip shortage: EUR 124M
        completed                                           of delayed but not lost orders

    ›   EUR 350M+ of net cash                           ›   EUR 120M Cash drain until Q3 –
        expected from transaction                           for disruptive supply chain

    ›   Big leap in IoT focus and                       ›   Russian war: >50% of business
        clean up of legal structure                         in region stopped
    ›   Strong customer momentum -
        backlog of EUR 1.4bn and book-
        to-bill ratio of 1.3x for 6 quarters   2022

                                                                                             3
IR Presentation Explore the Kontron Group - February 2023
The New Kontron –
Before and after IT divestment

                                    S&T AG 2021            New Kontron 2023    Comment

    Company name                    S&T AG                 Kontron AG          Changed at AGM May 2022 – S&T related to IT biz; Kontron to IoT products
                                                           25% of Revenue (22)
    Divestment                                                                 392M divestment price equal 38% of current market cap (1040M)
                                                           28% of EBITDA (22)
    Entities (as of operative)      88 (78)                42 (32)             Much less complex structure with no relevant minorities
                                                                               Not material anymore, East European activities within EU drastically
    Exposure CIS region             7% CIS                 3%
                                                                               reduced

    Peer group

    Our                 01   REFOCUS                             02 REBRAND                          03    IMPROVE NET PROFITS
    targets                  Disruptive IoT Technologies                                                   Increase Net profit margins by 60%
                             5G – smart factory – AI                                                       2021 (3.6%) – 2023 (5%) – 2025 (7%)

*Management estimates                                                                                                                                     4
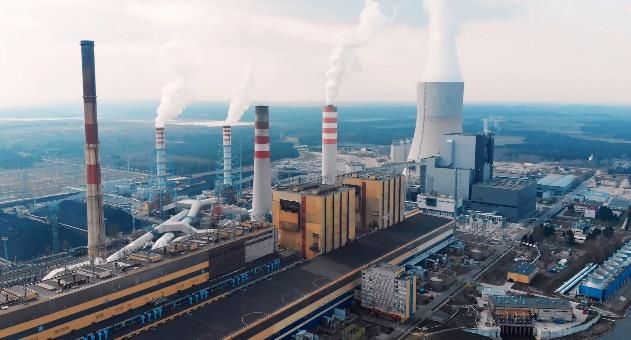
IR Presentation Explore the Kontron Group - February 2023
The New Kontron –
Before and after IT divestment (cont’d)

                                                                *   Comment

                              S&T AG 2021      New Kontron 2023
                                                                    Reflects divestment of EUR 392M in IT service and EUR 40M in
    Revenues (EUR M)          1,342            ~ 1,200
                                                                    Russia
    Order backlog             1,334 (Dec-21)   1,395 (Sep-22)       IT divestment already replaced by new IoT orders

    Design win pipeline       3,367 (Dec-21)   3,318 (Sep-22)       Strong IoT design win pipeline

    Gross margin (%)          36%              > 40%                Change in product mix, will further increase margin after 2023

    Net profit (EUR M)        48.3 (3.6%)      > 60 (5%)            Will increase in 2023 despite divested IT services

    Employees (#)             6,206            4,343                Decline driven by project “Focus” and departure from Russia

    Revenue / FTE (EUR K)     216              276

    Equity ratio              32%              > 45%
    Cash & cash equivalents                                         Increased cash and less total assets, includes holdback
                              296              600
    (EUR M)

*Management estimates                                                                                                                5
IR Presentation Explore the Kontron Group - February 2023
The IoT Market

        Key Metrics
                                                                                                                                                  Focus
           29 billion                                            $ 148.6 billion                                                         industries        Smart Factories
           CONNECTED DEVICES BY 2022                             INDUSTRIAL IOT REVENUE
           with 64 billion IoT devices                           with a 11.4% CAGR from 2022
           worldwide by 2025

           31% growth                                            21% adoption
           MACHINES CONNECTED                                    OF 5G ACROSS MOBILE
                                                                                                                               Ports
           to the Internet by 2025                               INTERNET CONNECTIONS                                          Transportation
                                                                                                                               SMART STORAGE & LOGISTICS    Transportation
                                                                  by 2025
                                           75bn

                             20bn
                4bn

               2016          2020          2025

                                                                                                                               Smart Energy                Mining
                                                                                                                                                             Medical
                                                                                                                                                           INDUSTRY

 High entry barriers: single source customization – real time Software – expensive customer products with low volume

Sources: Mgmt. estimates, Techjury, Ericsson, Enterra Solutions, Markets and Markets, Market Data Forecast, McKinsey Global Institute, Statista                              6
IR Presentation Explore the Kontron Group - February 2023
Kontron offers differentiated IIoT solutions
    Our competitive landscape                                                   Our distinctive competitive advantages

  Selected competitors in Industrial               Revenue      Region
  IoT                                              (in USD M)                        ›   Unmatched R&D scale
  Mercury*                                           3,800      North America            › 3,200 FTE, budget EUR 170M
  Curtiss Wright*                                    2,500      North America        ›   Cost efficient solutions
  Advantech                                          1,900      Asia                     ›   (45k p.a.) in-house engineering resources in CEE
  Kontron*                                           1,342      Europe
  Beckhoff                                           1,200      Europe
                                                                                     ›   Differentiated technology platform
                                                                                         ›   Purpose-built solutions for high-value low-volume use cases
  ABB B&R                                               705     Europe
  Adlink                                                350     Asia                 ›   Deep and established relationships in the
  Seco                                                  116     Europe                   ecosystem
  Eurotech                                               63     Europe                   ›   Intel, ARM, FoxConn, Microsoft, Siemens, GE

  % as of total market (USD 148bn)                       9%
  * Also not Industrial IoT revenues

Source: JC Market Research, management estimates                                                                                                           7
IR Presentation Explore the Kontron Group - February 2023
Technology:
We own disruptive technologies
                                                                                                                            In EUR m

  Real-time IoT Software enabling Edge AI
                                                                                             58     2021
  susietec® IoT software framework:
  › Improve software product portfolio: Embedded SW, Soft PLC, TSN (real-time networks)
  › EUR 100M software revenues planned by 2023, triggering add of 250M IoT products          100           2023

                                                                                                                            In EUR m

  5G IoT WAN Networks                                                                                             2021
                                                                                             122
  5G enables WAN networks for machines at high data bandwidth
  › Iskratel is specialist for 5G, many synergies with susietec®
  › Build up networks with IoT SW and our edge devices                                       200                              2023

                                                                                                                            In EUR m

  Train Control Systems                                                                       144             2021

  Mission critical control systems for highspeed trains
  › New standard FRMCS will accelerate migrations and require 4G/5G
                                                                                             160                     2023
  › Partnership with Siemens Mobility to deploy a 2,000km high-speed rail network in Egypt

Source: JC Market Research, management estimates
IR Presentation Explore the Kontron Group - February 2023
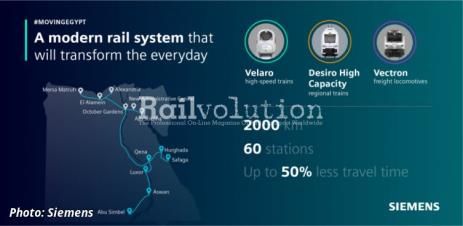
EUROPE                               GLOBAL               SOFTWARE & SOLUTIONS

New Go-to-Market (2023)
7 Divisions In 3 Segments
                                                       Europe                                                  Global                  Software + Solutions

                                                          01                                                      02                                   03
                                                   MORE INFORMATION                                         MORE INFORMATION                     MORE INFORMATION
                                                     ON NEXT PAGE                                            ON NEXT PAGES                        ON NEXT PAGES

          Industrial                                   Telecom                         Services    North America               Asia    Transport             Software

                                      Revenue* FC 2022: EUR 810M                                  Revenue* FC 2022: EUR 260M          Revenue* FC 2022: EUR 230M

                                         Targets          › EBIT** 10%                            Targets       › EBIT** 8%            Targets       › EBIT** 14%
                                                          › GM 40%                                              › GM 30%                             › GM 60%
                                                          › Growth p.a.: 12%                                    › Growth p.a.: 12%                   › Growth p.a.: 12%

* incl. I/C revenues ; ** before HQ-fee distribution                                                                                                                      9
Backlog and design wins excl. project “Focus”
(in EUR bn)                                       Backlog       Design wins
4,5

                                                                                                                  ›   Accelerated growth in Software &
 4                                                                                                         3,82
                                                                                                                      Solutions division
3,5                                                                                         3,37                      ›   Design wins increase: 2 to 21% 2018 - 2022

 3
                                                                                                                      ›   Backlog increase: 4 to 20% 2018 -2022
                                                                      2,70

2,5
                                                                                                                  ›   Diversified customer base
                                           2,16                                                                       ›   Largest customer accounts for less than 3%
 2                                                                                                                        of revenues
                      1,63                                                                         1,57
1,5                                                                           1,33                                ›   Focus industries are growing rapidly
 1                           0,84
                                                        0,93                                                          ›   Largest customers are smart factories, rail
        0,61
                                                                                                                          & avionics, healthcare, smart energy
0,5

 0
               2018                 2019                       2020                  2021           Sep-22 YTD

                                                                                                                                                                        10
Drivers to our growth strategy

   Market structure       Software &           Proven M&A
   and growth             Solutions division   track record

                                                              11
M&A
Pipeline

    M&A is a core competence of Kontron                                  M&A Volume
                                                                         (in EUR m)
    › Half of growth by M&A (10% /year), half organic
    › Target: restructuring situations at no profit = low prices                                    Kontron
                                                                                                     M&A
    › High synergies with Kontron > achieve >10% EBITDA within 2 years    300
                                                                                                                                        Game Changer
                                                                                                                                         Acquisitions
    Kontron M&A pipeline                                                  250

    › Based on est. EUR 400M Focus proceeds game changer acquisitions
                                                                          200
    › Pipeline of 4 companies > EUR 1,000M revenues
    › First transaction in H1/2023 likely                                 150

    › Regional focus: Go global (USA, China) and European union
                                                                          100

    Divestments 2022                                                        50

    › Russia, Belarus, Focus
                                                                             0
                                                                                  2012 2013 2014 2015 2016 2017 2018 2019 2020 2021 2022 2023 2024 2025

›   First transaction H1/2023, Kontron intends to acquire min. EUR 250M in 2023 and 500M in 2023/2024
                                                                                                                                                          12
Guidance and Outlook

   Guidance 2022                                                                              Operating                              Operating                  Focus sale and strategic
                                                                                              continued                           discontinued                              realignment
  Revenue                                                                                    EUR 1,100M                                 EUR 390M

  EBITDA                                                                                       EUR 110M                                  EUR 39M

  Net Profit                                                                                   EUR 56M*                                  EUR 12M                             Min EUR 160M

                                                                                              * 2022 net result includes discontinued operations, Revenues and EBITDA not

                                                                                           Guidance 2023 / Outlook Agenda 2025                                     2023E          2025E
                                             Vision 2030                                   Revenue                                                            EUR 1,200M       EUR 2,000M

                                                                                           EBITDA                                                                      11%           13%
             Transformation to IoTaaS / SLAs will boost Net
                        Earnings close to 10%                                              Net Profit                                                                >60M           140M

*Best available estimation at beginning of 2023 before consolidation has been finalized.                                                                                                    13
Challenges
in 2022 solved for 2023

Overdue Shipments                                                                      Russia
    (in EUR m)
                                                                                        2020          We decided to stop investments in Russia and CIS countries
    150                                                          127   124
                                                      108
    100                           79                                            90
                                           77
                                                                                        Q2/2022       We divested several entities in Russia, Ukraine, Belarus
        50                38
                 10
         0                                                                              H1/2023       We will divest Moldova
               Q1/21    Q2/21    Q3/21    Q4/21       Q1/22   Q2/22    Q3/22   Q4/22
                                                                                        FY 2022       14 CIS companies reduced to 2
    ›        Chip shortage impact:                                                                    Russian Engineers transferred to Europe or replaced in Europe
             ›   Q3: EUR 124m of not delivered/delayed but not lost orders
                                                                                        CIS Impacts   › Russian Revenues 2022 were 50% (40M) below 2021
             ›   Significantly reduced in in Q4/2022
                                                                                                      › 6M losses in 2022
    ›        We increased inventory by EUR 74M until Q3 2022 -> reduced in Q4

                                                                                        2023          › Finalize contracts and leave Russia afterwards
Overdue shipments 2023                                                                                › Optimize impacts
›    Price increases will cover Inflation -> low profit impact
›    Chips allocation will end 2023
     ›    Deliver overdue shipments
     ›       Inventory back to normal recovers cash

                                                                                                                                                                      14
Investor Relations
        Development                                                               2017              2018        2019                 2020                   2021              2022e
        Revenues in EUR m                                                         882.0             990.9      1,122.9              1,254.8                1,342.0    ~1,100 + ~395
        EBITDA Margin                                                             7.7%               9.1%        9.9%                10.4%                   9.4%                 ~10%
        EPS in EUR                                                                 0.43              0.70        0.75                 0.86                   0.75            ~0.90**
        XETRA Closing price in EUR                                                17.99             15.81       21.28                19.30                  14.66                 15.36
        PER                                                                       41.83             22.58       28.37                22.44                  19.55                 17.86

2000                                                                                                                                                                                30,00

                                                                                                                                                                                    25,00
1500
                                                                                                                                                                                    20,00

1000                                                                                                                                                                                15,00

                                                                                                                                                                                    10,00
 500
                                                                                                                                                                                    5,00

   0                                                                                                                                                                                0,00
 01/01/2016                           01/01/2017                          01/01/2018              01/01/2019           01/01/2020             01/01/2021             01/01/2022

                                                             Kontron AG                   TecDAX Index          SDAX                   Kontron AG EUR

Share price moving sidewards – unsatisfactory development
*      Incl. discontinued operations from FOCUS companies.
                                                                                                                                                                                            15
**     Guidance of normalized earnings per share excluding effect of Focus sale
Appendix
The Kontron Share - SDAX® member

Shareholder Structure                                                     Coverage

                                 Ennoconn 27.64%                           AlsterResearch                                           Buy: EUR 30.00
                                 Kontron Management - 7.02%                Hauck & Aufhäuser                                        Buy: EUR 28.00
                                 Amiral Gestion - 5.44%
                                                                           Jefferies                                                Buy: EUR 24.00
                                 Naneva B.V (PPF Holdings B.V.) - 5.29%
                                                                           Kepler                                                   Buy: EUR 24.00
                                 Freefloat 54,6% includes as follows
                                 BNP Paribas Asset Management - 4.22%      Pareto Securities                                        Buy: EUR 28.00
                                 Ninety One SA (Pty) Ltd - 4.15%           Stifel                                                   Buy: EUR 25.50
                                 Allianz Global Investors GmbH - 4.10%
                                                                           Warburg Research                                         Buy: EUR 24.00
                                 Ameriprise Financial, Inc. - 3.87%
                                                                           Median Target Share Price                                     EUR 25.50

            Target: Increase strategic shareholder base                             2 additional analysts will take on coverage of Kontron

                                                                                                                                                     16
Update on ESG
 Achievements 2021                                                                  Outlook & Targets

 › MSCI Rating increased                                                            › Increasing interest of sustainable investors to be met
                                                                                    › Customers and Investors – CO2 disclosure requests more often
 › UN Global Compact joined and 9 SDG’s identified we support
                                                                                        Making our data easily accessible and transparent to our diverse stakeholder
                                                                                                        groups will become increasingly important
 › Education
   Kontron Leadership Academy (focus on female employees)
   Data Security Training Focus                                                     › Carbon Disclosure Project experience ✓

 › Employee Survey – conducted among approx. 5,000 employees                        › EU Taxonomy requirements expected to be extended
                                                                                    › Implementation of scope I and II to be achieved until 2023
                                                                                    › Kontron’s Green Products – communicating our products better

                                 Preparation scope I and II               Evaluation ESG-Goals                              Implementation finalized
                  Reporting expansion (incl. EU Taxonomy) ✓               Implementation stage launched                     Continuous improvement process
                 ESG-Goal extension ✓                                     Enhanced reporting
         ESG-Risk assessment ✓                                            according to EU Taxonomy
Update material analysis ✓                                                and ESG standards

                                                                Continuous stakeholder dialogue ✓
     2021                                                                    2022                                                        2023

                                                                                                                                                                       17
Kontron
Group Balance Sheet

    Mio. EUR                                                                                                 30/09/2022                              31/12/2021                                                     30/09/2022    31/12/2021
    NON-CURRENT ASSETS                                                                                             447,4                                   519,0          CAPITAL AND RESERVES                            442,8        423,3
    Fixed Assets                                                                                                   409,9                                   478,8          Equity                                          442,8        423,3
      as of Property, plant and equipment                                                                          100,6                                   132,5             as of Treasury shares                          0,0         -46,8
      as of Goodwill                                                                                               181,4                                   208,3          NON-CURRENT LIABILITIES                         268,7        348,2
    Other Assets                                                                                                    37,5                                    40,2          Long-term loans and borrowings                  196,2        238,4
    CURRENT ASSETS                                                                                                 851,7                                   833,2          Other Non-Current Liabilities                    72,5        109,8
    Inventories                                                                                                    242,7                                   187,3          CURRENT LIABILITIES                             587,7        580,7
    Trade receivables                                                                                              164,5                                   232,5          Trade payables                                  196,2        270,0
    Contract Assets from Customers                                                                                  30,9                                    32,8          Contract Liabilities from Customers              67,2          85,0
    Cash and cash equivalents                                                                                      118,7                                   296,5          Short-term loans and borrowings                 117,0          72,3
    Other receivables and prepayments                                                                               75,4                                    83,9          Other Current Liabilities                        97,6        153,4
    assets classified as held for sales                                                                            219,5                                     0,0          liabilities classified as held for sale         109,7
    Total Assets                                                                                                 1.299,2                                 1.352,1          Total Liabilities & Equity                    1.299,2       1.352,1

                                                                                                                                                                          Equity Ratio                                   34,1%         31,3%
    Total Cash (Cont.+ Disc. Operations)                                                                                 162,3                                   296,5    Total Net Cash/Net Debt*                       -157,2         -14,2
                                                                                                                                                                          Working Capital excluding IFRS 15**             251,4         149,9

›   EUR 74M Inventory (thereof 16.5M prepayments) built up to cover chip shortage | Equity Ratio improved
       Definition Net Cash:          Cash and cash equivalents less non-current and current financing liabilities (excl. liabilities from leasing according to IFRS 16)
       Definition Working Capital:   Inventories plus trade receivables less trade payables (excl. IFRS 15 contract assets and liabilities)                                                                                                     18
Disclaimer

This document includes 'forward-looking statements'. Forward-looking statements are all            directors, employees, advisors, representatives or agents shall be liable whatsoever for any
statements, which do not describe facts of the past, but containing the words "believe",           loss however arising, directly or indirectly, from any use of this document its content or
"estimate", "expect", "anticipate", "assume", "plan", "intend", "could", and words of similar      otherwise arising in connection with this document.
meaning. These forward-looking statements are subject to inherent risks and uncertainties
since they relate to future events and are based on current assumptions and estimates of           This document or any of the information contained herein do not constitute, form part of or
Kontron AG, which might not occur at all or occur not as assumed. They therefore do not            shall be construed as an offer or invitation to purchase, subscribe, sale or exchange, nor a
constitute a guarantee for the occurrence of future results or performances of Kontron AG.         request for an offer of purchase, subscription, sale or exchange of shares / securities of
The actual financial position and the actual results of Kontron AG, as well as the overall         Kontron AG, or any advice or recommendation with respect to such shares / securities. This
economic development and the regulatory environment may differ materially from the                 document or a part of it shall not form the basis of or relied upon in connection with any
expectations, which are assumed explicitly or implicitly in the forward-looking statements and     contract or commitment whatsoever.
do not comply to them. Analysts and investors, and any other person or entity that may need
to take decisions or prepare or release opinions about the shares / securities issued by Kontron   This document does not constitute an offer to purchase securities in the United States,
AG are cautioned not to place undue reliance on those forward-looking statements, which            Canada, Australia, South Africa and Japan. Securities, including the bond of Kontron AG may
speak only as of the date of this document. Past performance cannot be relied upon as a guide      not be sold or offered for sale within the United States or to or for the account of / in favor of
to future performance.                                                                             US citizens (as defined in Regulation S under the U.S. Securities Act of 1933 in the current
                                                                                                   version (the "Securities Act") unless they are registered under the regulations of the Securities
Except as required by applicable law, Kontron AG undertakes no obligation to revise these          Act or unless they are subject to an exemption from registration. Neither Kontron AG nor any
forward-looking statements to reflect events and circumstances after the date of this              other person intend to register the offer or a part thereof in the United States or to make a
presentation, including, without limitation, changes in Kontron’s business or strategy or to       public offer of the securities in the United States.
reflect the occurrence of unanticipated events. The financial information and opinions
contained in this document are unaudited and are subject to change without notice. This
document contains summarized information or information that has not been audited. In this
sense, this information is subject to, and must be read in conjunction with, all other publicly
available information, including if it is necessary, any fuller disclosure document published by
Kontron AG. None of the Company, its subsidiaries or affiliates or by any of its officers,

                                                                                                                                                                                                        19
Kontron AG
Industriezeile 35
A-4020 Linz
www.kontron.com
IR Contact:
ir@kontron.com
+43 (1) 80191 - 1196

                       20
You can also read