INVESTORS PRESENTATION - NASDAQ: HEAR May 2021 - Seeking Alpha
←
→
Page content transcription
If your browser does not render page correctly, please read the page content below
INVESTORS PRESENTATION
NASDAQ: HEAR
May 2021

SAFE HARBOR STATEMENT
Forward-Looking Information
This presentation includes forward-looking information and statements within the meaning of the federal securities laws. Except for historical information contained in this release, statements in this release may constitute
forward-looking statements regarding assumptions, projections, expectations, targets, intentions or beliefs about future events. Statements containing the words “may”, “could”, “continue”, “would”, “should”, “believe”,
“expect”, “anticipate”, “plan”, “goal”, “estimate”, “accelerate”, “target”, “project”, “intend” and similar expressions constitute forward-looking statements. Forward-looking statements involve known and unknown risks and
uncertainties, which could cause actual results to differ materially from those contained in any forward-looking statement. These statements are based on management’s current belief, as well as assumptions made by, and
information currently available to, management. While the Company believes that its expectations are based upon reasonable assumptions, there can be no assurances that its goals and strategy will be realized. Numerous
factors, including risks and uncertainties, may affect actual results and may cause results to differ materially from those expressed in forward-looking statements made by the Company or on its behalf. Some of these
factors include, but are not limited to: risks related to the substantial uncertainties inherent in the acceptance of existing and future products; the difficulty of commercializing and protecting new technology; the impact of
competitive products and pricing; the impact of the coronavirus (COVID-19) pandemic on consumer demands and manufacturing capabilities; delays or disruptions in the supply of components for our products; risks relating
to, and uncertainty caused by or resulting from, the COVID-19 pandemic; the Company's partnerships with influencers, athletes and esports teams; risks associated with the expansion of our business, including the
implementation of any businesses we acquire, the integration of such businesses within our internal control over financial reporting and operations; and our liquidity. These risks may be in addition to the other factors and
matters discussed in the Company’s most recent Annual Report on Form 10-K, Quarterly Report on Form 10-Q and other periodic reports filed with the Securities and Exchange Commission. Except as required by the
securities laws of the United States, the Company does not intend to publicly update or revise these forward-looking statements after the date of this release whether as a result of new information, future developments or
otherwise. This presentation also contains trademarks and trade names that are property of their respective owners.

Non-GAAP Financial Measures
In addition to its reported results, the Company has included in this presentation certain financial results, including adjusted EBITDA, and adjusted net income, that the Securities and Exchange Commission defines as “non-
GAAP financial measures.” Management believes that such non-GAAP financial measures, when read in conjunction with the Company's reported results, can provide useful supplemental information for investors analyzing
period-to-period comparisons of the Company's results. “Adjusted Net Income” is defined as net income excluding (i) integration and transaction costs related to the acquisition of the business and assets related to the
ROCCAT brand, (ii) the effect of the mark-to-market requirement of the financial instrument obligation, (iii) any change in fair value of contingent consideration and (iv) the release of valuation allowances on deferred tax
assets. “Adjusted EBITDA” is defined by the Company as net income (loss) before interest, taxes, depreciation and amortization, stock-based compensation (non-cash), and certain non-recurring items that we believe are
not representative of core operations (e.g., the integration and transaction costs related to the acquisition of the business and assets related to the ROCCAT brand, the mark-to-market adjustment for the financial
instrument obligation and the change in fair value of contingent consideration). These non-GAAP financial measures are presented because management uses non-GAAP financial measures to evaluate the Company’s
operating performance, to perform financial planning, and to determine incentive compensation. Therefore, the Company believes that the presentation of non-GAAP financial measures provides useful supplementary
information to, and facilitates additional analysis by, investors. The presented non-GAAP financial measures exclude items that management does not believe reflect the Company’s core operating performance because
such items are inherently unusual, non-operating, unpredictable, non-recurring, or non-cash. See a reconciliation of GAAP results to Adjusted Net Income and Adjusted EBITDA included in the appendix for the
three months ended March 31, 2021 and 2020.

© 2021 Turtle Beach Corporation. All Rights Reserved.                                                                                                                                                                                2
TURTLE BEACH IS A TOP 5 PLAYER
 IN THE $5.2 BILLION 1 GAMING ACCESSORY MARKET

                                                                                                                                     NASDAQ: HEAR
 CLEAR LEADER IN CONSOLE GAMING HEADSETS
             FOR OVER 10 YEARS
                                                                                                                                         2021 Guidance
                                                                                                                                   $385 MILLION IN REVENUES
                                                                                                                                      5 Year CAGR of 17%

                                                                                                                                    $50 MILLION IN EBITDA

                                                                                                                                          $1.50 EPS

RAPIDLY GROWING, AWARD-WINNING PC GAMING
    KEYBOARDS, MICE, HEADSETS, AND MORE
                                                                                                                                 STRONG BALANCE SHEET, NO DEBT
                                                                           EXPANDING PORTFOLIO
                                                                 IN NEW CONSOLE AND PC ACCESSORY CATEGORIES

  1. $5.2B 2020 Gaming Accessory Market includes gaming headsets for consoles and PC, PC gaming keyboards, and PC gaming mice.                                   3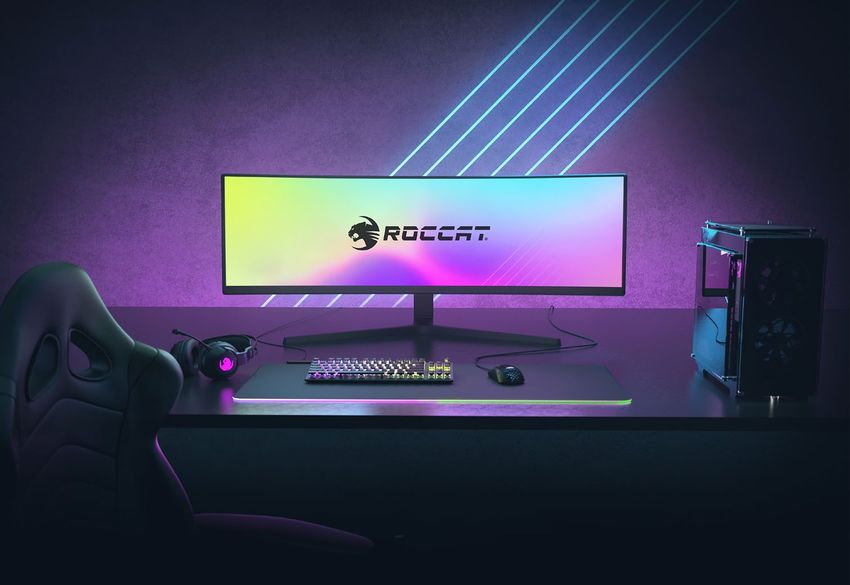
The picture can't be displayed.

                                  GAMING IS THE MARKET TO BE A LEADER IN

                                   Global Market for Gaming Headsets, Mice, and Keyboards1               Why gaming has been such a strong market for years…

                                                                                                         Entertainment
                                                                                                         Gaming has been a growing source of entertainment, capturing increasing share of leisure time since
                                                                                                         the 70’s
                                                                                                         •    Gaming now leads share of daily time spent on technology and media at 41%2
                                                         Keyboards                                       •    Gaming now surpasses box office movie revenue by 4x
                                                           $1.0 B
                                                                                              Console
                                                                                                         Socializing
                                                                                              Headsets   Since the rise of online multiplayer gaming in the 2000’s, gaming has become a major platform to
                                                                     GLOBAL GAMING             $1.7 B    socialize with friends, a trend that's accelerated the past two years with the Battle Royale genre and
                                                                       ACCESSORY                         COVID-19 driven stay-at-home orders
                                                                        MARKET                           •    Xbox Live and PlayStation Network now have over 200M users
                                                   Mice                 $5.2B1                           •    12 million gamers recently attended a “live” concert in the game Fortnite
                                                  $1.0 B
                                                                                                         Competition
                                                                                                         Professional esports gaming has taken off with viewership expected to exceed most other sports in the
                                                                        PC Headsets                      coming years
                                                                           $1.5 B                        •   Global esports revenues are expected to cross $1.6B in 20243
                                                                                                         •   Esports viewership is expected to reach 800M by 20242

                                                                                                         Realism
                                                                                                         Starting in 2020, enhanced power and VR is now making gaming environments and simulations
                                                  Americas & Europe are ~75% of the market               extremely realistic
                                                                                                         •    New consoles feature 8K graphics, 3D audio, and can mix local and cloud resources
                                                                                                         •    Consumer VR market is expected to grow from $1.4B to $4.2 billion by 20242
                                  1. Newzoo 2020 Peripheral Market – updated in April 2021.
                                  2. Activate Consulting report 2020                                                                                                                                              4
                                  3. Newzoo March 2021 esports market report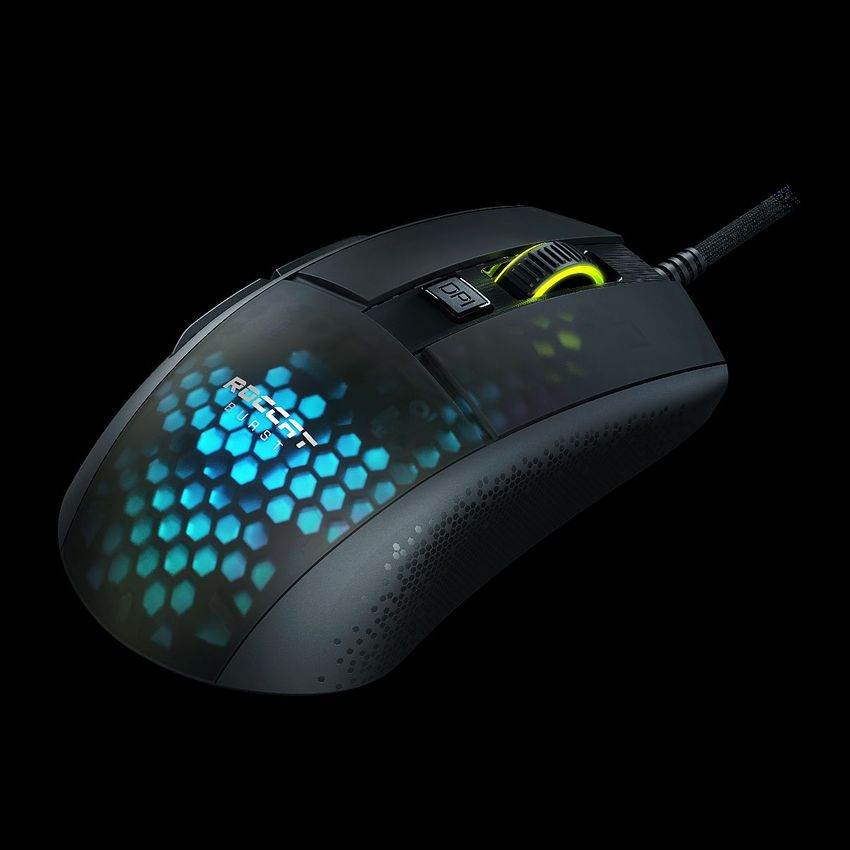
#1
      IN GAMING AUDIO
       The Global Market Leader in
Console Gaming Headsets for Over 10 Years

        55 Million+                                          Broad Portfolio             Award-Winning Design
    Headsets Sold Since 2010                            of PC Gaming Accessories           and Build Quality

                Industry-Leading Innovation at Every Price Point with Over 285 Patents

                                                                                                                5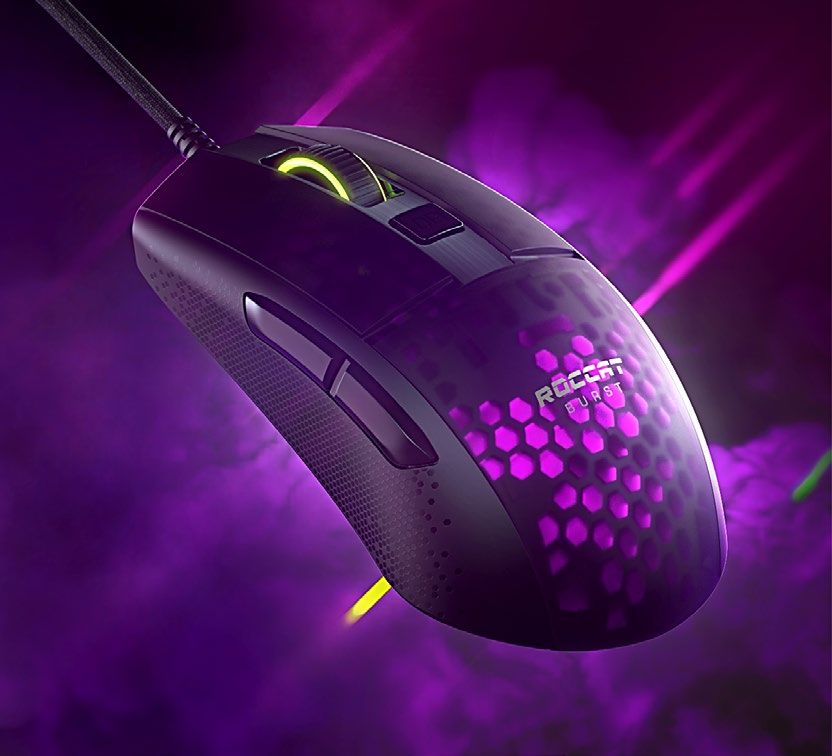
The picture can't be displayed.

                                  THE LEADER IN CONSOLE GAMING HEADSETS FOR OVER 10 YEARS RUNNING

                                    #1 GAMING HEADSET PROVIDER                                              HIGHER REVENUE SHARE                                                              STRONG BRAND & REPUTATION
                                      FOR XBOX, PLAYSTATION & NINTENDO                                      THAN NEXT FOUR PLAYERS COMBINED                                                  Among Gamers, Retailers, Gaming Industry

                                                                                                                                                                                                PRODUCT FOR EVERY GAMER
                                                                                                                                                                                                     Entry Level to Professional

                                                                                                                                                                                                   PRODUCT INNOVATIONS
                                                                                                                                                                                                And Unique Features – Many patented
                                                                                        US, CANADA &
                                                                                       MEXICO CONSOLE
                                                               Other                   GAMING HEADSET
                                                                                                                                           WHY & HOW                                          280K+ POINTS OF DISTRIBUTION1
                                                               54.2%                   REVENUE SHARE

                                                                                           2020                                                                                                            70+ Countries

                                                                                                                   45.8%
                                                                                                                                                                                                   STRONG PARTNERSHIPS
                                                                                                                                                                                              With Leading Esports Teams & Influencers

                                                                                                                                                                                                OVER 10 YEARS EXPERIENCE
                                                                                                                                                                                             Gaming Headsets & with Xbox & PlayStation

                                          8 OF TOP 10 SELLERS                                                 13 OF TOP 20 SELLERS
                                           OVERALL ARE TURTLE BEACH                                             OVERALL ARE TURTLE BEACH                                                         Over 150 ISSUED PATENTS2
                                                                                                                                                                                                         Gaming Headsets

                                  Source: The NPD Group/Retail Tracking Service/Video Games/Dollars/U.S., Canada and Mexico/January-December 2020
                                  1. Includes only Console gaming headsets                                                                                                                                                               6
                                  2. Counts only patents related to headsets (not including additional patents relating to ROCCAT brand products, Neat Microphones or HyperSound products)
The picture can't be displayed.

                                  THE BROADEST SELECTION OF INDUSTRY-LEADING HEADSETS FOR EVERY CONSOLE GAMER

                                  "This $40 headset is worth every penny."   "A fantastically priced headset and worthy   “A best gaming headset of 2020.”
                                              - Windows Central                      successor to the original."                    - Tom’s Guide
                                                                                            - Games Radar

                                                                                                                                                             7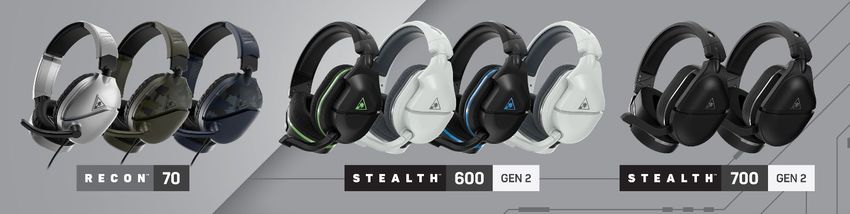
THE MOST COMPLETE PORTFOLIO
FROM ENTRY-LEVEL TO PRO ESPORTS ATHLETES
TURTLE BEACH DELIVERS A VARIETY OF INNOVATIVE FEATURE-DRIVEN HEADSETS.
AS GAMERS IMPROVE OVER TIME, THEY ARE WILLING TO PAY FOR FEATURES
                                                                                                                                                               - Esports-Focused
THAT PROVIDE A COMPETITIVE ADVANTAGE.                                                                                               - Bluetooth Connectivity      Performance
                                                                                                                    - Wireless        - App-Based Settings          Features
                                                                                                                - 50mm Speakers         - Premium Quality
                                                                             - Powerful Amplified Audio
                                                                                                            - Superhuman Hearing™
                                                    - Glasses Friendly      - Bass Boost & Audio Presets
                                                - Memory Foam Cushions            - Mic Monitoring
                          - 40mm Speakers     - Metal-Reinforced Headband
 - Gaming Earbuds        - Flip-to-Mute Mic
   - Multiplatform

                                                                                                                                                                          $249.95
                                                                                                                 $99.95                   $149.95                    Esports Gamers
                                                                                                                                                                  Plays 15+ Hours Per Week
                                                          $49.95                   $59.95                            Enthusiast/Core Gamers
                                                                                                                      Plays 7-15 Hours Per Week
    $29.95                    $39.95                             Casual Gamers
                                                              Plays 4-6 Hours Per Week
         Entry-Level Gamers                                                                                Small sampling shown of Turtle Beach’s portfolio of console gaming headsets.
     Plays Approx. 4 Hours Per Week
                                                                                                                                    The full lineup is available at www.turtlebeach.com      8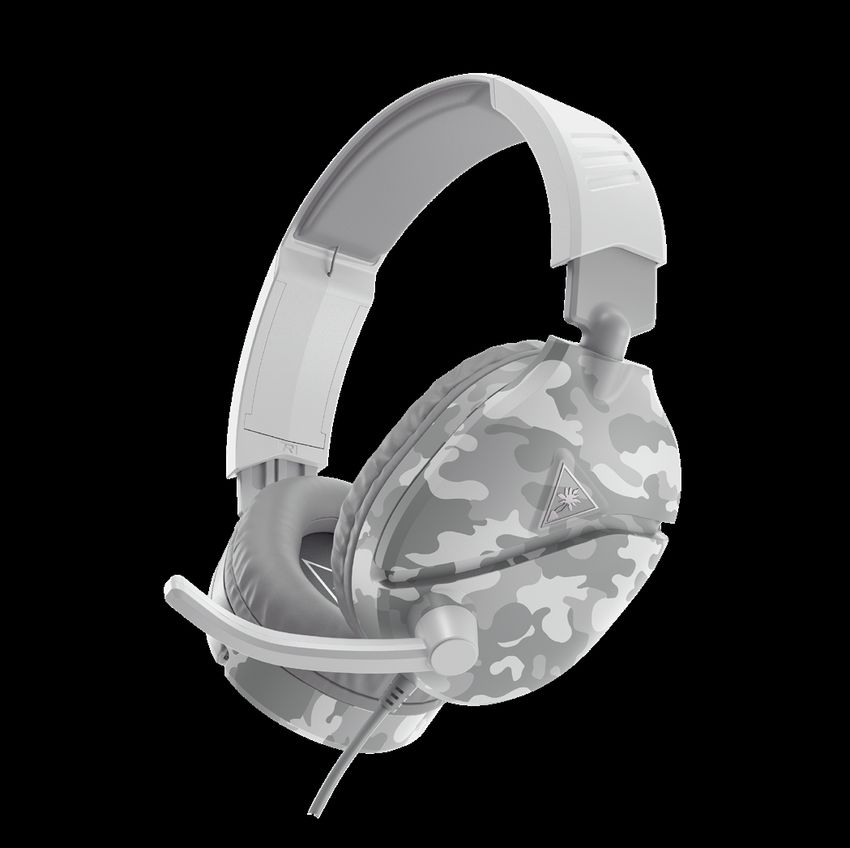
OVERVIEW

Acquired in 2019, ROCCAT is Turtle Beach's award-winning
brand of gaming mice, keyboards, headsets, software,
and more for PC gamers.

The brand is driven by former esports pro, Founder and
Head of PC Products for Turtle Beach, Rene Korte, and his
highly experienced product and engineering team in
Turtle Beach's Hamburg, Germany studio.

ROCCAT has strong brand presence in Germany, good
awareness across EU, and is expanding in NA & major
Asian markets.

Investments to drive growth including expanding
ROCCAT portfolio and further developing the brand more
than doubled the business in 2020.
                                                            9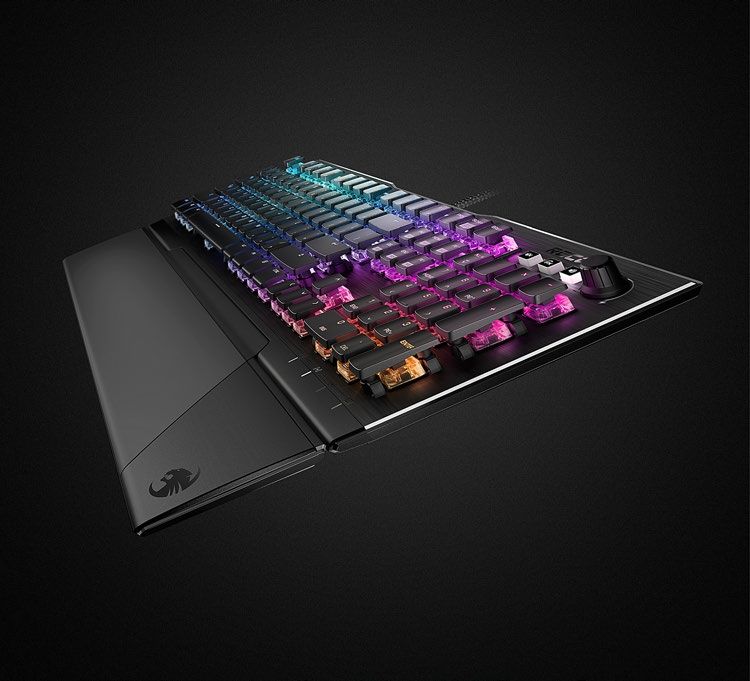
The picture can't be displayed.
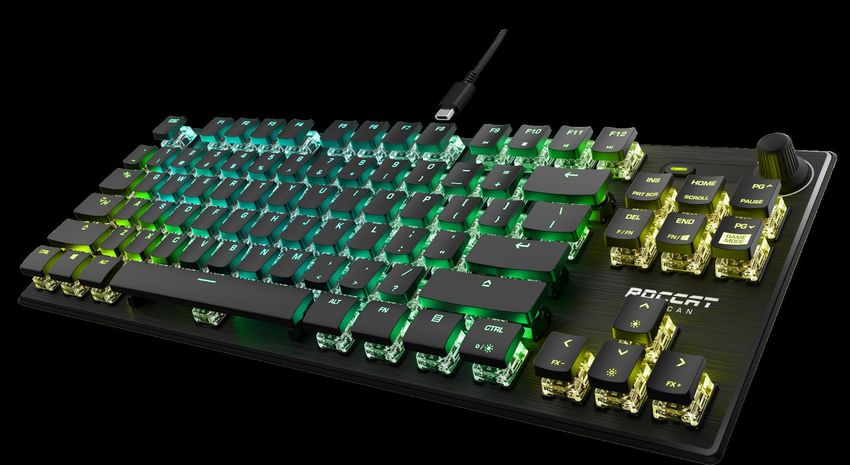
IT’S TIME TO EXPERIENCE PRECISION
"The ROCCAT Vulcan TKL Pro is a gorgeous
optical gaming keyboard with superb build
quality."
- Rock Paper Shotgun
"Simple, affordable, stylish and comfortable, but "For gaming, this is the mouse to use."
also packing a mighty acoustic punch you just - Back to the Gaming
won't find anywhere else for this kind of money."
- eTeknix
10The picture can't be displayed.
GROWING & AWARD-WINNING PC LINEUP
Kone Pro Air | Kone Pro Burst Pro | Burst Core Kain 200/120/100 Kone AIMO Remastered Kone Pure Ultra
MSRP: $129.99 | $79.99 MSRP: $99.99 | $29.99 MSRP: $99.99 | $69.99 | $49.99 MSRP: $79.99 MSRP: $69.99
Vulcan TKL Pro | Vulcan TKL
MSRP: $159.99 | $129.99 Pyro Magma
Vulcan Pro MSRP: $99.99 MSRP: $59.99
MSRP: $199.99 Vulcan 120/121/122
MSRP: $159.99
Elo 7.1 Air | Elo 7.1 USB | Elo X Stereo Syva In-Ear Juke 7.1 USB Soundcard
11
MSRP: $99.99 | $69.99 | $49.99 MSRP: $29.99 MSRP: $19.99INTRODUCING NEAT!
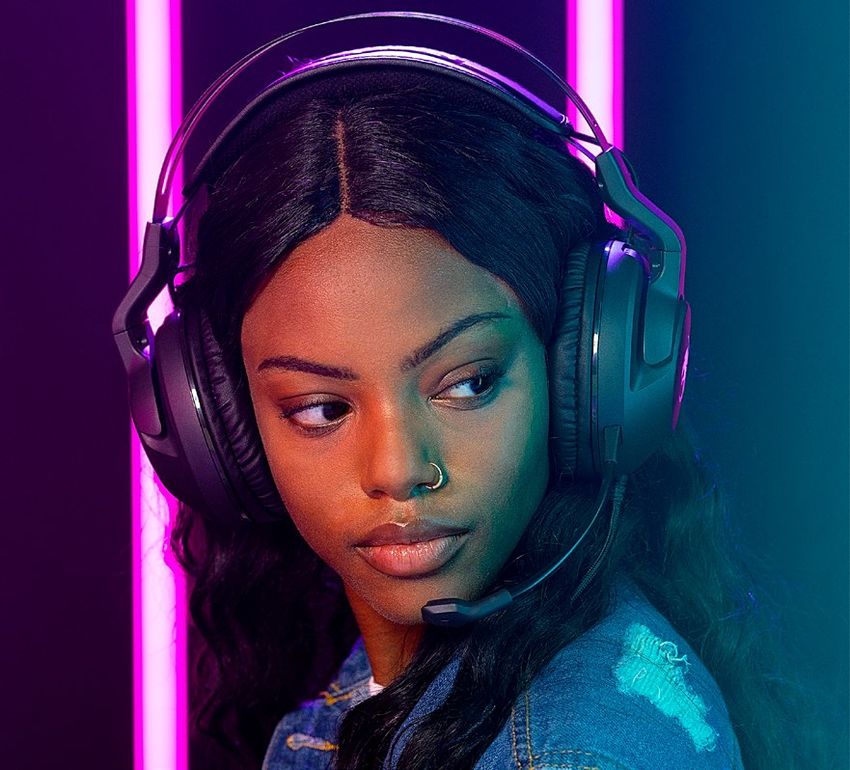
ABOUT NEAT MICROPHONES
Acquired by Turtle Beach in January 2021, Neat is the next brand from
the original founders of Blue Microphones and the collective minds
behind many of today’s best-selling digital and analog microphones.
Neat Microphones is a lean, mean, product creation machine building
consumer-friendly microphones for the next generation of use cases and
customers with a new portfolio launching in 2021.
The Neat Microphones team brings a combined 100+ years of passion
and experience for capturing and communicating great audio.
Today's microphone market is $2.3B overall, with ~$700M in
"The Beecaster is a top the Digital/USB category, which is Neat's primary focus. Gamers,
performer and a
showstopper...versatility
streamers, influencers, as well as work/learn from home consumers are
that is unmatched" driving growth in digital microphone demand.
- Barking Drum
Sources: CEA Market research data; Zion Market research report; Ample Microphone Market report; Market Intellica 2019 report and market forecasting; 12
MI Salestrak; internal analysis; H T F Market Report; Amazon sales analytics.AND NOW A NEAT TEASER
RETURN OF THE KING
King Bee® II
I know. We're excited too.
More info in June. Launching July 2021.
Bee seeing you soon...
13The picture can't be displayed.
INVESTING TO DRIVE GROWTH IN GLOBAL MICROPHONE AND PC MARKETS
Global Gaming Accessory Market $5.8B MARKETS TO FURTHER PENETRATE
New $2.3B Global Microphone Market
Microphones Portfolio • 18% CAGR 2020-2023 in Digital/USB category
$2.3B Launching
2021 • Goal is to enter with upcoming Neat portfolio
Mice
$1.0B
Keyboards $3.5B PC Accessories Market
• 2020 growth investments of ~$12M Including in
$1.0B
ROCCAT portfolio expansion and brand development
• First goal is to build incremental $100M business and
PC Headsets grow from there
$1.5B
TURTLE BEACH HISTORICAL CORE BUSINESS
$1.7B Console Gaming Headsets
Console Headsets • Turtle Beach leads this market by far
$1.7B
• Goal is to continue leadership
Source for market sizes: NewZoo 2020 Peripheral Market – updated in April 2021.
Additional Sources: CEA Market research data; Zion Market research report; Ample Microphone Market report, Market Intellica 2019 report and market forecasting; MI Salestrak; internal analysis; H T F Market Report; Amazon sales
analytics. 14The picture can't be displayed.
WE PARTNER WITH LEADING TEAMS
INFLUENCERS & EVENTS Over 862M Gamers and 202M esports fans in the Americas and Europe1
Ali-A Dr. Disrespect Mr Savage Castro_1021 Skyrroz
(30M Reach) (8M Reach) (8M Reach) (6M Reach) (4M Reach)
NRG Esports OpTic Chicago
A leading collective of top Franchise team in
influencers and world champion Activision Blizzard’s CDL
esports teams
Kevin De Bruyne Josh Hart Kevin Porter Jr. KayPea Scump
(Man City & Belgium, (New Orleans Pelicans, (Cleveland Cavaliers, (800k Reach) (6M Reach)
17M Reach) 1M Reach) 401k Reach)
2021 Official Mouse and Keyboard Partner
RIOT LCS League of Legends Tournament
HECZ Clix Kickstradomis BenjyFishy Clare Siobhan Titles shown represent games played by our partner esports teams and influencers
(3M Reach) (9M Reach) (417k Reach) (7M Reach) (2M Reach) and do not indicate a partnership with the publisher 15
1Newzoo 2020 Global Esports and Global Games Market Report QU October 2020The picture can't be displayed.
XBOX AND PLAYSTATION CONSOLE OUTLOOK
“With the launch of new systems and continued sales for existing
consoles, we forecast Microsoft and Sony combined hardware sales
will set records in 2021 and 2022.” PlayStation and Xbox Console Unit Sales
David Cole, Head DFC Intelligence, Video games industry analyst
40
Gen 9 Xbox
30
Hardware Unit Sales (in millions)
Release: November 10, 2020
Price: $499 for Xbox Series X
$299 for Xbox Series S 20
Gen 9 PlayStation 10
0
Release: November 12, 2020
Price: $499 for PS5
$399 for PS5 Digital Edition
Gen 7 Gen 8 Gen 9
16
Source: DFC Intelligence updated September 2020 Worldwide Video Game Market ForecastsThe picture can't be displayed.
2021 OUTLOOK1
2021 2021 Outlook Commentary
Up from prior guidance of $370M; Reflects Q1 results and continued strong
consumer demand; continued strong share in console headsets and progress in
Net Revenue ~$385M
PC gaming accessories and new categories expected to fuel growth off record
2020.
Margins expected to be more aligned with historical levels, returning to more
Gross Margin Mid 30%s
normal promotional spending and business mix.
Targeting category leading 13% EBITDA margin (up from prior guidance of 12%)
Adj. EBITDA ~$50M while funding continued investments in new products and other growth
initiatives.
Up from prior guidance of ~$1.35; reflects above factors; anticipates full year
Adj. EPS ~$1.50
effective tax rate of ~ 27%.
Higher assumed share count reflects higher assumed average share price, which
Diluted Shares ~18.0M
increases shares assumed under treasury method.
1. Guidance provided May 5, 2021. 17The picture can't be displayed.
REVENUE PROFILE
Company Revenues
Millions
$360 $385
Growth Drivers:
$287
Battle
Continued leadership in the $1.7B console gaming headset market
Royale $235
surge Continued growth in $3.4B market for PC gaming headsets,
keyboards, and mice with ROCCAT brand expansion
$149
Entry into the $2.3B global microphone market with recent
acquisition of Neat Microphones
Further expansion into additional new categories
1
2017 2018 2019 2020 2021E
1. Guidance provided May 5, 2021. 18The picture can't be displayed.
ADJUSTED EBITDA & CASH FLOW PROFILE
Adjusted EBITDA2 Cash Flow From Operations
Millions Millions
$61.4 $51.0
$57.7 13% EBITDA
Target
Battle $42.2
Royale ~$50 $39.4
surge
$22.8
$11.6
$3.4
1
2017 2018 2019 2020 2021E 2017 2018 2019 2020
1. Guidance provided May 5, 2021.
2. See appendix for a reconciliation of non-GAAP measures. 19The picture can't be displayed.
LONG-TERM FINANCIAL TARGETS
Metric Target Maintain leadership position in
console gaming headsets
Revenue $ 10-20% CAGR Drive growth in PC gaming headsets,
keyboards, and mice (leveraging
ROCCAT brand and portfolio)
Gross Margins % Mid 30’s Maintain category leading EBITDA
while investing for growth
Leverage brand, skills, and global
EBITDA $ 15-30% CAGR footprint to enter new categories over
time (organic and M&A)
20The picture can't be displayed.
EXPERIENCED BOARD OF DIRECTORS
- COO of Motorola Mobility’s mobile business
Juergen Stark
- 10 years as Principal at McKinsey & Company, Inc.
Chairman & CEO
- MBA, Harvard Business School
- Former CFO of Qualcomm Incorporated (NASDAQ: QCOM)
William Keitel - During his tenure, Qualcomm grew revenues from ~$800M to ~$25B
Lead Independent Director - Held senior financial roles at Nortel (OTC: NRTLQ) & Pepsico (NYSE: PEP)
Dr. Andrew Wolfe, PhD - Founder & principal of Wolfe Consulting
Director - Former Chief Technology Officer for SONICblue, Inc.
- Expert in IP strategy and licensing
Gregory Ballard - General partner with Eleven Ventures
Director - Former senior VP for mobile & social games at Warner Bros.
- Former CEO of Glu Mobile, former board member with DTS
- Former SVP and COO, Samsclub.com
Kelly Thompson - Former SVP Merchandising, Planning, and Marketplace for Walmart.com
Director - 10 years in management positions at Gap, Inc.
- CEO of New York Life Investment Management
Yie-Hsin Hung - Formerly with investment firms Bridgewater Associates and Morgan Stanley
Director - Named in Barrons’ 2020 100 Most Influential Women in U.S. Finance for second year in a row
21The picture can't be displayed.
EXPERIENCED MANAGEMENT TEAM
Rene Korte General Manager, PC Products
Juergen Stark Chairman & CEO
- Founder of ROCCAT GmbH and CEO for 12 years
- COO Of Motorola Mobility’s Mobile Business
- VP Europe for RAZER
- 10 Years As Principal At Mckinsey & Company
- Professional gamer and founder of MTW esports team
Skipper Wise VP & Founder of Neat Microphones
John Hanson CFO
- Co-founder & President, Blue Microphones
- EVP & CFO at Dialogic
- Recording artist, engineer and entrepreneur with 40+
- CFO at One Communications Corp years creating microphones
Cris Keirn SVP, Global Sales David Angress VP & Head of Neat Microphones
- Led headset transition as VP of business planning & - Decades-long career in music products industry
strategy
- 15 years EVP at Guitar Center
- 17 years with Motorola in product management,
operations, quality & customer relations - Former CEO, Adam Audio GmbH
Megan Wynne General Counsel Joe Stachula CTO & SVP, Product Development
- 5 years with I-Flow, a Kimberly-Clark Health Care - 20+ years in consumer electronics
Company
- 12 years at Plantronics engineering audio headsets
- 13 years with Morris Polich & Purdy law firm
Ryan Dell SVP, Marketing Jose Rosado SVP, Global Operations
- 15 years of brand, consumer & digital marketing experience - Former Sr. Director, Global Supply Chain Operations for
HP
- Formerly CMO at MVMT, VP of Marketing & Acquisitions at
FTD Companies (Pro Flowers, Shari's Berries) - 22 years of supply chain management with Motorola, ON
Semiconductor, HP, Cisco
Matt Seymour SVP, Product Management
- 20+ years in the Consumer Electronics industry
22
- Previously with Sony leading television portfolio
planning & development, product marketingINVESTOR RELATIONS: PR/MEDIA CONTACT: TURTLE BEACH CONTACT:
Sean McGowan/Cody Slach Jordan Schmidt MacLean Marshall
Gateway Investor Relations Gateway Investor Relations Sr. Director, Communications
+1 (949) 574-3860 +1 (949) 386-6332 Turtle Beach Corp.
+1 (310) 431-6215
HEAR@gatewayir.com jordan@gatewayir.com
maclean.marshall@turtlebeach.com
COMPANY WEBSITES
www.turtlebeachcorp.com | www.turtlebeach.com | www.roccat.com | www.neatmic.com
23APPENDIX
24The picture can't be displayed.
FULL YEAR FINANCIAL OVERVIEW
$ in millions (except per-share data) 2019 2020 Commentary
Increased demand from new and existing gamers and returning lapsed gamers,
as well as work/learn-from-home users. Superior supply and retail execution led
Revenue $234.7 $360.1
to further market share gains. Doubling of ROCCAT business with new launches
also added to growth.
Lower-than-normal promotional environment, favorable business mix, volume-
Gross Margin 33.5% 37.2% driven fixed cost leverage, partially offset by roughly $9 million in higher air
freight spend to facilitate sales.
Reflects revenue-related increases as well as full year of ROCCAT OpEx and
Operating Expenses $68.3 $84.6
investments to drive growth.
Adjusted EBITDA¹ $22.8 $61.4 Reflects above factors.
Net income in 2019 included a tax benefit of $7.4M from the release of a
Net Income (Loss) $17.9 $38.7
valuation allowance related to deferred tax assets.
Diluted EPS $1.04 $2.37 Reflects above factors.
Adjusted Diluted EPS¹ $0.74 $2.22 Reflects above factors.
Diluted Shares 15.7M 16.4M
1. See appendix for a reconciliation of non-GAAP measures. 25The picture can't be displayed.
BALANCE SHEET
Balance Sheet Highlights Balance Sheet Improvements
At December 31, 2019 At December 31, 2020 Cash and equivalents increased
significantly due to record revenue,
Cash & Equivalents $8.2M $46.7M higher margins and fixed cost leverage.
Inventory increase driven by higher
Inventories $45.7M $71.3M current demand, and anticipation of Q1
2021 sales.
Revolver (asset-based) $15.7M $0 First time in at least ten years that total
debt has been zero at year-end. Highest
level of net cash in the Company’s
Total Debt $15.7M $0 history.
26The picture can't be displayed.
GAAP NET INCOME TO ADJUSTED EBITDA RECONCILIATION
Full years
December 31, 2020 December 31, 2019
Consolidated
Net Income (Loss) 38,746 17,944
Depreciation 4,359 4,556
Amortization of intangibles 889 642
Interest 467 929
Taxes 13,711 (6,237)
Stock Compensation 5,549 3,558
Acquisition-related settlement (1702) -
Business Transaction Expense 550 3,516
Change in Fair Value of Contingent Consideration (1,121) (471)
Unrealized loss (gain) on financial instrument
- (1,601)
obligation
Adj EBITDA 61,448 22,836
27The picture can't be displayed.
GAAP NET INCOME TO ADJUSTED NET INCOME RECONCILIATION
2020 COMPARED TO 2019
Twelve Months Ended
December 31, December 31,
2020 2019
Net Income (Loss)
GAAP Net Income (Loss) $ 38,746 $ 17,944
Adjustments, net of tax:
Gain on financial instrument obligation — (1,601)
Release of valuation allowance — (7,439)
Gain on acquisition-related settlement (1,702) -
Change in fair value of contingent consideration (1,121) (422)
Acquisition integration costs 405 3,154
Non-GAAP Earnings $ 36,328 $ 11,636
Diluted Earnings Per Share
GAAP- Diluted $ 2.37 $ 1.04
Gain on financial instrument obligation — —
Release of valuation allowance — (0.47)
Gain on acquisition-related settlement (0.10) —
Change in fair value of contingent consideration (0.07) (0.03)
Acquisition integration costs 0.02 0.20
Non-GAAP- Diluted $ 2.22 $ 0.74
28The picture can't be displayed.
GAAP NET INCOME TO ADJUSTED EBITDA RECONCILIATION
TWELVE MONTHS ENDED DECEMBER 31, 2020
Adj
As Adj Adj Stock Adj
Reported Depreciation Amortization Compensation Other (1) EBITDA
Net revenue $ 360,093 $ - $ - $ - $ - $ 360,093
Cost of revenue 226,305 (2,365) - (928) - 223,012
Gross Profit 133,788 2,365 - 928 - 137,081
Operating expenses 84,621 (1,994) (889) (4,621) (550) 76,567
Operating income 49,167 4,359 889 5,549 550 60,514
Interest expense 467
Other non-operating expense (income), net (3,757) 2,823 (934)
Income before income tax 52,457
Income tax expense 13,711
Net income $ 38,746 Adjusted EBITDA $ 61,448
1. Other includes certain business acquisition costs, gain on an acquisition-related settlement and change in fair value of contingent consideration. 29The picture can't be displayed.
GAAP NET INCOME TO ADJUSTED EBITDA RECONCILIATION
TWELVE MONTHS ENDED DECEMBER 31, 2019
Adj
As Adj Adj Stock Adj
Reported Depreciation Amortization Compensation Other (2) EBITDA
Net revenue $ 234,663 $ - $ - $ - $ - $ 234,663
Cost of revenue 155,950 (1,950) - (150) - 153,850
Gross Profit 78,713 1,950 - 150 - 80,813
Operating expenses 68,286 (2,606) (642) (3,408) (3,516) 58,114
Operating income 10,427 4,556 642 3,558 3,516 22,699
Interest expense 929
Other non-operating expense (income), net (2,209) 2,072 (137)
Income before income tax 11,707
Income tax benefit (6,237)
Net income $ 17,944 Adjusted EBITDA $ 22,836
2. Other includes certain business acquisition costs, gain on an acquisition-related settlement and change in fair value of contingent consideration. 30You can also read