Investor Presentation - QUALITY-OF-LIFE MINERALS RESPONSIBLY MEETING GLOBAL DEMAND FOR
←
→
Page content transcription
If your browser does not render page correctly, please read the page content below

RESPONSIBLY MEETING
                        GLOBAL DEMAND FOR

                         QUALITY-OF-LIFE
                         MINERALS

Investor Presentation
January 2022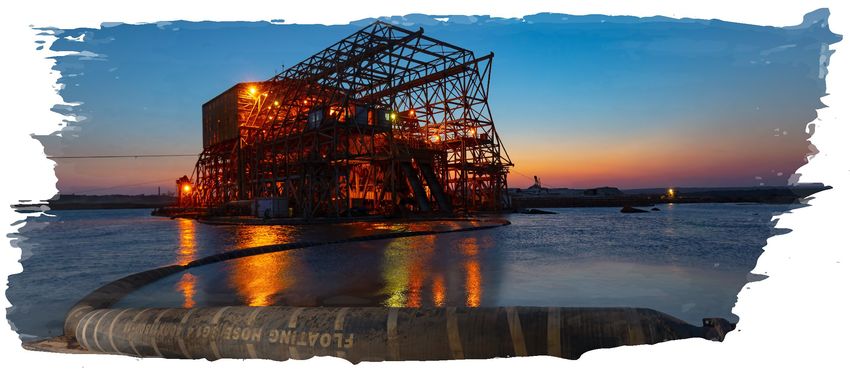
Disclaimer
This Presentation (the “Presentation”) has been        This Presentation does not constitute or form part       statements in this Presentation relating to future
prepared and issued by Kenmare Resources plc           of, and should not be construed as, an offer,            financials, results, plans and expectations
(the “Company” or “Kenmare”). While this               invitation or inducement to purchase or subscribe        regarding the Company’s business, growth and
Presentation has been prepared in good faith, the      for any securities of the Company nor shall it or        profitability, as well as the general economic
Company and its respective officers, employees,        any part of it form the basis of, or be relied upon in   conditions to which the Company is exposed, are
agents and representatives expressly disclaim any      connection with, any contract or investment              forward looking by nature and may be affected by
and all liability for the contents of, or omissions    decision relating to such securities, nor does it        a variety of factors. The Company is under no
from, this Presentation, and for any other written     constitute a recommendation regarding the                obligation to update or keep current the
or oral communication transmitted or made              securities of the Company.                               information contained in this Presentation, to
available to the recipient or any of its officers,                                                              correct any inaccuracies which may become
                                                       This Presentation is as of the date hereof. This
employees, agents or representatives.                                                                           apparent, or to publicly announce the result of
                                                       Presentation includes certain statements,
                                                                                                                any revision to the statements made herein and
No representations or warranties are or will be        estimates and projections provided by the
                                                                                                                any opinions expressed in the Presentation or in
expressed or are to be implied on the part of the      Company with respect to the anticipated future
                                                                                                                any related materials are subject to change
Company, or any of its respective officers,            performance of the Company or the industry in
                                                                                                                without notice.
employees, agents or representatives in or from        which it operates. Such statements, estimates and
this Presentation or any other written or oral         projections reflect various assumptions and
communication from the Company, or any of its          subjective judgments by the Company’s
respective officers, employees, agents or              management concerning anticipated results,
representatives concerning the Company or any          certain of which assumptions and judgments may
other factors relevant to any transaction involving    be significant in the context of the statements,
the Company or as to the accuracy, completeness        estimates and projections made. These
or fairness of this Presentation, the information or   assumptions and judgments may or may not
opinions on which it is based, or any other written    prove to be correct and there can be no
or oral information made available in connection       assurance that any projected results are
with the Company.                                      attainable or will be realised. In particular, certain

Kenmare Resources – Investor Presentation January 2022                                                                                                          2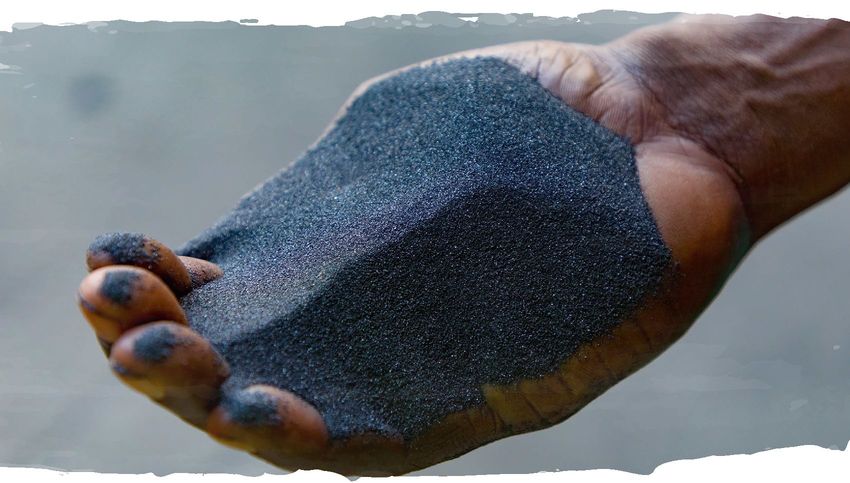
Overview: Kenmare Resources
The world’s largest ilmenite producer
Moma Mine in Mozambique Wet Concentrator Plant B mining at Pilivili
15 years of production with >30 years in Mozambique
>100 years life of mine
Low environmental impact – 90% of power from renewable
source (hydropower)
Meaningful contribution to the local and national economy
Market-leading position
Four product streams: ilmenite, zircon, rutile and mineral sands
concentrate (monazite)
Kenmare production represents 8% of global supply 2020 Revenue by product
Key raw materials in the manufacture of paints, paper and Concentrates Rutile 3%
plastic 7%
Significant capital investment Primary zircon 19%
Capital expenditure of ~US$1.4bn to date
Three development projects delivered between 2018 and 2020
to increase production to 1.2 million tonnes per annum (Mtpa)
Ilmenite 72%
of ilmenite, plus associated co-products
Kenmare Resources – Investor Presentation January 2022 3
Delivering increased production and profitability
Ramping up to 1.2 Mtpa ilmenite production

                            GROWTH                                       46%               2021 was a record year for
                                                                                             safety, production and
                                                                        production                 shipments
Guidance of 1.125 to 1.225 Mt of ilmenite (plus associated               increase
co-products) in 2022

                            MARGIN                                       49%1              H1 2021 EBITDA margin up
                            EXPANSION                                     EBITDA           significantly from 33% in H1
                                                                                                       2020
                                                                          margin
Kenmare is targeting a first quartile position on the
industry revenue to cost curve

                            SHAREHOLDER
                            RETURNS
                                                                     ~US$100m                USc7.29/sh 2021 interim
                                                                                             dividend and US$81.6m
                                                                          2021 total        returned to shareholders
Targeting a 25% Profit After Tax (PAT) dividend payout               shareholder returns     through share buy-back
ratio in 2021, up from 20% previously

1. EBITDA margin based on EBITDA over free on board (FOB) revenues

Kenmare Resources – Investor Presentation January 2022                                                                    4
Sustainability
Committed to safety and sustainability
Over six million hours worked in 2021 without a Lost Time Injury
Safety Sustainability COVID-19
Lowest ever Lost Time Injury Inaugural Sustainability Report 96% of employees at the Moma
Frequency Rate (LTIFR) in 2021 published for year-end 2020 Mine had received two doses of the
88% improvement in LTIFR vs 2020 Inaugural Climate Strategy Report vaccine by year-end
One year without a Lost Time Injury to be published for year-end 2021 12,000 vaccines donated for local
achieved on 6 January 2022 communities
Kenmare Resources – Investor Presentation January 2022 5
FY 2021 production review
Record year for production and shipments
30% increase in HMC production vs FY 2020 HMC production Ilmenite
Benefitted from 19% increase in ore grades (4.63% THM) following
WCP B’s relocation to Pilivili in Q3 2020 1,555,900t 1,119,400t
+30% +48%
14% increase in excavated ore volumes due to a full year of
FY 2020: 1.,201,100t FY 2020: 756,000t
production in 2021, whereas 2 months were lost due to WCP B
move in 2020
Primary zircon Rutile
Record product volumes 358,700t
All product volumes benefitted from increase in HMC processed 56,300t 8,900t
HMC production
48% increase in ilmenite production also benefitted from higher +30% +48%
ilmenite content in HMC from Pilivili FY 2020: 43,300t FY 2020: 6,000t
51% increase in shipments vs FY 2020
Concentrates Shipments
Record shipments reflect increased production in addition to a
drawdown of finished product inventory
Also benefitted from increased transhipment capacity following
43,900t 1,285,300t
+25% +51%
upgrade work earlier in the year FY 2020: 35,200t FY 2020: 853,100t
Focused on achieving 1.2 Mtpa ilmenite production on a sustainable basis
Kenmare Resources – Investor Presentation January 2022 6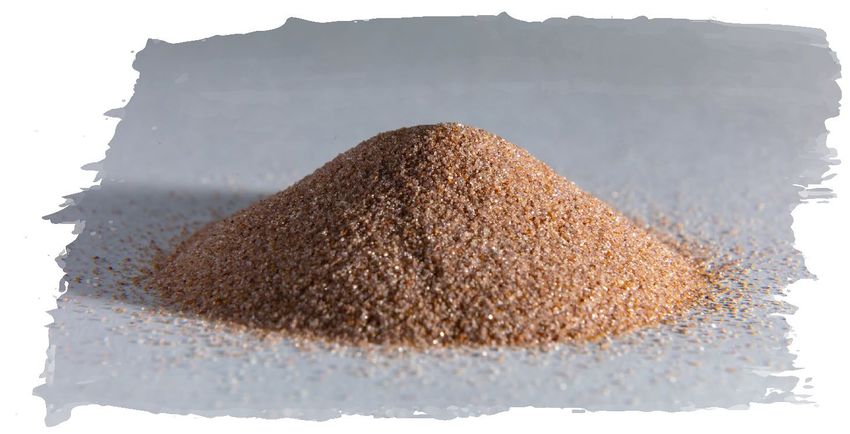
Financial strength and flexibility
   Year -end highlights                                Capital projects                                          H1 2021 Highlights

   Net Debt (US$m)                                     RUPS1                                                  Revenue (CIF) (US$m)     EBITDA (US$m)

        US$82.8m                                             Underway                                             US$178.2m               US$82.3m
   31.12.2020: US$64.0m                                 Expected completion                                     H1 2020: US$116.8m      H1 2020: US$37.2m
                                                              Q1 2022

   Cash (US$m)                                         Nataka PFS                                            Profit After Tax (US$m)   Interim Dividend

         US$69.1m                                            Underway                                              US$48.0m                 USc7.29
    31.12.2020: US$87.2m                               PFS expected in 2022,                                     H1 2020: US$12.7m       H1 2020: USc2.31
                                                       ahead of move in 2025

1. Rotary Uninterruptible Power Supply (reducing reliance on diesel generators and reducing CO2 emissions materially)
2. Free on board (FOB) – received prices less shipping costs
Kenmare Resources – Investor Presentation January 2022                                                                                                      7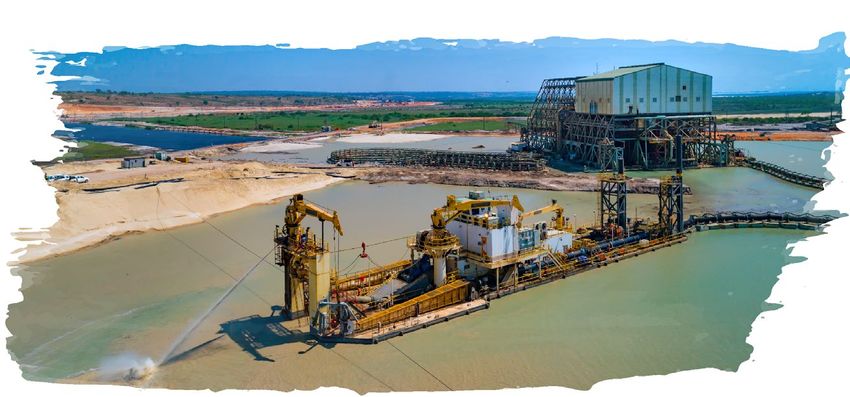
Development projects
1.2Mtpa ilmenite projects delivering HMC pumped from Pilivili arriving at MSP
WCP B Move
Substantially complete
Work is underway to increase utilisation rate of the pumping system
to transport HMC from Pilivili to the MSP
Road haulage will continue to be reduced as these improvements take
effect, which is expected to benefit operating costs
WCP C Development
Remedial actions on concentrator completed
Plant operating at design 500tph, >80% utilisation and with product
grade and recoveries above plan
RUPS factory acceptance testing
Closing out project with final costing US$43.5 million (below budget
of US$45 million)
Rotary Uninterruptable Power Supply (RUPS)
Aim of RUPS is to improve MSP utilisations, whilst reducing carbon
footprint through 15% reduced diesel consumption across the Mine
Construction of RUPS project is approaching completion – all of RUPS
equipment is now on site
Project cost forecast to be US$18 million, with commissioning
expected in Q1 2022
Kenmare Resources – Investor Presentation January 2022 8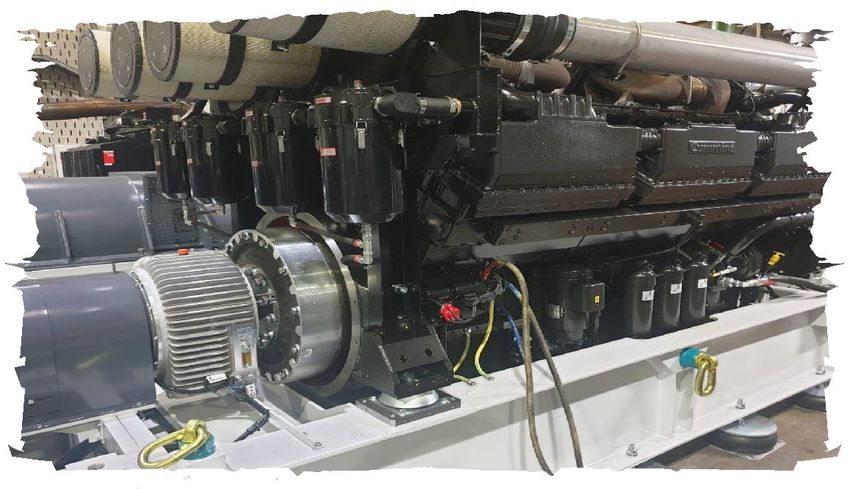
Nataka PFS on track for delivery in 2022
Nataka mining expected to commence in 2025
Hydromining trial at WCP A
Developing orebody knowledge for resource confidence and
mining resilience
To be completed in 2021:
Geotechnical testing including wide coverage CPTu drilling and
trial pit
Hydrogeological exploration and modelling
Resource modelling and product quality assessment
Orebody slimes management
Hydromining trial successfully completed in Namalope: low cost
supplementary method to support dredging in higher slimes Long term production at 1.2Mtpa ilmenite
Process flowsheet developed and test work underway to manage
slimes 2,000kt
Tails deposition strategies under review 1,600kt
PFS due in 2022 1,200kt
Facilitates the relocation of WCP A and WCP C to Nataka 800kt
Relocation of WCP A likely to be by dredging a corridor to a 20- 400kt
year high grade path, rather than by road 0kt
Studies commenced to address the 2025 shortfall in HMC to
2031
2033
2035
2037
2039
2021
2023
2025
2027
2029
2041
2043
2045
2047
2049
achieve 1.2Mt ilmenite production on a sustainable basis
HMC - Production Ilmenite - Production
Kenmare Resources – Investor Presentation January 2022 9
~US$100m shareholder returns in 2021
Increased dividend payment in H1 2021 and share buy-back completed
Dividends (USc/share) Share buy-back
10 # of shares repurchased % of ISC repurchased
7.7
5
5.5
14.8m 13.5%
7.3
2.7 Total cash returned ISC following completion
2.3
0
2019 2020 2021 US$81.6m 94.9m
Interim Final 2021 Interim
Dividend summary Share buy-back summary
Kenmare is targeting a dividend payout ratio of 25% of Kenmare completed a share buy-back in December 2021
Profit After Tax for 2021 14.8m shares (13.5% of ISC) repurchased at a price of
H1 2021 dividend of USc7.29 per share – up 217% vs H1 £4.17/sh
2020 Executes on Kenmare’s intention to shareholder returns
Targeting a one-third/two-thirds interim/final dividend split after the successful completion of its major capital projects
2021 final dividend will be a balancing payment to meet the Share buy-back was supported by robust operational
dividend policy performance and commodity market strength in 2021
1. 2021 interim dividend is calculated as 66.6% of 25% of H1 2021 profit after tax (US$48.0m)
Kenmare Resources – Investor Presentation January 2022 10Market Update Titanium feedstocks
Record sales at higher prices for all products
Market absorbing increased Kenmare production at higher prices
Sales price (FOB) (US$/t)
$300/t
$200/t
$100/t
$0/t
H1 H2 H1 H2 H1 H2 H1 H2 H1
2017 2018 2019 2020 2021
Ilmenite price ($/t) Average price ($/t)
Recovery in downstream markets resulted in strong demand for Kenmare’s products
51% increase in shipments in FY 2021 vs FY 2020
Price increases for ilmenite and zircon achieved in Q2, Q3 and Q4 2021
Global economic growth following the COVID-19 pandemic has resulted in strong demand for titanium feedstocks and zircon
Positive market conditions across all regions and end-use markets
Kenmare Resources – Investor Presentation January 2022 12Strong global demand for Kenmare ilmenite
Average received ilmenite price up 13% in Q4 vs Q3 2021
Ilmenite sales volumes by region Ilmenite upgrading in China remains a key growth market1
40 15
Asia ex-China Americas
30
10
'000 tonnes
'000 tonnes
20
5
10
Europe 0 0
Jul-19
Jul-20
Jul-21
Oct-19
Jan-19
Jan-20
Oct-20
Apr-19
Apr-20
Jan-21
Apr-21
China
Chloride pigment production (LHS) Titanium sponge production (RHS)
High demand from pigment producers and ilmenite supply constraints creating tight market
~90% of demand for titanium feedstocks (ilmenite and rutile) is attributable to titanium pigment
Global titanium pigment production reached a record high in 2021 and the titanium metal market also strengthened
Growing ilmenite beneficiation in China is supported by chloride pigment and titanium sponge market - Kenmare remains a
preferred supplier to this market
Supply constraints for high-grade feedstocks, like rutile, have also resulted in higher demand for ilmenite as consumers look for
alternative supply sources
1. Source: Toodudu
Kenmare Resources – Investor Presentation January 2022 13Positive momentum continuing into 2022 Q4 2021 review and 2022 outlook Ilmenite Ilmenite Robust ilmenite market continued through Q4 2021, with demand for Kenmare’s ilmenite exceeding ability to supply Global ilmenite inventories remain at low levels and supply constraints are adding to the demand for Kenmare ilmenite Pricing momentum has continued into 2022 Kenmare is also experiencing very strong demand for its rutile product and will benefit from the current higher market prices Zircon Zircon Zircon market accelerated in H2 2021 as major economies continued the recovery from COVID-19 restrictions lifting Zircon demand improved in all regions, with China and Europe particularly strong Significant zircon supply constraints are exacerbating the tight market and inventories are at low levels Quarter-on-quarter price increases achieved in Q2, Q3 and Q4 2021 and further increases are expected in Q1 2022 Kenmare Resources – Investor Presentation January 2022 14
Outlook

          R71,125

                    Jetty at sunrise
2022 production guidance Kenmare is well advanced in achieving targeted production of 1.2 Mtpa ilmenite on a sustainable basis Production FY 2022 Guidance FY 2021 Actual FY 2020 Actual Ilmenite tonnes 1,125,000 - 1,225,000 1,119,400 756,000 Primary zircon tonnes 54,400 - 63,200 56,300 43,300 Rutile tonnes 9,500 - 11,500 8,900 6,000 Concentrates1 tonnes 40,300 - 46,800 43,900 35,200 Costs Total cash operating costs US$m 190 - 210 N/R2 158 Cost per tonne US$/tonne 148 - 171 N/R2 188 Production of all finished products expected to increase in FY 2022, due mainly to higher tonnes mined, more than offsetting lower than anticipated ore grades FY 2021 total cash operating costs are expected to be ~3% above the upper end of guidance (US$166-184m) due primarily to higher repairs and maintenance costs, HMC haulage costs and increased costs relating to COVID-19 Total cash operating costs are anticipated to increase in FY 2022 due to higher tonnes mined and inflation Expected expenditure of US$28.5m on development projects and studies and sustaining capital of US$33m Shipments are expected to be lower than production in FY 2022 due to the scheduled dry dock of the Bronagh J transshipment vessel, which will temporarily reduce shipping capacity Guidance provided on 13 January 2022 1. Concentrates includes secondary zircon and mineral sands concentrate. 2. To be provided with 2021 Preliminary Results Kenmare Resources – Investor Presentation January 2022 16
Becoming a first quartile margin producer
Kenmare is well-positioned to deliver strong free cash flow
Industry revenue to cash cost curves
4
Revenue to Cash Cost Ratio
3
2
KMR KMR
1 2023 KMR
2018
Q1 2013
Q2
Q4
0
0% 25% 50% 75% 100%
2013 2018 2023
Kenmare is on track to become a first quartile margin producer
This is expected to deliver increased cash flow stability
Ability to remain cash flow positive throughout the commodity price cycle
Source: TZMI
Kenmare Resources – Investor Presentation January 2022 17Building on our strategy
Strategy FY 2021 Performance FY 2022 Targets
Growth: Production rising to 1.2 Mtpa ilmenite
Record year for production and Focused on delivering 1.2 Mtpa
Low capital intensity growth to
shipments ilmenite production sustainably
fully utilise existing installed
facilities 46% increase in final product Market momentum continuing in Q1
production in FY 2021 vs FY 2020 2022
Margin expansion: 1.2Mtpa production is expected to deliver increased EBITDA margins
Reduction in haulage from Pilivili
Focus on margin expansion H1 2021 EBITDA margin up to 49% anticipated to save costs
through cost reductions and/or
increased revenue streams Up from 33% in H1 2020 RUPS project expected to reduce
diesel usage and lower costs
Shareholder returns: From 2021 free cash flow is expected to strengthen, enabling increased shareholder returns
Pay a minimum dividend of 20% Interim dividend up 217% Targeting a 25% profit after tax
profit after tax to shareholders, dividend for 2021
Share buy-back completed,
while maintaining balance sheet
returning US$81.6m to shareholders Final dividend will be a balancing
strength and flexibility
payment
Kenmare Resources – Investor Presentation January 2022 18Appendices
Mining at WCP AMineral sands: essential to modern life
Two core product streams, titanium feedstocks & zircon
World GDP vs TiO2 pigment consumption1
Titanium feedstocks (ilmenite and rutile)
TiO2 pigment imparts whiteness and opacity in the 6 450
Global GDP Index
Million tonnes
manufacture of paints, plastics and paper
4 300
Non-recyclable and difficult to substitute
2 150
Zircon
An important raw material for the ceramics industry for wall 0 0
1982
1986
1966
1970
1974
1978
1990
1994
1998
2002
2006
2010
2014
tiles, floor tiles and sanitary ware
Favoured for whiteness, opacity, high melting point and shock Pigment consumption GDP Index (RHS)
resistance
Emerging market zircon and pigment demand growing rapidly Regional pigment consumption (2017)2
Pigment is “quality of life” product, consumption grows India
as income levels increase Brazil
Significantly higher TiO2 pigment consumption per capita in China
developed western economies Japan
Large population developing economies are set for strongest Europe
pigment and zircon demand growth USA
0.0 1.0 2.0 3.0
kg/capita
Demand for TiO2 feedstocks and zircon is driven by global GDP growth and urbanisation in emerging markets
1: Source: Company (1966 GDP base year)
2: Source: Company
Kenmare Resources – Investor Presentation January 2022 20Overview: Moma Titanium Minerals Mine
Globally significant Mineral Reserves
Tier 1 resource base Operational process outline
>100 year life of mine at targeted production
rate of 1.2 Mtpa Wet Heavy mineral
Dredge + dry mining concentrator concentrate
Moma is comprised of multiple ore zones – 6.4
billion tonnes of Mineral Resources plant Dune (HMC)
rehabilitation
Current mine plan runs beyond 2040
Low cost, bulk mining operation
Mineralised
Mature operation – in production since 2007 sand Mining pond
Three Wet Concentrator Plants (WCPs) in
operation – two mining the Namalope ore zone
and one mining at Pilivili
Mineral Separation Product storage Transhipment Customer
Dedicated on-site port facilities Plant warehouse vessel bulk carrier
Low environmental impact
Market
Primarily hydro-generated power (90% of
power demand in 2020)
Progressive rehabilitation of mined areas Wet high intensity Magnetic separation
magnetic Gravity separation
separation Electrostatic separation Conveyor and jetty
No chemicals used
Kenmare Resources – Investor Presentation January 2022 21EBITDA margin increased to 49% (H1 2020: 33%)
H1 2021 income statement Revenue (FOB) by product (%)
H1 2021 H1 2020 H1 2021 H1 2020
US$ million US$ million Concentrates Rutile
Rutile
Revenue (CIF) 178.2 116.8 Zircon 3% Concentrates 3%
0%
11% 7%
Freight costs (10.4) (5.6)
Zircon
Revenue (FOB) 167.8 111.2 19%
Cost of sales & other operating costs (119.5) (96.9)
Operating profit 58.7 19.9 Ilmenite
Ilmenite
Net finance cost (6.1) (4.6) 86% 72%
Foreign exchange (loss)/gain (2.0) 0.7
51% increase in revenues (FOB) with 44% higher sales
Profit before tax 50.6 16.0
volumes and 5% higher sales prices (FOB)
Tax (2.6) (3.3)
Reduction in tax despite higher profits due to increased
Profit after tax 48.0 12.7 tax shield following 2020 PPE additions
278% increase in profit after tax and 121% increase in
EBITDA 82.3 37.2 EBITDA, driven by higher product output at improved
margin
Volumes ↑, prices ↑, unit costs ↓ = profit after tax ↑278%
Kenmare Resources – Investor Presentation January 2022 22H1 2021: Unit costs reduced on increased production
H1 2021 cash operating costs reconciliation1
Unit H1 2021 H1 2020 16% (US$12.1m) increase in adjusted cash
operating costs, due primarily to:
Cost of sales US$m 100.3 82.7
Increased COVID-19 costs US$2m
Other operating costs excluding freight US$m 8.8 8.6
Increased maintenance costs US$3m
Total costs less freight 109.1 91.3
HMC haulage costs US$3m
Depreciation US$m (23.5) (17.3) Increased mining royalties and
Share-based payments US$m (2.1) (1.0) processing taxes US$1m
Product stock movements US$m 3.8 2.2
22% decrease in cash operating cost per
Adjusted cash operating costs US$m +16% 87.3 75.2 tonne driven by higher production
volumes (+49%)
Finished product production tonnes +49% 612,100 410,600
Total cash operating cost per tonne US$ -22% 143 183 Net ilmenite unit cost reduced to
US$113/t from US$119/t in H1 2020.
Total cash operating costs less co-products revenue (FOB) US$m +44% 63.3 43.9
Reduction lower than all product cost
Ilmenite production tonnes +52% 559,000 368,900 per tonne due to lower co-product
revenues in H1-2021
Total cash cost per tonne of ilmenite US$ -5% 113 119
Unit costs decreased in H1 2021 as a result of increased production
1. Analysis reconciles Income Statement to cash operating cost to run business
Kenmare Resources – Investor Presentation January 2022 23H1 2021: Unit costs down 23% on prior half periods
Unit cost reduction driven by higher product volumes
800kt $200/t
700kt $175/t
42.8
600kt $150/t
500kt $125/t
Cost per tonne ($/t)
Production (kt)
400kt $100/t
300kt $75/t
200kt $50/t
100kt $25/t
0kt $0/t
H1 H2 H1 H2 H1 H2 H1 H2 H1
2017 2018 2019 2020 2021
Production (kt) Cost per tonne ($/t) Ilmenite Cost per tonne ($/t)
Total cost per tonne reduced to US$143 per tonne in H1 2021 driven by higher production volumes
Ilmenite cost per tonne impacted by lower co-product sales volumes in H1 2021
2022 total cost guidance of US$190-210m and cost per tonne guidance of US$148-171/t
Kenmare Resources – Investor Presentation January 2022 24Financially well-resourced
H1 2021 balance sheet review
30-Jun-2021 31-Dec-2020
PPE movement includes additions US$23.6m (H1
US$ million US$ million
2020: US$59.2m), less mine closure adjustment
Property, plant & equipment 956.6 961.7 (US$5.2m) & depreciation (US$23.5m)
Inventories 69.6 63.7
Trade & other receivables 51.3 29.9 Inventories up - consumable spares by US$2.1m and
mineral products by US$3.8m
Deferred tax asset - 0.2
Cash 56.5 87.2 Trade receivables up, mainly due to increased
Total assets 1,134.0 1,142.8 shipments and non-utilisation of the invoice
discounting facility.
Equity & reserves 940.0 900.5 US$20m RCF loan principal repaid in H1 2021,
Bank loans 128.0 145.8 reflecting start of debt reduction.
Leases 2.8 3.3
US$24.8m reduction in payables and accruals to more
Creditors & provisions 63.2 93.2 normalised levels from year end. Mine closure
Total equity & liabilities 1,134.0 1,142.8 provision reduced by US$5.2m.
Balance sheet remains robust as de-gearing starts with repayment of US$20m RCF
Kenmare Resources – Investor Presentation January 2022 25Financially robust
Flexible debt and trade facilities in place
30-Jun-2021 31-Dec-2020
US$ million US$ million Interest rate Term
Term Loan 110.0 110.0 LIBOR +5.4% March 2025
Revolving Credit Facility 20.0 40.0 LIBOR +5.0% December 2022
Total debt 130.0 150.0
Cash 56.5 87.2
Facilities Summary
Debt facilities fully drawn in 2020 to ensure sufficient liquidity to complete WCP B move, given COVID-19 uncertainty
Term Loan repayments commencing in March 2022, seven half-yearly payments
Revolving Credit Facility, US$20m repaid in H1 2021, flexibility to repay more as appropriate
Other finance facilities in place for invoice discounting
• Significant cash resources, appropriate and flexible debt & trade facilities in place
Kenmare Resources – Investor Presentation January 2022 26Total cash operating costs
Adjusted cash operating costs breakdown
Power Fuel Power Fuel
11% 7% 12% 8%
Production Production
Repairs & Overheads Overheads
Maintenance 17% Repairs & 15%
24% H1 2021 Maintenance H1 2020 Logistics &
22% Travel
US$87.3m Logistics & US$75.2m 6%
Travel
6% Distribution
Other Costs
Other Distribution 3%
Labour Labour 9%
9% Costs
payroll payroll
3%
23% 25%
16% increase due primarily to:
Increased COVID-19 costs (US$2m) in H1 2021, reflecting a comparative (to H1 2020) return to more normalised work & travel patterns whilst
maintaining significantly increased sanitation, testing and vaccination efforts in the period.
Additional HMC road haulage cost (US$3m) for HMC now produced by WCP B in Pilivili, this will continue to be incurred until HMC pumping system is
fully commissioned.
Increased maintenance costs (US$3m), reflective of WCP C now operating for a full period and increased output levels from WCP B.
HMC Royalty and Industrial Free Zone taxes increased by a combined US$1m, reflecting increased HMC output, increased sales volumes and higher final
product prices.
Kenmare Resources – Investor Presentation January 2022 27Follow Kenmare on social media Facebook, Twitter and LinkedIn Kenmare has profiles on Facebook, Twitter and LinkedIn, which feature regular updates on our corporate social responsibility initiatives, operational and development milestones, news flow and more Click the name of the social network to visit out profiles and connect with Kenmare: Facebook, Twitter and LinkedIn Kenmare Resources – Investor Presentation January 2022 28
Contact Us
Jeremy Dibb /
Katharine Sutton
+353 1 671 0411
ir@kenmareresources.com
                          Jetty at sunset
Follow Us
You can also read