FY 2021/22 Earnings Presentation - BTS Group Holdings
←
→
Page content transcription
If your browser does not render page correctly, please read the page content below
FY 2021/22 Earnings Presentation
Investment involves risk. Prospective should understand the characteristics of Securities and study information about BTS Group Holdings Public Company Limited (the “Company”)
             before making a decision to invest in Securities. This presentation is for information purposes only and is intended only for the initial direct attendee of the presentation. It may not be
             reproduced or redistributed to any other person. It shall not and does not constitute either an offer to purchase or buy or a solicitation to purchase or buy or an offer to sell or exchange
             or a solicitation to sell or exchange any securities of BTS Group Holdings PCL (the "Company") or any of its subsidiaries in the United States of America or in any other jurisdiction or an
             inducement to enter into investment activity. No part of this presentation, nor the fact of its existence, should form the basis of, or be relied on in connection with, any contract or
             commitment or investment decision whatsoever. No representation, warranty or undertaking, express or implied, is made as to, and no reliance should be placed on, the fairness,
             accuracy, completeness or correctness of the information or the opinions contained herein.

Disclaimer
             This presentation is not to be relied upon in any manner as legal, tax or any other advice and shall not be used in substitution for the exercise of independent judgment and each person
             made aware of the information set-forth hereof shall be responsible for conducting its own investigation and analysis of the information contained herein. Except where otherwise
             indicated, the information provided in this presentation is based on matters as they exist as of the date stated or, if no date is stated, as of the date of preparation and not as of any
             future date, and the information and opinions contained herein are subject to change without notice. None of the Company nor any of its subsidiaries accepts any obligation to update
             or otherwise revise any such information to reflect information that subsequently becomes available or circumstances existing or changes occurring after the date hereof. None of the
             Company or any of its subsidiaries or any of their respective directors, officers, employees or agents shall have any liability whatsoever (in negligence or otherwise) for any loss
             howsoever arising from any use of this presentation or its contents or otherwise arising in connection with the presentation and any and all such liability is expressly disclaimed.

             The information contained herein must be kept strictly confidential and may not be reproduced or redistributed in any format without the express written approval of the Company.
             Some statements made in this presentation are forward-looking statements, which are subject to various risks and uncertainties. These include statements with respect to the
             Company’s corporate plans, strategies and beliefs and other statement that are not historical facts. These statement can be identified by the use of forward-looking terminology such
             as “may”, “will”, “expect” , “intend”, “estimate”, “continue”, “plan” or other similar words. The statements are based on the assumptions and beliefs of the Company’s management in
             light of the information currently available to the Company. These assumptions involve risks and uncertainties which may cause the actual results, performance or achievements to be
             materially different from any future results, performance or achievements expressed or implied by such forward-looking statements. Nothing in this Presentation is or should be relied
             on as promise or representation of the Company as to the future.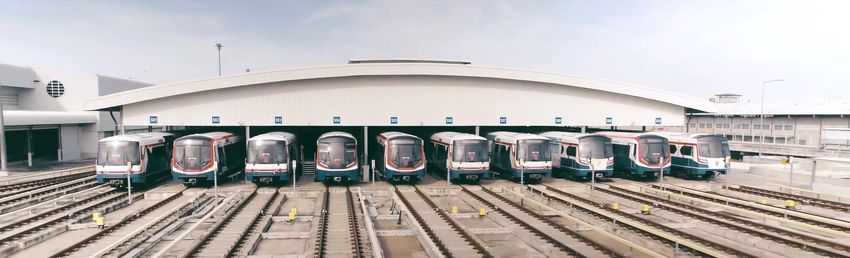
BTS Group – The Carbon Neutral Company

                       BTS VALUES

                                                            NO.1
                                                       DJSI global industry leader

                                                  The first and only carbon neutral rail
                                                          mass transit company
              Delivering             Creating
              Customer              shareholder
             satisfaction              value

             Supporting              Developing
             sustainable            communities
               growth

 FY 2020/21 EARNINGS PRESENTATION                                                          07
                                                                                            3   .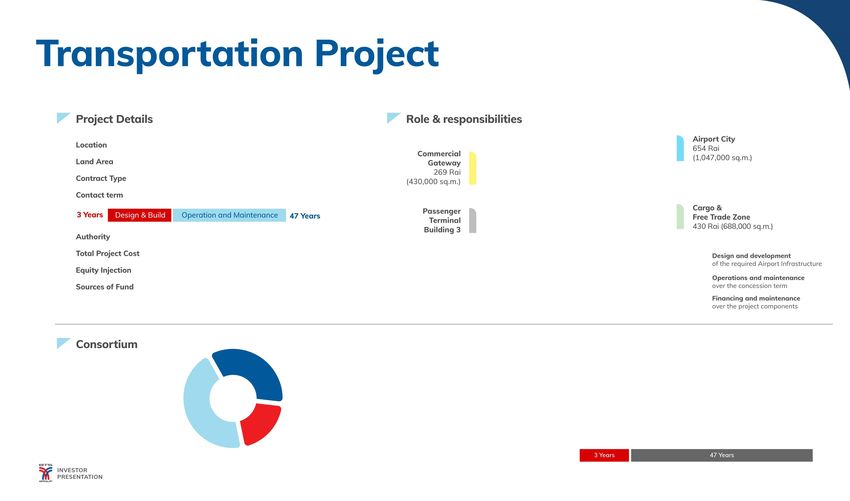
FY 2020/21 Highlights
P&L
P&L HIGHLIGHTS
HIGHLIGHTS FINANCIAL
FINANCIAL POSITION
POSITION 12M CASH FLOW
Profitability resilience amid Balance sheet Financing earmarked for MOVE
COVID-19 pandemic remains strong investment supported by Asset sales
Operating Revenue of THB 34.9bn Cash & Liquid Investments Cash received
THB 16.3bn from Land sale and VGI sale
6% YoY
THB 13.2bn
Recurring EBITDA of THB 8.8bn Net investments in
Low leverage Pink & Yellow Lines & Green Extensions
9% YoY
THB 23.7bn
Adjusted Net D/E
1.28x
Net Profit of THB 4.6bn Net increase of long-term loans
44% YoY & debenture
THB 23.8bn
FY 2020/21 EARNINGS PRESENTATION
4
.
FY 2020/21 Overview
 P&L Snapshot

 INCOME STATEMENT (THB mn)                                                                                                                                          FY 2020/21                                   FY 2019/20            %YoY
 Operating revenue1                                                                                                                                                    34,938                                      37,169               (6)%
 Total revenue                                                                                                                                                        42,379                                       42,242                0%
 Gross operating profit                                                                                                                                                  6,331                                     6,827                (7)%
 Recurring EBITDA2                                                                                                                                                       8,800                                     9,642                (9)%
 Recurring net profit – after MI                                                                                                                                         3,738                                     4,776               (22)%
 Net income (loss)3                                                                                                                                                      4,576                                     8,162               (44)%
 Gross operating profit margin (%)                                                                                                                                      18.1%                                      18.4%
 Recurring EBITDA margin (%)                                                                                                                                            25.2%                                      25.9%
 Recurring net profit margin – after MI(%)                                                                                                                               9.6%                                      11.3%
 1 Operating revenue from the operational performance of 4 BUs excludes interest income, dividend income and non-recurring items.
 2  Core EBITDA calculated from the operational performance of 4 BUs, interest income, dividend income, other income, net share of profit /(loss) from associates/ JV, yet, excludes other non-recurring items
 3 to equity holders of the parent

 FY 2020/21 Operating Revenue Breakdown                                                                                                              Operating Revenue Comparison (YoY)
                                                                                                                                                      THB mn
                                                                                                            Free Float                                                              7%                  (55)%              (54)%
                                                                                                          (as of Jun 20)
                                                                                                                                                                                 2,092                 (3,252)         (1,072)
                                                                                    MIX
     MOVE                                 THB                                                                                                        37,169
                                                                                    7%
     90%                                 34.9bn
                                                                              MATCH                                                                                                                                                34,938
                                                                                 3%

                                                                                                                                                    FY 19/20                     MOVE                    MIX            MATCH      FY 20/21
     FY 2020/21 EARNINGS PRESENTATION
                                                                                                                                                                                                                                               5
                                                                                                                                                                                                                                               .
FY 2020/21 Cash Flow Snapshot
 CFO                                                                             CFI                                                                   CFF
 • Profit before tax of THB 7,286mn, deducted by                                 • net investment for construction of the Pink and Yellow Lines of     • net increase in long-term loans from financial institutions of THB
 • Non-cash reconciling items of THB 2,112mn                                       THB 11.7bn                                                            20.2bn mainly for the drawdown of syndicated loans related to
 • Changes in net working capital of THB 19.4bn (this                            • cash paid for purchases of investments in subsidiaries, asso/ JVs     the Pink & Yellow lines.
   includes net investment in mass transit projects of                             of THB 6.7bn mostly from the acquisition of Mo Chit Land as         • net cash received from sales of investment in subsidiaries of
   THB 12.0bn)                                                                     well as the investments in KEX, UTA, BGSR 8 and BGSR 81               THB 7.8bn chiefly from sale of VGI
                                                                                 • net cash received from sales of investments in financial assets     • Net increase in long-term debentures of THB 3.6bn resulted
                                                                                   of THB 5.9bn                                                          from the issuance of THB 8.6bn Green Bond in Nov 20, partly
                                                                                 • cash received from settlement received from sale of investments       offset with the partial repayment of THB 5.1bn from THB 9.5bn
                                                                                   in joint ventures of THB 5.4bn (mostly from receiving the             debenture in Sep 2020 and THB 7.0bn debenture in Dec 20
                                                                                   remaining proceeds of the sale of Bayswater land)                   • dividend payment of THB 5.9bn
                                                                                 • cash received from return of capital of associate of THB 0.8mn
                                                                                 • dividend received of THB 0.7mn

    (THB mn)

                        3,226                                  (19,712)1                            (6,350)2                         26,686                          (21)                            3,8293

                   Beginning cash                                  CFO                                 CFI                             CFF                          Others                        Ending cash
                     (31/3/20)                                                                                                                                                                     (31/3/21)

1 CFO  after
Corporate income tax of THB 2,405mn
Net interest expenses of THB 3,110mn
Net investment for construction of the Pink and Yellow Lines of THB 7.8bn
Net investment for E&M works and trains procurement for Green Line extension of THB 4.2bn
2 CFI included net investment for construction of the Pink and Yellow Lines of THB 11.7bn
3 Excluding liquid investments of THB 12.5bn

        FY 2020/21 EARNINGS PRESENTATION
                                                                                                                                                                                                                              6
                                                                                                                                                                                                                              .
MOVE business
Operating Performance
(THB mn) FY 2020/21 FY 2019/20 %YoY
Operating Revenue 31,401 29,308 7%
Costs of revenue 26,078 25,961 (2)%
Gross profit 5,323 3,618 47%
Mass Transit interest income 2,680 1,920 40%
Share of profit from BTSGIF 235 848 (72)%
Recurring EBITDA 8,120 6,324 28%
Gross operating profit margin (%) 17.0% 12.3%
Recurring EBITDA margin (%) 25.9% 21.6%
Historical Operating Revenue (THB bn) FY 2020/21 MOVE revenue of THB 31.4bn, relatively flat YoY
Revenue from development of new lines Construction revenue for Pink & Yellow Lines of THB 2.4bn YoY to THB 19.4bn
O&M revenue
Others
O&M revenue of THB 1.6mn YoY to THB 5.3bn, chiefly as a result of the full
operation of the Northern Green Line extension (Mochit station to Khu Khot
0.1
2.5
0.7 2% station) in Dec 2020, partly offset with
0.4
3.8 5.3 17%
Services revenue from provision of E&M works & train procurement for
36.8
25.1 25.3 81%
Northern Green Line ext. of THB 2.2bn YoY to THB 6.0bn
FY 18/19 FY 19/20 FY 20/21
*Comprise of (i) Services revenue from provision of E&M works and train procurement for Gold Line and (ii) Farebox revenue from BRT
FY 2020/21 EARNINGS PRESENTATION
7
.
MIX business
Operating Performance
(THB mn) FY 2020/21 FY 2019/201 %YoY
Operating Revenue 2,614 5,866 (55)%
Costs of revenue 1,509 2,756 (45)%
Gross profit 1,105 3,110 (65)%
Recurring EBITDA 707 2,359 (70)%
Gross operating profit margin (%) 42.3% 53.0%
Recurring EBITDA margin (%) 27.1% 40.2%
1 Note that FY 2019/20 operating performances from MIX business included contribution of MACO and its subsidiaries for the period from April 2019 to January 2020
Historical Operating Revenue (THB mn) FY 2020/21 MIX revenue of THB 2,614mn, decreasing by 55% YoY
mainly due to an impact from COVID-19 pandemic and the deconsolidation of MACO
OOH media
Digital services
OOH Media revenue declining 59% YoY to THB 1,535mn
Digital Services revenue dropped 50% YoY to THB 1,079mn
1,514 2,157
3,891 3,709
1,079 41%
1,535 59%
FY 18/19 FY 19/20 FY 20/21
FY 2020/21 EARNINGS PRESENTATION
8
.
MATCH business
 Operating Performance

 (THB mn)                                                                                        FY 2020/21                     FY 2019/20                    %YoY

 Operating Revenue                                                                                    923                          1,995                       (54)%

 Share of profit/ (loss) from investment in U city                                                  (2,098)                        1,152                       N.A.

 Net gain on sale of land                                                                             1,593                        2,985                       (47)%

 Historical net gain from land trading (THB mn)                                         FY 2020/21 MATCH revenue was THB923mn, declining by 54% YoY,
                                                                                        mainly from the weakened revenue in Property and Construction partnerships
Kamla Beach Resort and                             48-rai land sale
Hotel THB 1.6bn                                    (Bayswater JV)
(Net Gain THB 0.3bn)
Kampoo Property: THB 1.8bn
(Net Gain THB 0.7bn)              5-rai land at
                                                        2,985         3 land plots in   Share of loss from investment in U City, our associate, of THB 2,098mn (THB
                                                                       Thana City
                                  Mo Chit                                               1,152mn profit in FY 2019/20) primarily from the recognition of U City’s impairment of

                Bang Pakong and                                                         assets of THB 1,429mn and no repeat recognition of the gain of THB 1,118mn from sale of
                                                                          1,593
                Bangna km 18
                                                                                        Mo Chit Land in 3Q 2019/20
     1,000

                      379              368
                                                  //                                    Net gain from the sale of Thana City land of THB 1,593mn was recognised in
    FY 12/13        FY 13/14         FY 14/15          FY 19/20         FY 20/21
                                                                                        FY 2020/21.

  FY 2020/21 EARNINGS PRESENTATION
                                                                                                                                                                                 9
                                                                                                                                                                                 .
Financial Position as of 31 March 2021
Assets breakdown Liabilities and Equity breakdown
(THB mn) (THB mn)
Cash Gross Debt
212,062 31 Mar 20: THB 3.2bn 212,062 31 Mar 20: THB 88.6bn2
173,100 173,100
31 Mar 21: THB 3.8bn 31 Mar 21: THB 113.4bn2
14,157 7% 32,260 15%
19%
22,398 13%
Cash & liquid investment 32,915
THB 17.7bn Adjusted Net Debt2
31 Mar 20:
THB 16.3bn 31 Mar 20: THB 70.9bn
31 Mar 21:
72,940 42% 103,765 49%
31 Mar 21: THB 97.2bn
197,905 93% Current Financial Assets1
150,702 87%
1 Apr 20: THB 2.8bn ********
31 Mar 21: THB 2.9bn 39% Issued Ordinary Shares
67,245 36%
76,037 31 Mar 20: 13,154.3mn
Non-current Financial Assets1
31 Mar 21: 13,161.0mn
1 Apr 20: THB 18.0bn
31 Mar 20 30 Mar
31 Sep 20
21 31 Mar 20 31 Mar
Dec 21
20
31 Mar 21: THB 20.3bn 31
Total non-current assets Total current assets Total shareholders' equity
Total non-current liabilities
1 TheGroup adopted TFRS 9 which the cumulative effect is recognised as an adjustment to the retained earnings as at 1 April 2020 Total current liabilities
2 Comprised of 15% floating-rate debt and 85% fixed-rate debt
3Adjusted Net Debt = Interest Bearing Debt – Cash and Cash Equivalent and Liquid Investment
Key ratios
Gross Debt Adjusted Net Adjusted Net Debt3 to
to Equity Debt2 to Equity Interest Coverage Current Ratio
Recurring EBITDA
FY 2020/21: 1.49x FY 2020/21: 1.28x FY 2020/21: 11.04x FY 2020/21: 3.51x FY 2020/21: 0.44x
FY 2019/20: 1.32x FY 2019/20: 1.05x FY 2019/20: 7.35x FY 2019/20: 4.27x FY 2019/20: 0.68x
FY 2020/21 EARNINGS PRESENTATION
10
.MOVE update
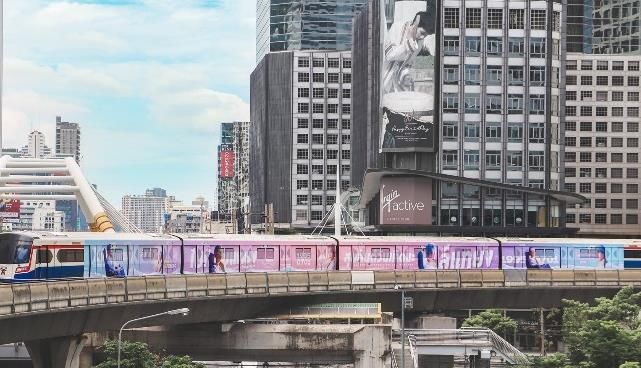
Rail business: Total Green Line network – 60 stations, 68km
Full operation of Extension Zone 2
(Southern in Dec 19 & Northern in Dec 20)
Feb 21, Saint Louis station, new station of the Core Network
began operation
O&M revenue in FY 2020/21 was THB 5,335mn, rose by 42% YoY
Total Green Line network
60 stations
68 kilometre
FY 2020/21 EARNINGS PRESENTATION
11 .MOVE update
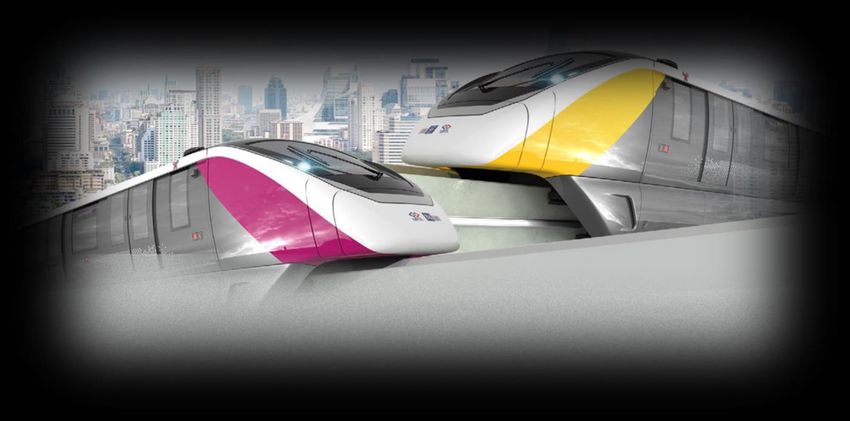
Rail business: Pink and Yellow Lines
Construction completion
75% 75%
Full operation Within 2022 Within 2022
Pink Line extension
Expected Expected
Cabinet Contract construction construction
approved signing kick off completion
✔ ✔
9 Feb 2021 23 Feb 2021 Mid 2021 within 2024
FY 2020/21 EARNINGS PRESENTATION
12
.MOVE update
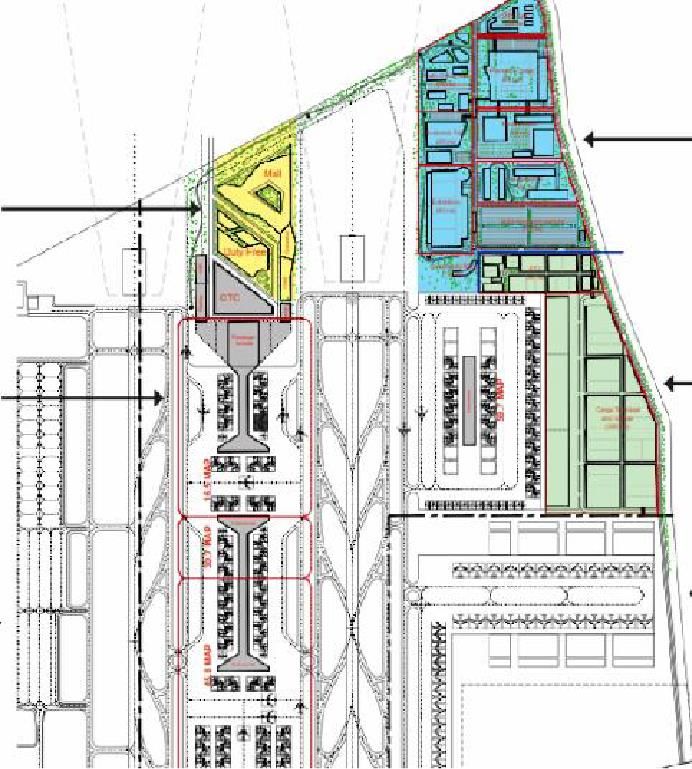
Non-rail business: U-Tapao international airport – at a glance
Roles & responsibilities
Plub Pla, Ban Chang District, Rayong Province
Approx. 6,500 Rai (10,400,000 sq.m.)
PPP Net Cost
50 Years
3 Years Design & Build Operation and Maintenance
Royal Thai Navy
THB 31bn (phase 1)
Paid-up capital of THB 9bn at COD
Debt 70 : Equity 30
Timeline Start construction
2 Jun 2020 Early 2022 Early 2072
Cabinet Approved Notice to proceed End of
35% PPP Contract (NTP) PPP contract
BBS JV
30 Jan 2020 19 Jun 2020 Early 2025
Announced Pricing PPP Contract O&M
Proposal Winner Signing Start Date
45%
20% 3 Years
FY 2020/21 EARNINGS PRESENTATION
13
.MIX update
Advertising
Continued to drive forward sustainable development of the
group’s marketing campaigns and media assets
Continued to promote marketing campaigns through OOH media across all of
its advertising networks
Recently, VGI and BTS, together with Shopee, the leading e-commerce
platform, launched a joint campaign to support the ‘new normal’ lifestyle and
celebrate ‘Shopee 4.4 Mega Shopping Day’ campaign.
Offering BTS passengers free single-journey tickets and extra discount on
Shopee
Moreover, VGI has continued to move forwards digitization by converting static
media to digital media such as Welcome Package and Street Media under BTS
columns.
FY 2020/21 EARNINGS PRESENTATION
14
.MIX update
Payment
Expanded to digital financing and insurance business
through strategic partnership
Rabbit Finance changed name to Rabbit Care and
acquired 100.0% in Asia Direct Insurance Broker
Total Investment : THB 36.9mn
Rationale : • To strengthen insurance brokerage
business
• To enhance VGI’s media
capabilities through O2O Solutions
FY 2020/21 EARNINGS PRESENTATION
15
.MIX update
Payment
Create the seamless online pament services for the better
consumers’ experience
App-to-app Top-up Service
Provided more convenient for RLP users by seamlessly connecting RLP e-wallet
with 3 Mobile Banking applications, including SCB EASY, K PLUS and KMA.
Partnered with the leading Chinese online travel booking platform
Provided an exclusive online transportation reservation services, which included
Flight and Bus function through RLP platform.
Continued to experience strong user growth
• 14.2mn Rabbit Cards, increased by 9.0% from 13.0mn cards, driven by the Rabbit Card RLP
expansion to all transportation modes, BTS new lines and collaboration with
leading companies to use Rabbit Card as staff ID card 14. 0
13.0
14.2 +9.0% 14. 0
• 8.2mn RLP users, increased by 11.8% from 7.3mn users, driven by the expansion +11.8%
12. 0 12. 0
10. 0 10. 0
8.2
7.3
of its services to cover several platform such as transportation, food and e-
8.0 8.0
6.0 6.0
Commerce 4.0
2.0
4.0
2.0
0.0 0.0
31-Mar-20 31-Mar-21 31-Mar-20 31-Mar-21
FY 2020/21 EARNINGS PRESENTATION
16
.MIX update
Logistics
Synergy showcase with our logistics partner
KEX – the IPO deal of the Year
• Kerry Express was successfully listed on SET under the trading ticker ‘KEX’. Its
share price surged 132% at the opening to THB 65.00 per share from the Initial
Public Offerings (IPO) price of THB 28.00 per share
• One of the major showcase of utilising on VGI’s all media assets to support
campaign for our business partner
Continued to deliver synergy product development
• > 1.6mn Smart Sampling and Parcel Sticker
• 700 KEX Truck Media
• 4 parcel shops on BTS station
• Introduced new product called ‘Driver Handover’
FY 2020/21 EARNINGS PRESENTATION
17
.MATCH update
Partnership
A successful showcase of partnership with BTS Group
Established a joint venture Rabbit Cash
JV Shareholder : 1. 77.0% by BSSH (held by VGI 90%)
2. 18.0% by AEONTS
3. 5.0% by Humanica
Business : Digital lending services
Registered Capital : THB 800mn
Future Investment : Not exceeding THB 800mn
Rationale : • Capturing the opportunity of THB 640bn
unregulated debt in Thailand
• Improve quality of life for people through finance,
data and technology
• Leveraging on the Groups’ assets and strategic partners:-
• Rabbit Group –data and technology
• AEONTS – financing/ lending services
• Humanica – HR solutions with over 3,000 companies and 700,000 employees
FY 2020/21 EARNINGS PRESENTATION
18
.MATCH update
Property – U City’s key developments in 4Q 2020/21
CAPITAL INCREASE ASSET SALES COVID REBOUND
Successfully increased capital Asset dispositioning ongoing Optimistic Outlook
of THB 15.7bn of THB 4.4bn
U City’s shares are trading
Issued 22.5bn new U-P shares Net IBD/E reduce from 1.04x to 0.12x at a deep discount (P/BV =0.40x)
(THB) (THB)
Travel rebound of the century
15.7bn 8.0bn 4.41bn 2.58bn with high pent-up demand
7.7bn
1.83bn Sold underperforming
operating lease hotels
Capital increase BTSG Others Sale approved Sale secured Sale on No future impairment loss at U City’s level
investment investment at AGM negotiation
*Noted:
1. BTSG is holding U city 45.7% (14.54bn shares)
2. U has 2 share classes; 1)U-P (26.2 bn shares or 85% of total) and 2) U (5.66 bn shares or 15% of total)
FY 2020/21 EARNINGS PRESENTATION
19
.FY 2021/22 Guidance
MOVE
THB 14bn THB 1bn THB 6.3bn THB 3.3bn THB 15bn
Construction revenue Revenue from E&M Train O&M Mass transit CAPEX
for Pink & Yellow Lines provision and train revenue related interest income
procurement for
Green Line extensions
MIX
THB
3.5-4.0bn 15-25% THB 450mn
VGI revenue VGI NPAT margin VGI CAPEX
FY 2020/21 EARNINGS PRESENTATION
20
.Appendices
BTS Group update
Business restructuring – key changes
                                           Previous structure

                                               Mass Transit                 Media             Property              Services

                                       •   BTSC                        •   VGI Group      •   U City          •   Rabbit rewards
                                       •   BTSGIF                                                             •   Bangkok Payment
                                       •   Northern Bangkok Monorail                                              Solutions
                                       •   Eastern Bangkok Monorail                                           •   Turtle 23
                                       •   U-Tapao International                                              •   Man Food Holdings
                                           Aviation                                                           •   HHT Construction
                                       •   Chao Phraya Express Boat
                                       •   BGSR 6
                                       •   BGSR 8

                                           New structure

                                                  MOVE                              MIX                           MATCH

                                       •   BTSC                        •   VGI Group                   •   U City
                                       •   BTSGIF                      •   Rabbit rewards              •   Turtle 23
                                       •   Northern Bangkok Monorail   •   Bangkok Payment Solutions   •   Man Food Holdings
                                       •   Eastern Bangkok Monorail                                    •   HHT Construction
                                       •   U-Tapao International
                                           Aviation
                                       •   Chao Phraya Express Boat
                                       •   BGSR 6
                                       •   BGSR 8

  FY 2020/21 EARNINGS PRESENTATION
                                                                                                                                      22
                                                                                                                                       .
BTS Group update
Issuance of warrants
Expected maximum proceeds*
(THB mn)
39,241.10
15,670.10
6,518.20
BTS-W6 BTS-W7 BTS-W8
Term 1-year 3-year 5-year
Offering Price -Nil-
Allocation Ratio 20 shares : 1 BTS-W6 10 shares : 1 BTS-W7 5 shares : 1 BTS-W8
No. of Warrants (units) Up to 658,407,985* Up to 1,316,815,970* Up to 2,633,631,940*
No. of Shares (shares) Up to 658,407,985* Up to 1,316,815,970* Up to 2,633,631,940*
Exercise Ratio 1 Warrant : 1 Share
Exercise Price (THB per share) 9.9 11.9 14.9
Exercise Period Quarterly
SET Listing Both to be listed
Average premium to share price 45%
*Assuming all BTS-WD are exercised
XW on 27 Jul 2021
FY 2020/21 EARNINGS PRESENTATION
23
.BTS Group update
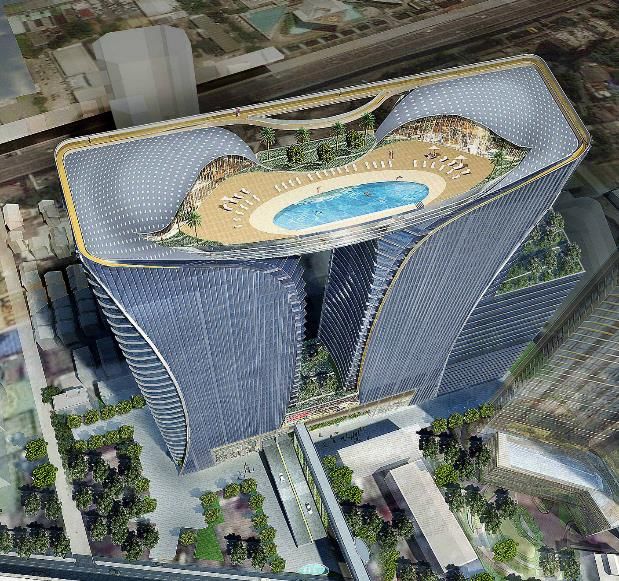
Acquisition of Mo Chit Land and development of Mo Chit Complex
Rationale & Background Mo Chit Complex specifications
STECON (the owner of the Land area 11-0-40.7 Rai
project), would like to divest this
Building type Mixed-Use Building
project for its internal working
(Office and Retail)
capital management purpose
amidst the COVID-19 crisis GFA 168,699 m2
NFA 82,193 m2
- Office 75,994 m2
BTSG is also seeking for the new - Retail/ Facility 4,784 m2
head office building to support - Rooftop 1,415 m2
the ongoing expansion of the
Group No. of floor 36
No. of basement 3
Investment Details Carpark 1,530 lots
Building height +150m
Acquisition of Mo Chit
THB 4.45bn Targeted opening April 2024
Land shares
Green design
Development cost of THB 9.94bn Leadership in Energy
Mo Chit Complex Over 4 years and Environmental Design
(FY 20/21 – FY or LEED : Gold Level
23/24)
FY 2020/21 EARNINGS PRESENTATION
24
.BTS Group update
The 2nd Green Bond issuance of THB 8,600mn with average coupon of 2.72%
Objective
The proceeds will be used for investment and debt repayment of the Eligible
Green Projects which are
• Pink line
• Yellow line
Maturity Date
Original Principal Size Interest Rate
Green Bond (Issue Rating by
(THB mn) (Issue Date: 6 Nov 20)
TRIS: A)
Debenture 2 Yrs 2.10% 06 Nov 22
500.00
Debenture 3 Yrs 2.44% 06 Nov 23
4,000.00
Debenture 5 Yrs 2.86% 06 Nov 25
1,500.00
Debenture 7 Yrs 3.11% 06 Nov 27
2,000.00
Debenture 10 Yrs 3.41% 06 Nov 30
600.00
Total 8,600.00
By ICMA
FY 2020/21 EARNINGS PRESENTATION
25
.MOVE update
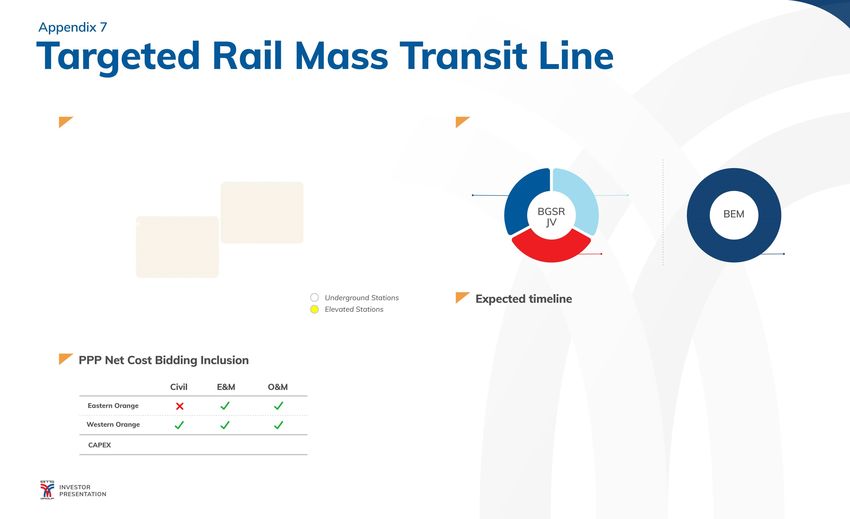
Orange Line
Orange Line (35.9km, 28 Stations) 2 Consortiums submitted the Bid
Eastern Orange
BGSR
Western Orange
JV
Route Thailand Cultural
Center - Min Buri
Length 22.5km
No. of 17
Route Taling Chan – Stations (10 underground and
Thailand Cultural 7 aboveground)
Center
Length 13.4km
No. of 11 (underground)
stations
9 Nov 2020 2023
Bid submission Targeted COD
of Eastern Orange
10-24 Jul 2020 2026
Request for proposal Targeted COD
(RFP) selling period of Western Orange
THB 111bn* THB 32bn
FY 2020/21 EARNINGS PRESENTATION
26
.MOVE update
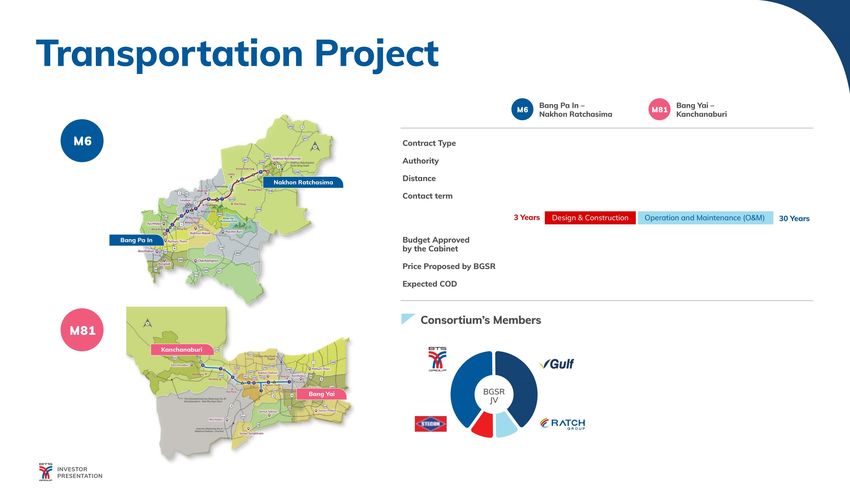
Non-rail business: Intercity Motorway – at a glance
PPP Gross Cost PPP Gross Cost
Department of Highways Department of Highways
196 km. 196km 96km
2 phases
3 Years Design & Construction Operation and Maintenance (O&M)
THB 33.2bn THB 27.8bn
THB 21.3bn THB 17.8bn
2023 2026
Scope of Works
Phase I: Design and Construction (3 years)
• Toll Collection System
96 km. • Traffic Management and Control System
• Other infrastructure
40% 40%
BGSR Phase 2: Operation and Maintenance (30 years)
JV
Status
10% 10% PPP Contract signing expected by 2021
FY 2020/21 EARNINGS PRESENTATION
27
.MATCH update
Property - U City’s key developments in 4Q 2020/21
THE CUSTOMS HOUSE (ROI CHAK SAM) THE UNICORN PHAYATHAI
Concept A luxurious 5-star hotel project in a rare, historic, colonial-era 51 levels of mixed-use building comprising of retail, office, hotel and residence
heritage building located along magnificent Chao Praya Riverside
Project Value Approximately THB 4.6bn Approximately THB 9.3bn
Location On the Chao Praya Riverside, Soi Charoenkrung 36, Bangrak, Adjacent to 2 mass transit stations: BTS Phayathai Station and Airport Rail Link
Bangkok
Land Area 5.15 Rai or 0.82 Ha (8,240 sqm) 7.3 Rai or 1.2 Ha (11,749.6 sqm)
Construction 4Q 2019 3Q 2017
2025 2Q 2022
Timeline
Start Completion Start Completion
Project Period 6 years Approximately 60 months
Status 3.5% Progress 39.0% Progress
(as of 31 Apr 21)
FY 2020/21 EARNINGS PRESENTATION
28
.Line Official Account
@btsgroup_ir
Get
the latest news
on LINE!
FY 2020/21 EARNINGS PRESENTATION
29
.You can also read