Investor Presentation - March 2022 - Energy Transfer
←
→
Page content transcription
If your browser does not render page correctly, please read the page content below

Investor Presentation
March 2022
Forward-looking Statements / Legal Disclaimer

Management of Energy Transfer LP (ET) will provide this presentation to analysts and/or investors at meetings to be held throughout February and March 2022. At the meetings, members of management may make statements
about future events, outlook and expectations related to Panhandle Eastern Pipe Line Company, LP (PEPL), Sunoco LP (SUN), USA Compression Partners, LP (USAC), and ET (collectively, the Partnerships), and their
subsidiaries and this presentation may contain statements about future events, outlook and expectations related to the Partnerships and their subsidiaries all of which statements are forward-looking statements. Any statement
made by a member of management of the Partnerships at these meetings and any statement in this presentation that is not a historical fact will be deemed to be a forward-looking statement. These forward-looking statements rely
on a number of assumptions concerning future events that members of management of the Partnerships believe to be reasonable, but these statements are subject to a number of risks, uncertainties and other factors, many of
which are outside the control of the Partnerships. While the Partnerships believe that the assumptions concerning these future events are reasonable, we caution that there are inherent risks and uncertainties in predicting these
future events that could cause the actual results, performance or achievements of the Partnerships and their subsidiaries to be materially different. These risks and uncertainties are discussed in more detail in the filings made by
the Partnerships with the Securities and Exchange Commission, copies of which are available to the public. In addition to the risks and uncertainties disclosed in our SEC filings, the Partnership may have also been, or may in the
future be, impacted by new or heightened risks related to the COVID-19 pandemic, and we cannot predict the length and ultimate impact of those risks. The Partnership has also been, and may in the future be, impacted by the
winter storm in February 2021 and the resolution of related contingencies, including credit losses, disputed purchases and sales, litigation and/or potential legislative action. The Partnerships expressly disclaim any intention or
obligation to revise or publicly update any forward-looking statements, whether as a result of new information, future events, or otherwise.
This presentation includes certain forward looking non-GAAP financial measures as defined under SEC Regulation G, including estimated adjusted EBITDA. Due to the forward-looking nature of the aforementioned non-GAAP
financial measures, management cannot reliably or reasonably predict certain of the necessary components of the most directly comparable forward-looking GAAP measures without unreasonable effort. Accordingly, we are
unable to present a quantitative reconciliation of such forward-looking non-GAAP financial measures to their most directly comparable forward-looking GAAP financial measures.
All references in this presentation to capacity of a pipeline, processing plant or storage facility relate to maximum capacity under normal operating conditions and with respect to pipeline transportation capacity, is subject to multiple
factors (including natural gas injections and withdrawals at various delivery points along the pipeline and the utilization of compression) which may reduce the throughput capacity from specified capacity levels.

                                                                                                                                                                                                                                                2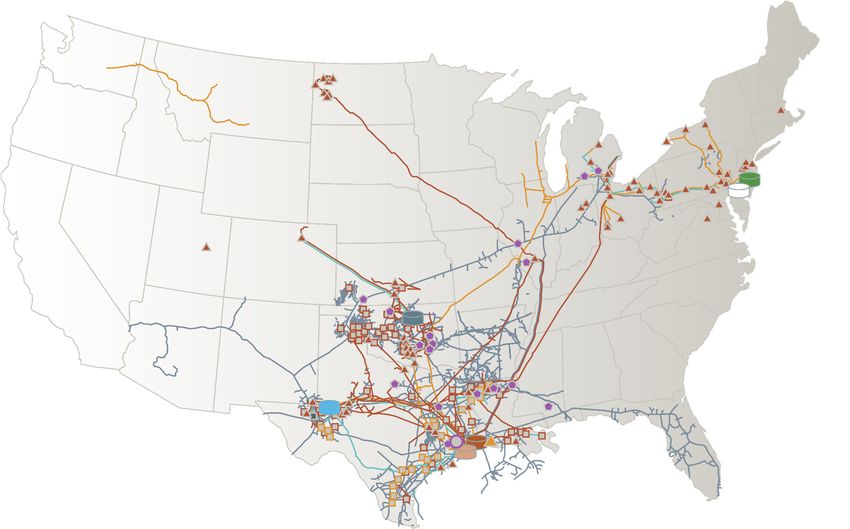
What’s New
Operational Financials Strategic
Construction of the final phase of the Mariner Adjusted EBITDA Closed Enable Midstream acquisition on
East Pipeline is complete, and commissioning is December 2, 2021
FY’21: $13.0B – up 24% from FY’20
in progress
Distributable Cash Flow (DCF) $100mm+ operational/cost synergies expected
During Q1’22, construction began on the Gulf
Run Pipeline project and the project is expected FY’21: $8.2B – up 43% from FY’20 Announced a potential new Permian Basin
to be complete by year-end Excess cash flow after distributions takeaway pipeline utilizing existing Energy
Transfer assets along with a new build pipeline to
NGL transportation and fractionation volumes FY’21: ~$6.4B connect Permian supply to markets along the gulf
reached new records during Q4’21
FY’21 Capital Expenditures coast including Houston Ship Channel, Katy,
In Q4’21, Cushing South Pipeline launched Carthage and Henry Hub
Growth: $1.4B
Phase II which would expand crude capacity to
120,000 Bbls/d Maintenance: $522mm Ongoing discussions with Panama to study the
feasibility of jointly developing NGL assets
In Oct’21 a new 3mm barrel high-rate storage $6.3B reduction in existing long-term debt in FY‘21¹
well was added to Monte Belvieu storage facility In Q4’21, released Corporate Responsibility
increasing NGL storage to 53mm barrels Report highlighting achievements in safety, risk
management and emissions reduction programs
Placed Permian Bridge project into service in
Oct’21
Exported ~26mm barrels of ethane from
Nederland terminal for FY’21
Strategic asset base well positioned for long-term success
3
1. Excludes debt assumed in Enable acquisition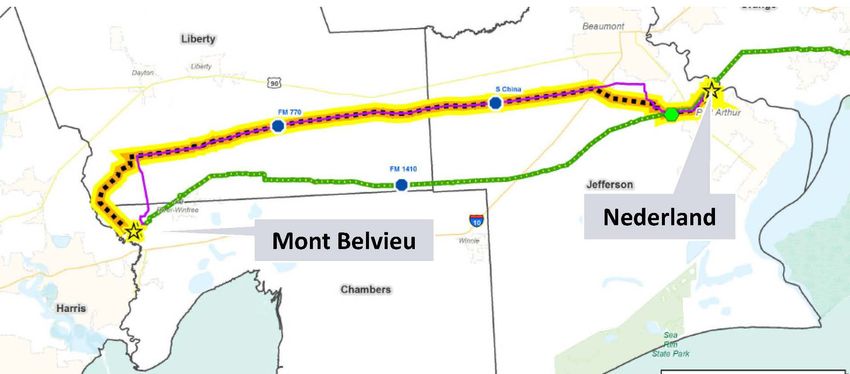
Energy Transfer – A Truly Unique Franchise

                                                                                                Marcus Hook Terminal

                                                                                               Nederland Terminal

Asset Overview
     Natural Gas                     Storage
     Natural Gas Liquids (NGLs)      Fractionator
     Crude                           Terminals
     Refined Products                Processing                             Houston Terminal

                                     Treating

Major Terminals
     Marcus Hook Terminal         Nederland Terminal   Houston Terminal

     Eagle Point Terminal         Midland Terminal     Cushing Terminal
                                                       Lake Charles Regas
                                                                                                                       4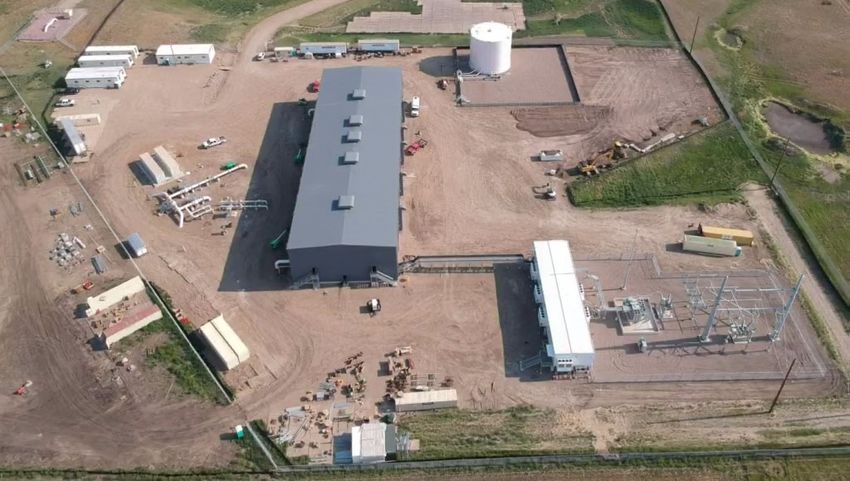
De-Risking ET
Levered Balance Significant debt reduction
Sheet Reduced long-term debt by $6.3B in 2021
Delivering growth projects
Project Execution Construction of final phase of Mariner East pipeline complete,
Risk commissioning in progress
Bakken optimization now in-service
Complex Company More simplified organization
Structure ETO roll-up and reduced overhead costs
Economic Uniquely positioned for improving macros
Slowdown Impacts Assets in all major producing basins and connected to major
markets, including export ports on gulf and east coasts
M&A Financially disciplined in M&A markets
Uncertainty Recently closed accretive and complementary ENBL acquisition
Strong outlook with significant cash available for allocation 5
2022 Outlook Supported by Strong Core Business

                                                                                               ET 2022E Adjusted EBITDA $11.8 - $12.2 billion

                                                  2021 to 2022 Adjusted EBITDA Drivers                                            2022E Adjusted EBITDA Breakout

                                              + Enable Acquisition
                                                                                                                                              Commodity
                                              + NGL pipeline and export activities                                                     Spread¹ 7.5-10%
                                                                                                                                       0-2.5%
                                              + NGL / gas prices

                                              - Lower asset optimization

                                              - Rising costs

                                              + Organic Projects
                                                    + Orbit Ethane Export Terminal
                                                                                                                                                          Fee²
                                                    + Nederland LPG Expansions                                                                            ~90%
                                                    + Mariner East Pipeline System/PA Access
                                                    + Permian Bridge
                                                    + Bakken optimization project
                                                                                                                            Pricing/spread assumptions based on current futures markets

                                                                                                                                                                                          6
1.   Spread margin is pipeline basis, cross commodity and time spreads
2.   Fee margins include transport and storage fees from affiliate customers at market rates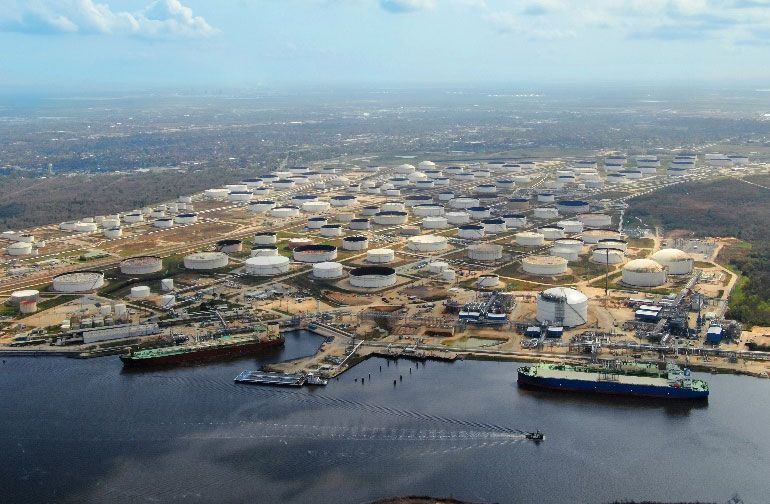
Earnings Supported by Predominantly Fee-Based Contracts
2021 Full-Year Adjusted EBITDA by Segment¹ Segment Contract Structure Strength
Fees from dedicated
Significant connectivity to
acreage, take-or-pay and
Permian, Bakken and Midcon
Crude Oil throughput-based
Basins to U.S. markets,
SUN, USAC & transportation, terminalling
including Nederland terminal
and storage
Other
10% Crude Oil Fees from plant
16% dedications and take-or-
~60 facilities connected to ET’s
pay transportation
NGL & Refined NGL pipelines, and benefit from
Interstate & contracts, storage fees and
Products recent frac expansions at the
fractionation fees, which
Intrastate Mont Belvieu complex
are primarily frac-or-pay
Transportation structures
& Storage
NGL & Refined
38% Interstate Fees based on reserved Connected to all major U.S.
Products
Transport & capacity, take-or-pay supply basins and demand
22% Storage contacts markets, including exports
Midstream
(Natural Gas) Minimum volume
Significant acreage dedications,
14% commitment (MVC),
including assets in Permian,
Midstream acreage dedication,
Eagle Ford, Anadarko and
utilization-based fees and
Marcellus/Utica Basins
percent of proceeds (POP)
Largest intrastate pipeline
Intrastate Reservation charges and system in the U.S. with
Transport & transport fees based on interconnects to TX markets, as
Storage utilization well as major consumption
areas throughout the US
7
1. Includes one month contribution from Enable Midstream Partners assets, which were acquired in December 2021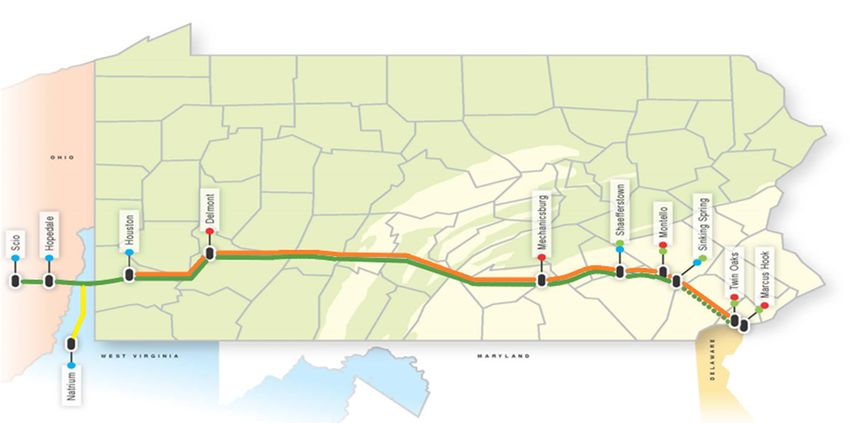
Focused on Increased Returns and Shorter Cash Cycle

                                                                  2022E Growth Capital: $1.6 billion to $1.9 billion1

                                                                                                                                                             % of 2022E1
                                                              •   Grey Wolf high-recovery cryogenic processing plant
                                                              •   Efficiency improvements and modernization/emissions reductions projects
                                            Midstream         •   Permian Bridge Pipeline project                                                                ~35%
                                                              •   Growth related to newly acquired ENBL assets
                                                              •   Multiple gathering & processing and compression projects (primarily W. Texas, Northeast)

                                                              • Gulf Run Pipeline project
                                             Interstate
                                                              • Multiple smaller projects
                                                                                                                                                                 ~30%

                                                              •   Mariner East Pipeline System
                                                              •   Nederland LPG facilities
                                 NGL & Refined Products
                                                              •   Mont Belvieu frac and storage facilities
                                                                                                                                                                 ~25%
                                                              •   Multiple smaller projects

                                                              • Ted Collins Link
                                             Crude Oil        • Cushing South Pipeline                                                                           ~5%
                                                              • Multiple smaller projects

                                                              • Oasis pipeline optimization
                                      Intrastate & Other
                                                              • Multiple smaller projects
                                                                                                                                                                 ~5%

                                             Balanced investing across ET’s growing asset base with majority completed at ~6x EBITDA

                                                                                                                                                                           8
1.   Includes ET legacy and recently acquired ENBL projects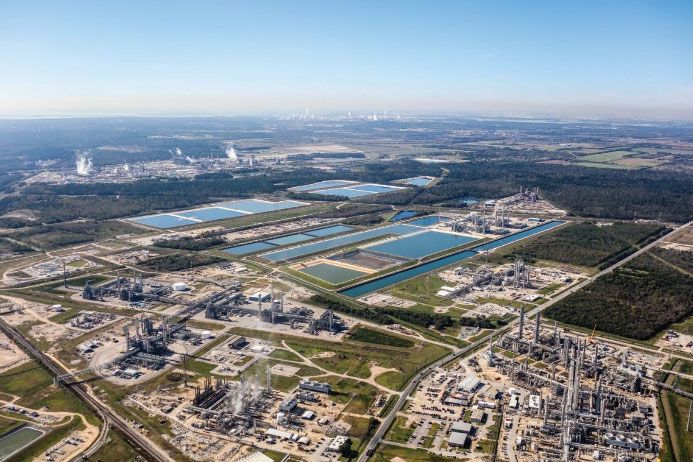
Results Benefitting from Investments in High-Quality
              Growth Projects

                                    Major growth projects added since 2017
                                                                                                   Legacy ET Organic Growth                                                                 ET Adjusted EBITDA4
                                        • Bakken Pipeline System*    • Permian Express 3*                  Capital3
                          2017          • Trans Pecos/Comanche       • Panther Plant
                                          Trail Pipelines*           • Arrowhead Plant                                   2017                                                                      2022E
                                                                                                                         $5.5B                                                                  $11.8-$12.2B
                                        • Rover Pipeline*            • Arrowhead II Plant
                          2018          • Frac V                     • Mariner East 21
                                        • Rebel II Plant

                                        •   Bayou Bridge Phase II*
                                                                     • JC Nolan Diesel Pipeline*
                                        •   Permian Express 4*
                                                                     • Arrowhead III Plant
                          2019          •   Frac VI
                                                                     • Panther II Plant
                                        •   Red Bluff Express
                                            Pipeline*
                                        •   Frac VII
                                        •   Mariner East 2X          • Orbit Ethane Export
                          2020          •   PA Access                  Terminal*
                                        •   Lone Star Express        • LPG Expansions
                                            Expansion

                                        • Mariner East 2X            • Bakken Optimization*
                          2021          • PA Access                  • Permian Bridge¹
                                        • Cushing South Phase I*

                                        • Mariner East 21            • Permian Bridge Phase II²
                          2022          • Ted Collins Link2          • Grey Wolf Plant²
                                        • Cushing South Phase II²*   • Gulf Run Pipeline²
                                                                                                                     2022E                                                                         2017
                                                                                                                   $1.6-$1.9B                                                                      $7.3B

*Joint Ventures                                                                                                                                                                                                   9
1Additional                                                                                        3IncludesET’s proportionate share of JV spend
            phases under construction
2Currently under construction                                                                      4Adjusted EBITDA includes 100% of ET’s EBITDA related to non-wholly-owned subsidiaries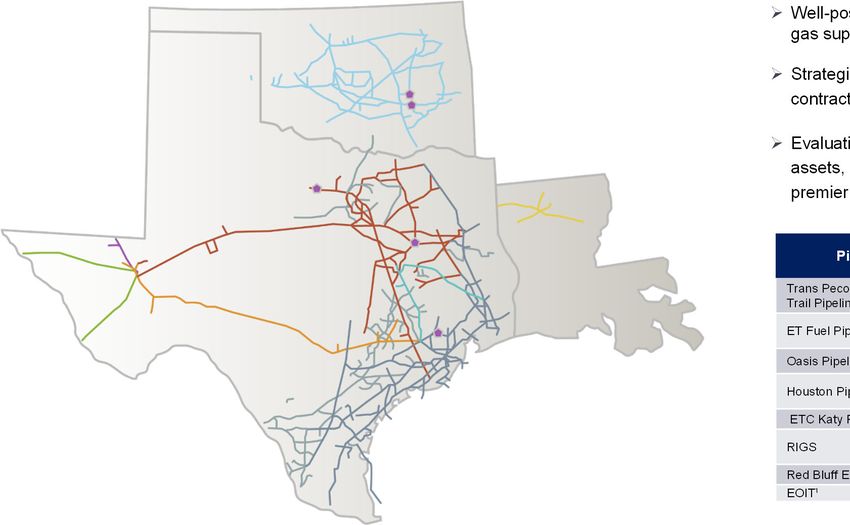
Alternative Energy Group – Leveraging asset base and
expertise to develop projects to reduce environmental footprint
Dual Drive Compressors - Established in 2012
Patented technology that allows for switching between electric motors and natural gas engines to drive compressors, and
offers the industry a more efficient compression system, helping reduce greenhouse gas emissions
In 2021, this technology allowed ET to reduce Scope 1 CO2 emissions by more than 765,000 tons, a 53% improvement
over 2019
In June 2021, our patented Dual Drive Technologies natural gas compression system was awarded a GPA Midstream
Environmental Excellence award for its impact on reducing CO2 emissions
Carbon Capture Utilization and Sequestration
Currently pursuing projects related to G&P facilities, and evaluating opportunities to capture carbon from ET and third-party
facilities in the Northeast and transport CO2 through existing underutilized ET pipelines near CO2 sources
Provide cash flows to Energy Transfer with minimal capital requirements due to structures that allow monetization of
federal tax credits
Renewable Energy Use
Approximately 20% of the electrical energy ET purchases originates from a renewable energy source
Renewable Fuels
Evaluating opportunities to transport renewable diesel and renewable natural gas
Benefit from significant current asset footprint
ET’s 2020 Corporate Responsibility
Solar Report is now available at
Entered into first-ever dedicated solar contract, which anchors a 28 megawatt solar facility (Maplewood 2) in West Texas www.energytransfer.com
Operate approximately 18,000 solar panel-powered metering stations across the country
Entered into second renewable energy power purchase agreement for 120 megawatts of electricity from facility in NE Texas
Repurpose Existing Assets
Evaluating repurposing extensive acreage in WV, VA, KY and ND to develop solar and wind projects
Pursuing opportunities to utilize ET’s significant asset footprint for the transportation of renewable fuels, CO2 and other products
In 2021, Energy Transfer’s Dual Drive technology allowed ET to reduce direct CO2 emissions by more than 765,000 tons,
10
which is an improvement of ~20% compared to 2020Corporate Responsibility
Program Highlights Program Accomplishments
• Committed to pursuing a zero-incident culture • Safety Incident Rate (TRIR) improved 34% from 2018 to 2020 – below industry average
• Real-time tracking of EHS incidents focused on leading indicators • Established an Alternative Energy Group to explore renewable energy projects
Environmental, • Significant use of renewable energy in operations • Approximately 20% of electrical energy purchased by ET on any given day originates from
renewable energy sources – enough to power ~40,000 homes
• Five step risk reduction process for every EHS incident
Health, and • Compliance tracking and trending through a comprehensive Environmental Management • ESG Metrics reported through EIC/GPA ESG Reporting Template
Safety System
• Support pipeline safety and environmental research through membership in the Pipeline
• 765,000 ton reduction of Scope 1 CO2 emissions with ET patented Dual-drive compressors, a
53% improvement over 2019
Research Council International (PRCI) and the Intelligent Pipeline Integrity Program (iPIPE) • Ducks Unlimited partnership that provided $5MM for 1,300 acres of wetlands restoration
• Member API Environmental Partnership – Voluntary Methane Reduction Program • Energy Transfer’s 4000+ operations personnel are trained and qualified in accordance with
pipeline safety regulations and sustain over 52,000 individual qualifications
• ~$53.7 MM donated to charitable organizations between 2017 and 2020 • 2021 Forbes America’s Best Large Employers
• In 2020, 1000+ employees participated in socially distanced and virtual volunteer • 175 nonprofit organizations served in 2020 – local to our assets
activities • 536 Liaison Meetings in 2020 – engaged 19,155 stakeholders
Social • Comprehensive Stakeholder Engagement Program that promotes proactive outreach and • Ongoing Native American power agreements, easements, and scholarships
respect for all people
Responsibility • Mailed more than 2 million brochures to stakeholders along Energy Transfer pipelines in 2020
• Group SVP of Operations Services named one of 50 Most Powerful Women in Oil & Gas in
2020 by the National Diversity Council
• Ongoing support and cooperation with Native American tribes • ~7,300 emergency responders trained through Energy Transfer Outreach Programs
• Adopted America’s Natural Gas Transporters’ Commitment to Landowners • Received Texas Gas Association’s Transmission Workplace Safety Award in 2020
• On-going emergency response and public awareness outreach programs • In 2022, partnering with the Arbor Day Foundation to plant 25,000 trees
• Oversight of EHS compliance and ESG initiatives by Independent BOD Audit Committee • Co-CEO Leadership and Management
• Compensation aligned with business strategies – performance based with retention focus • Increased transparency with redesigned and updated website
Corporate • Strong enforcement of integrity and compliance standards
• ET Deputy General Counsel serves as Chief Compliance Officer
• Annual Senior Management compliance review
• Added resources to oversee and manage compliance
Governance • Quarterly compliance certifications from senior management • Significant management ownership > 13% of units
• Alignment of management/unitholders • Website publication of GRI/SASB Index and EIC/GPA Midstream ESG Reporting Template
Annual Engagement Report and ESG Reporting Template 11
available on website at energytransfer.comSignificant Management Ownership – Continued Buying in 2021
In 2021, Energy Transfer insiders and independent board members purchased
~19.8 million units, totaling ~$154 million
2021 Insider Purchases Insider Ownership vs Peers Ownership Breakout
14%
Executive Chairman: ~19.1mm units; ~$148mm
12% Insiders
~13%
Board of Directors: ~503K units; ~$4.4mm
10%
Insider Ownership %
Retail
CFO: ~83k units; ~$649k 8%
~45%
6%
CEO: ~81k units; ~$600k
Institutions
4% ~42%
COO: ~34k units; ~$250k
2%
0%
ET Peers S&P 500 S&P 500 Energy
Management and Insiders significantly aligned with unitholders
12
Source: Bloomberg/Company Filings; as of 1/6/2022
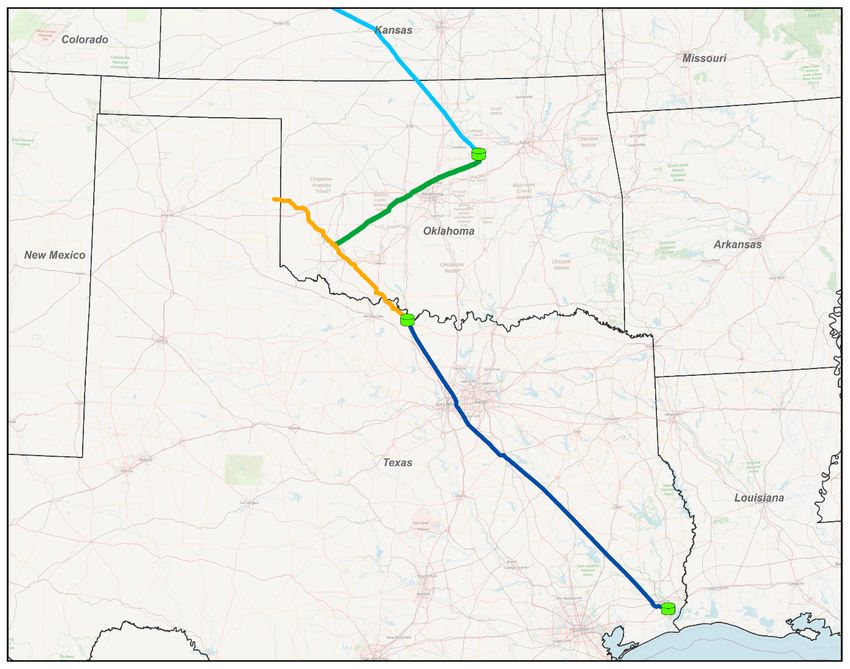
Peer Group: DCP, ENB, EPD, KMI, OKE, TRGP, PAA, WMB, MMPInterstate Segment – Gulf Run Pipeline Project
Provides An Efficient Gulf Coast Connection
Gulf Run Pipeline Project Overview
135-mile, 42” interstate pipeline with an expected capacity of
1.65 Bcf/d
Backed by a 20-year commitment for 1.1 Bcf/d with cornerstone
shipper Golden Pass LNG (Qatar Petroleum & Exxon Mobil)
Unparalleled access to prolific natural gas producing regions in
the U.S. with ability to deliver Haynesville-area gas to Gulf Coast
Region
Strategic fit with other ET natural gas pipelines to provide access
to markets across the Texas and Louisiana Gulf Coast
Currently under construction and expected to be complete by year-end 2022 13Crude Oil Segment – Bakken Pipeline System
DAPLpipelinefacts.com
Bakken Pipeline System1
• 1,915-mile system connecting Bakken production to ET’s Nederland terminal on the
Gulf Coast
• Expect additional capacity to service commitments received through open seasons to
be in-service late in the third quarter of 2021
Delivery Points
• The Bakken Pipeline delivers U.S. oil that is critical to support American jobs, tax
Origin Sites revenue, energy security and independence
Bakken Pipeline • Recently placed the next phase of incremental capacity into service, which is supported
ET Nederland Terminal by minimum volume commitments from long-term customers
• The Bakken Pipeline now has the ability to flow ~750,000 barrels per day
14
1. Ownership is ET: 36.37%, MarEn: 36.75%, PSXP: 25%, XOM: ~2%Crude Oil Segment – Cushing South Pipeline
From DJ Basin Cushing South Pipeline
ET Cushing Terminal
ET and Centurion Pipeline L.P. offers joint tariff crude oil
service from ET’s terminal in Cushing, OK to ET’s Nederland
Cushing terminal
Provides ability to move Powder River and DJ Basin barrels
through Cushing to ET’s Nederland Terminal
Primarily utilizes existing assets, including ET’s White Cliffs and
Permian Express 1 pipeline
Assets linked together via new connections in Oklahoma
Ringgold ~65,000 bpd of crude oil capacity
Phase II expansion will nearly double capacity to 120,000 bpd
ET Nederland Terminal
Commenced service in June 2021
– expansion expected to be in service
ET White Cliffs by end of Q1’22
Centurion Pipeline
ET Granite Wash Nederland
ET Permian Express 1
15NGL & Refined Products Segment - A World Leader in NGL
Exports
In total, ET’s market share of worldwide NGL exports has doubled
over the last 24 months to nearly 20%
ET NGL Exports Nederland Terminal
800
700
600
Thousand barrels per day
500
400
300
200
100
0
Q1 2014
Q2 2014
Q3 2014
Q4 2014
Q1 2015
Q2 2015
Q3 2015
Q4 2015
Q1 2016
Q2 2016
Q3 2016
Q4 2016
Q1 2017
Q2 2017
Q3 2017
Q4 2017
Q1 2018
Q2 2018
Q3 2018
Q4 2018
Q1 2019
Q2 2019
Q3 2019
Q4 2019
Q1 2020
Q2 2020
Q3 2020
Q4 2020
Q1 2021
Q2 2021
Q3 2021
Q4 2021
Expanding industry leading business while capturing future growth opportunities in new markets 16
Source: Internal and KplerNGL & Refined Products Segment – Leading Northeast NGL
Franchise
Comprehensive Marcellus/Utica Shale solution reaching local, regional and international markets
Marcus Hook Terminal Mariner East Pipeline System
• ~800 acre site: inbound and outbound pipeline, along with truck, rail and marine capabilities • Provides transportation, storage, and terminaling services from OH / Western PA to the
• ~400,000 bbls/d of combined NGL and ethane export capacity at Marcus Hook Terminal Marcus Hook Terminal on the East Coast
• ~2 million bbls underground NGL storage; ~3.8 million bbls (standard) above-ground NGL • Products include ethane, propane, butane, C3+, and natural gasoline; developing
storage; ~1 million bbls refined products storage capacity; ~1 million bbls crude storage capabilities for refined products
capacity1 • Supported by long-term, fee-based contracts with diversified customer base that includes
• 4 export docks accommodate VLGC & VLEC sized vessels producers, midstream providers and major integrated energy companies
• Began transporting natural gasoline on the Mariner system to Marcus Hook Terminal for • In addition, PA Access began flowing refined products in January 2022
gasoline blending and local consumption on April 1, 2021
• Positioned for further expansion and development of exports, processing, storage and
manufacturing
Construction of the final phase of the Mariner East pipeline is
complete and commissioning is in progress, which will bring its
total NGL capacity to 350,000 to 375,000 bbls/d, including ethane
ET Terminal Facilities
8” ME1 Pipeline² Third Party Facility
20” ME2 Pipeline PA Propane Delivery
16” ME2X Pipeline Marcus Hook Terminal
1. Note: crude storage reported in Crude Oil Transportation & Services segments 8” RP Pipeline Third Party Pipeline
17
2. A portion of ME1 has been converted to refined products service as part of the PA Access project
12” ME2/GRE Pipeline Marcellus Shale
3. This is a concept drawing. Actual pipe sizes and connection locations within each line segments varyNGL & Refined Products Segment – Pennsylvania Access
As Mariner East adds refined products to its slate of liquids transportation services, tremendous synergies can be
realized with ET’s existing refined products pipelines and terminals
PA Access Overview
Converted a portion of 8-inch ME1 NGL pipeline to refined
products service
Facilitates refined products movements from Midwest supply
regions through Allegheny Access Pipeline System into PA and
markets in the Northeast
Reconnected and modified existing assets
Connect 8” ME1 line to ~20-25,000 barrels per day of refined products capacity; easily
Refined Products System
At Delmont and Montello
expandable to ~50,000+ barrels per day
Allows for efficient, inexpensive way to move refined products
to meet demand
Incremental revenue and synergies with existing ET refined
products pipelines and terminal assets
Provides flow from Ohio to Pennsylvania, and to upstate New
York markets
PA Access began flowing refined products in January 2022
18NGL & Refined Products Segment – Ethane Export Project
Ethane Export Pipeline and Terminal Facilities Orbit Pipeline JV
Orbit Joint Venture with Satellite Petrochemical USA Corp includes a new
ethane export terminal on the U.S. Gulf Coast to provide ethane to Satellite’s
newly-constructed ethane crackers
At ET’s Nederland Terminal, Orbit constructed:
• 1.2 million barrel (standard) ethane storage tank
• ~180,000 barrel per day ethane refrigeration facility
• 20-inch ethane pipeline originating at ET’s Mont Belvieu facilities that will
make deliveries to its Nederland export terminal, as well as domestic
markets in the region
ET is the operator of the Orbit assets, and provides storage and marketing
services for Satellite
ET will ultimately provide Satellite with approximately 150,000 barrels per
day of ethane under a long-term, demand-based agreement, which will ramp
up as new Satellite facilities come online
The Seri Everest, The World’s Largest VLEC In addition, ET constructed and wholly-owns the infrastructure required to
supply ethane to the pipeline and to load ethane onto carriers destined for
international markets
Loaded nearly 26 million barrels of ethane out of this facility through in 2021
For 2022, expect to load a minimum of 40 million barrels of ethane out of this
facility, and project this to increase to up to 60 million barrels for 2023
19NGL & Refined Products Segment –
Nederland LPG/Natural Gasoline Expansions
Legacy Mariner South System Nederland Natural Gasoline Expansions
Completed in 2015, the legacy Mariner South system integrated ET’s Mont Loaded first barge with natural gasoline in July 2019
Belvieu assets with its Nederland Terminal
Repurposed existing pipeline to export 30,000 BPD of natural gasoline
Included batched butane and propane pipeline and chiller with a LPG export
Completed construction of new 600,000 Bbl natural gasoline storage tank in
capacity of 180,000 BPD
December 2020
Completed de-bottlenecking in early 2020 which added ~55,000 BPD of additional
export capacity
Nederland LPG Export Expansions
Constructed new 20” pipeline from Mont Belvieu to Nederland to segregate
system into separate dedicated product pipelines
New butane chiller provided an additional 180 MBPD of LPG export capacity
Existing chiller now dedicated to propane use
Completed dock expansion/conversions to go from one dock to three docks
capable of exporting ethane, propane, butane and natural gasoline
New export train and dock conversion at Nederland allowed additional product
loading to service international markets
New pipeline and chiller went into service in December 2020 and will
accommodate increased demand for propane and butane volumes
Now capable of exporting ~700,000 BPD of NGLs from the Nederland Terminal
Further established ET’s Nederland terminal as a world class export operation on the U.S. Gulf Coast 20NGL & Refined Products Segment –
Pipeline & Fractionation Expansion
Lone Star Express Expansion Mont Belvieu Fractionation Expansions
• 24-inch, 352-mile expansion • Total of 7 fractionators at Mont Belvieu
• Added 400,000 bbls/d of NGL pipeline capacity from Lone Star’s • 150,000 bbls/d Frac VI went into service in February 2019
pipeline system near Wink, Texas to the Lone Star Express 30- • 150,000 bbls/d Frac VII went into service in Q1 2020
inch pipeline south of Fort Worth, Texas in 2020
Frac VI
Fracs
Frac VII IV & V
Ft. Worth, TX
Godley Frac I
Baden
Hattiesburg
Frac II
Export De-C2
Geismar
Sea Robin
Sorrento
LaGrange/Chisholm
Chalmette Frac III
Plant Complex
Asset Overview Jackson
Existing ET NGL Nederland Terminal
ET Justice Mt. Belvieu Fractionation Kenedy Current frac capacity over 900,000 bbls/d
& Storage
ET Liberty
Plant
ET Gulf Coast NGL Express¹
Fractionator
ET Gulf Coast NGL Expansion
Processing Plant
ET Gulf Coast NGL WTX Gateway
Storage
ET Spirit
Mariner South
ET Freedom 21Growing Unique Export Capabilities
Houston Terminal
• 330 acres on Houston Ship Channel Total NGL export capacity is now over
• 18.2 million barrels of crude and heated product 1.1 million barrels per day
storage
• ~500 thousand bbls/d of crude export capacity
• 5 ship docks, 7 barge docks
• Rail and truck loading and unloading Marcus Hook Terminal
• Connectivity to Gulf Coast refining complex
• Pipeline connectivity to all major basins
• Deepwater marine access
Houston Terminal
Nederland Terminal Marcus Hook Terminal
• ~1,200 acre site on USGC • ~800 acre site: inbound and outbound pipeline along with truck, rail
• ~29 million bbls crude storage capacity; 1.9 million bbls refrigerated propane/butane and marine capabilities
storage capacity • ~2 million bbls underground NGL storage; ~4 million bbls refrigerated
• 1.2 million bbls (standard) ethane storage tank as part of Orbit joint venture above-ground NGL storage; ~1 million bbls crude storage capacity
• ~700 thousand bbls/d of combined LPG, ethane and natural gasoline export capacity • ~1 million bbls refined products storage capacity
• ~600 thousand bbls/d of crude export capacity • 4 export docks accommodate VLGC and VLEC sized vessels
• 6 ship docks (3 NGL, 4 crude capable) and 4 barge docks accommodate Suez Max • ~400 thousand bbls/d of combined LPG and ethane export capacity
sized ships • Positioned for further expansion and development of exports,
• Rail and truck unloading capabilities processing, storage and manufacturing
• Expanded natural gasoline capabilities in 2020 to accommodate larger vessels and
provide access to international markets
• Space available for further dock and tank expansion and well positioned for future Nederland Terminal 22
growth opportunitiesET & ENBL Complementary Assets
Wellhead to Water Service
Natural NGLs Crude
Gas Oil
Gather ~ 14.8 million Transport ~24.6 million Capable of exporting ~1.1
Fractionate ~895 Transport ~3.8
mmbtu/d of gas & mmbtu/d of natural gas million bbls/d of crude
thousand bbls/d of million bbls/d of
705,000 bbls/d of NGLs via inter & intrastate oil and 1.1 million+
NGLs at Mont Belvieu crude oil
produced pipelines bbls/d of NGLs
The acquisition of Enable Midstream on December 2, 2021, improved Energy Transfer’s
connectivity and expanded its footprint
23
Note: As of 12/31/2021Successful Acquisition Track Record
HPL
TUFCO Houston Pipeline Co.
2004 2005 2006 2011 2012 2012 2012
2014 2015 2016 2017 2019 2021
ET Management has a proven track record of successfully integrating acquisitions
Knowledge of respective assets and businesses facilitates integrations of:
Operations
Commercial
Risk Management
Finance / Accounting
Information Technology
24Appendix
Crude Oil Segment
Crude Oil Pipelines
~11,300 miles of crude oil trunk and gathering lines
Directly connected to 6.8 MMbbls/d (~37%) of domestic refining capacity
1.1 MMbbls/d of ET-owned export capacity on USGC
ET owns and operates substantial interests in the following
systems/entities:
• Bakken Pipeline (36.4%) • White Cliffs (51%)
• Bayou Bridge Pipeline (60%) • Maurepas (51%)
• Permian Express Partners (87.7%)
Crude Oil Acquisition & Marketing
Crude truck fleet of approximately 350+ trucks, 350+ trailers, and 150+
offload facilities
Purchase crude oil at the lease from 3,000+ producers, and in-bulk from
aggregators at major pipeline interconnections and trading points
Market crude oil to refining companies and other traders across asset base
Optimize assets to capture time and location spreads when market
conditions allow
Asset Overview
Crude Oil Terminals
Crude
Terminals Nederland, TX Terminal - ~31 million barrel capacity
Houston, TX Terminal - ~18 million barrel capacity
Nederland Terminal
Cushing, OK - ~7.7 million barrel capacity
Midland Terminal
Northeast Terminals - ~6 million barrel capacity
Houston Terminal
Patoka, IL - ~1.9 million barrel capacity
Cushing Terminal
Midland, TX Terminal - ~1 million barrel capacity
26NGL & Refined Products Segment
Fractionation
7 Mont Belvieu fractionators (over 900 Mbpd)
40 Mbpd King Ranch, 25 Mbpd Geismar
50 Mbpd Houston DeEthanizer and 30 to 50 Mbpd Marcus Hook C3+ Frac in
service Q4 2017
150 Mbpd Frac VII placed in-service Q1 2020
NGL Storage
Total NGL storage ~70 million barrels
~53 million barrels NGL storage at Mont Belvieu
~10 million barrels of NGL storage at Marcus Hook & Nederland Terminals
Hattiesburg Butane Storage ~5 million barrels
NGL Pipeline Transportation
Asset Overview
Natural Gas Liquids (NGLs) ~5,200 miles of NGL Pipelines throughout Texas, Midwest, and Northeast
Refined Products Lone Star Express Expansion- completed in Q3 2020
Storage • ~352-mile, 24-inch NGL pipeline added ~400 Mbpd
Fractionator Mont Belvieu to Nederland Pipeline System
Terminals • 71-mile propane pipeline with 300 Mbpd capacity, expandable to 450 Mbpd
Processing/Treating • 71-mile butane pipeline with 200 Mbpd capacity
Marcus Hook Terminal • 62-mile natural gasoline pipeline with 30 Mbpd capacity
Nederland Terminal
Mariner Pipeline Franchise
• The Mariner East Pipeline System will be capable of moving 350-375 Mbpd of
Orbit¹ Refined Products NGLs (including ethane) to Marcus Hook upon full completion in the first
quarter of 2022
~180 Mbpd of ethane export capacity at Nederland ~3,600 miles of refined products pipelines in the • PA Access provides ~20-25 Mbpd of refined products capacity to PA and
Terminal northeast, Midwest and southwest US markets NE markets
37 refined products marketing terminals with ~8 million • Mariner West Pipeline – 55 Mbpd ethane pipeline to Canada 27
barrels storage capacity
1. JV with Satellite Petrochemical USA CorpMidstream Segment
Midstream Highlights
Extensive Permian Basin Footprint:
• Have ~3.7 million acres dedicated to ET processing plants in the
Permian Basin with an average of 7+ years remaining on contracts
PA
• Midland Basin inlet volumes continue to be at or near record highs
Grey Wolf Processing Plant
200 MMcf/d cryogenic processing plant in Delaware basin
Expected in service by end of 2022
Permian Bridge
Converted ~55 miles of existing 24-inch NGL pipeline to rich-
gas service
Project allows ~115 thousand MCF of rich-gas to move out of
the Midland Basin to the Delaware Basin, providing access to
additional takeaway options
Placed into service October 2021, and is already being
significantly utilized
Asset Overview Expansion underway to bring pipeline’s total capacity to over
200 thousand Mcf/d in Q1 2022
Permian
Midcontinent/Panhandle Current ET Processing
Current Processing Capacity
Capacity
South Texas
Bcf/d Basins Served
Southeast Texas
Permian 2.7 Permian, Midland, Delaware
North Texas Granite Wash, Cleveland, DJ,
Midcontinent/Panhandle 3.1
North Louisiana STACK
Eastern
~53,500 miles of gathering pipelines with ~11.2 Bcf/d of North Texas 0.7 Barnett, Woodford
Processing processing capacity South Texas 1.9 Eagle Ford
North Louisiana 2.1 Haynesville, Cotton Valley
Southeast Texas 0.4 Eagle Ford, Eagle Bine 28
Eastern 0.2 Marcellus UticaInterstate Pipeline Segment
Interstate Highlights
Our interstate pipelines provide:
Stability
• Approximately 95 percent of revenue is derived from fixed
reservation fees
Diversity
• Access to multiple shale plays, storage facilities and
Asset Overview
markets
Transwestern
Panhandle Eastern Growth Opportunities
EGT • Well-positioned to capitalize on changing supply and
MRT demand dynamics
SESH
Gulf Run Pipeline Project
Gulf States
• 42-inch interstate natural gas pipeline with 1.65 Bcf/d of
Tiger
Midcontinent Express
capacity
Trunkline Gas • Will provide natural gas transportation between the
Fayetteville Express Haynesville Shale and Gulf Coast
Rover • Expected compete by end of 2022
Sea Robin/Stingray
Storage ~26,600 miles of interstate pipelines with ~31 Bcf/d of throughput capacity and ~147 Bcf/d of working
storage capacity
PEPL TGC TW FGT SR FEP Tiger MEP Rover Stingray EGT MRT SESH Total
Miles of Pipeline 6,300 2,190 2,610 5,365 740 185 200 510 720 290 5,900 1,600 290 26,600
Capacity (Bcf/d) 2.8 0.9 2.1 3.7 2.0 2.0 2.4 1.8 3.4 0.4 6.2 1.7 1.1 30.5
Owned Storage (Bcf) 73.4 13.0 -- -- -- -- -- -- -- -- 29.0 31.5 -- 146.9
Ownership 100% 100% 100% 50% 100% 50% 100% 50% 32.6% 100% 100% 100% 50%
29Intrastate Pipeline Segment
~ 11,600 miles of intrastate pipelines with ~24 Bcf/d of throughput capacity,
Intrastate Highlights
and ~88 Bcf/d of working storage capacity
Well-positioned to capture additional revenues from anticipated changes in natural
gas supply and demand in the next five years
Strategically taken steps to lock-in additional volumes under fee-based, long-term
contracts with third party customers
Evaluating Permian Basin takeaway project that would utilize Energy Transfer
assets, along with a new build pipeline, to provide producers with firm capacity to the
premier markets of Katy, Carthage, Gillis and Henry Hubs
Capacity Pipeline Storage Bi- Major Connect
Pipeline
(Bcf/d) (Miles) (Bcf/d) Directional Hubs
Trans Pecos & Comanche Waha Header,
2.5 335 NA No Mexico Border
Trail Pipelines
Waha, Katy,
ET Fuel Pipeline 5.2 3,150 11.2 Yes Carthage
Oasis Pipeline 2.0 750 NA Yes Waha, Katy
Asset Overview HSC, Katy, Aqua
Houston Pipeline System 5.3 3,920 52.5 No Dulce
Trans Pecos/Comanche Trail
ETC Katy Pipeline 2.9 460 NA No Katy
ET Fuel
Union Power, LA
Oasis RIGS 2.1 450 NA No Tech
Houston Pipeline Waha
Red Bluff Express 1.4 108 NA No
Katy
EOIT¹ 2.4 2,200 24.0 Yes OG&E, PSO
RIGS
Red Bluff Express
EOIT
Storage
1. The EOIT pipeline system is has multidirectional flow capabilities between numerous receipt and delivery points, which limits our ability to
30
determinate an overall system capacity. During the year-ended December 31, 2020, the peak daily throughput was 2.4 Bcf/dNon-GAAP Reconciliations
Non-GAAP Reconciliation
Reconciliation of Non-GAAP Measures
*
(a)
2018 2019 2020 2021
Full Year Full Year Q1 Q2 Q3 Q4 Full Year Q1 Q2 Q3 Q4 Full Year
Net income $ 3,420 $ 4,825 $ (964) $ 672 $ (401) $ 833 $ 140 $ 3,641 $ 908 $ 907 $ 1,231 $ 6,687
Interest expense, net 2,055 2,331 602 579 569 577 2,327 589 566 558 554 2,267
Impairment losses 431 74 1,325 4 1,474 77 2,880 3 8 - 10 21
Income tax expense (benefit) from continuing operations 4 195 28 99 41 69 237 75 82 77 (50) 184
Depreciation, depletion and amortization 2,859 3,147 867 936 912 963 3,678 954 940 943 980 3,817
Non-cash compensation expense 105 113 22 41 30 28 121 28 27 26 30 111
(Gains) losses on interest rate derivatives (47) 241 329 3 (55) (74) 203 (194) 123 (1) 11 (61)
Unrealized (gains) losses on commodity risk management activities 11 5 (51) 48 30 44 71 (46) (47) 19 (88) (162)
Losses on extinguishments of debt 112 18 62 - - 13 75 7 1 - 30 38
Inventory valuation adjustments (Sunoco LP) 85 (79) 227 (90) (11) (44) 82 (100) (59) (9) (22) (190)
Impairment of investment in unconsolidated affiliates - - - - 129 - 129 - - - - -
Equity in (earnings) losses of unconsolidated affiliates (344) (302) 7 (85) 32 (73) (119) (55) (65) (71) (55) (246)
Adjusted EBITDA related to unconsolidated affiliates 655 626 154 157 169 148 628 123 136 141 123 523
Other, net ( including amounts related to discontinued operations in 2018) 219 (54) 27 74 (53) 31 79 15 (4) (11) 57 57
Adjusted EBITDA (consolidated) 9,565 11,140 2,635 2,438 2,866 2,592 10,531 5,040 2,616 2,579 2,811 13,046
Adjusted EBITDA related to unconsolidated affiliates (655) (626) (154) (157) (169) (148) (628) (123) (136) (141) (123) (523)
Distributable Cash Flow from unconsolidated affiliates 407 415 113 112 128 99 452 76 89 103 78 346
Interest expense, net (2,057) (2,331) (602) (579) (569) (577) (2,327) (589) (566) (558) (554) (2,267)
Preferred unitholders' distributions (170) (253) (89) (96) (97) (96) (378) (96) (99) (110) (113) (418)
Current income tax (expense) benefit (472) 22 14 (15) (7) (19) (27) (9) (15) (10) (10) (44)
Maintenance capital expenditures (510) (655) (103) (136) (129) (152) (520) (76) (140) (155) (210) (581)
Other, net 49 85 22 18 17 17 74 19 17 14 18 68
Distributable Cash Flow (consolidated) 6,627 7,766 1,836 1,585 2,040 1,716 7,177 4,242 1,766 1,722 1,897 9,627
Distributable Cash Flow attributable to Sunoco LP (100%) (445) (450) (159) (121) (139) (97) (516) (108) (145) (146) (143) (542)
Distributions from Sunoco LP 166 165 41 41 41 42 165 41 42 41 41 165
Distributable Cash Flow attributable to USAC (100%) (148) (222) (55) (58) (57) (51) (221) (53) (52) (52) (52) (209)
Distributions from USAC 73 90 24 24 24 25 97 24 24 25 24 97
Distributable Cash Flow attributable to noncontrolling interests in other non-wholly-owned subsidiaries (875) (1,113) (290) (209) (234) (282) (1,015) (251) (251) (284) (327) (1,113)
Distributable Cash Flow attributable to the partners of Energy Transfer 5,398 6,236 1,397 1,262 1,675 1,353 5,687 3,895 1,384 1,306 1,440 8,025
Transaction-related adjustments 52 14 20 10 16 9 55 19 9 6 160 194
Distributable Cash Flow attributable to the partners of Energy Transfer, as adjusted $ 5,450 $ 6,250 $ 1,417 $ 1,272 $ 1,691 $ 1,362 $ 5,742 $ 3,914 $ 1,393 $ 1,312 $ 1,600 $ 8,219
32
* See definitions of non-GAAP measures on next slideNon-GAAP Reconciliation
(a) The closing of the ETO Merger in October 2018 impacted the Partnership’s calculation of Distributable Cash Flow attributable to partners, as well as the number of Energy Transfer Common Units outstanding and the amount of distributions to be paid to partners. In order to provide information on a
comparable basis for pre-ETO Merger and post-ETO Merger periods, the Partnership has included certain pro forma information. For 2018, Distributable Cash Flow attributable to partners presented above reflects the following ETO Merger related impacts:
• ETO is reflected as a wholly-owned subsidiary and Distributable Cash Flow attributable to partners reflects ETO’s consolidated Distributable Cash Flow (less certain other adjustments, as follows).
• Distributions from Sunoco LP and USAC include distributions to both Energy Transfer and ETO.
• Distributable Cash Flow attributable to noncontrolling interest in our other non-wholly-owned subsidiaries is subtracted from consolidated Distributable Cash Flow to calculate Distributable Cash Flow attributable to partners.
Definitions
Adjusted EBITDA and Distributable Cash Flow are non-GAAP financial measures used by industry analysts, investors, lenders and rating agencies to assess the financial performance and the operating results of Energy Transfer's fundamental business activities and should not be considered in isolation or
as a substitute for net income, income from operations, cash flows from operating activities, or other GAAP measures. There are material limitations to using measures such as Adjusted EBITDA and Distributable Cash Flow, including the difficulty associated with using either as the sole measure to compare
the results of one company to another, and the inability to analyze certain significant items that directly affect a company’s net income or loss or cash flows. In addition, our calculations of Adjusted EBITDA and Distributable Cash Flow may not be consistent with similarly titled measures of other companies
and should be viewed in conjunction with measurements that are computed in accordance with GAAP, such as segment margin, operating income, net income and cash flow from operating activities.
We define Adjusted EBITDA as total partnership earnings before interest, taxes, depreciation, depletion, amortization and other non-cash items, such as non-cash compensation expense, gains and losses on disposals of assets, the allowance for equity funds used during construction, unrealized gains and
losses on commodity risk management activities, inventory valuation adjustments, non-cash impairment charges, losses on extinguishments of debt and other non-operating income or expense items. Inventory adjustments that are excluded from the calculation of Adjusted EBITDA represent only the changes
in lower of cost or market reserves on inventory that is carried at last-in, first-out (“LIFO”). These amounts are unrealized valuation adjustments applied to Sunoco LP’s fuel volumes remaining in inventory at the end of the period.
Adjusted EBITDA reflects amounts for less than wholly-owned subsidiaries based on 100% of the subsidiaries’ results of operations. Adjusted EBITDA reflects amounts for unconsolidated affiliates based on the same recognition and measurement methods used to record equity in earnings of unconsolidated
affiliates. Adjusted EBITDA related to unconsolidated affiliates excludes the same items with respect to the unconsolidated affiliate as those excluded from the calculation of Adjusted EBITDA, such as interest, taxes, depreciation, depletion, amortization and other non-cash items. Although these amounts are
excluded from Adjusted EBITDA related to unconsolidated affiliates, such exclusion should not be understood to imply that we have control over the operations and resulting revenues and expenses of such affiliates. We do not control our unconsolidated affiliates; therefore, we do not control the earnings or
cash flows of such affiliates.
Distributable Cash Flow is used by management to evaluate our overall performance. Our partnership agreement requires us to distribute all available cash, and Distributable Cash Flow is calculated to evaluate our ability to fund distributions through cash generated by our operations. We define
Distributable Cash Flow as net income, adjusted for certain non-cash items, less distributions to preferred unitholders and maintenance capital expenditures. Non-cash items include depreciation, depletion and amortization, non-cash compensation expense, amortization included in interest expense, gains
and losses on disposals of assets, the allowance for equity funds used during construction, unrealized gains and losses on commodity risk management activities, inventory valuation adjustments, non-cash impairment charges, losses on extinguishments of debt and deferred income taxes. For
unconsolidated affiliates, Distributable Cash Flow reflects the Partnership’s proportionate share of the investee’s distributable cash flow.
On a consolidated basis, Distributable Cash Flow includes 100% of the Distributable Cash Flow of Energy Transfer's consolidated subsidiaries. However, to the extent that noncontrolling interests exist among the Partnership’s subsidiaries, the Distributable Cash Flow generated by our subsidiaries may not
be available to be distributed to our partners. In order to reflect the cash flows available for distributions to the partners of Energy Transfer, the Partnership has reported Distributable Cash Flow attributable to the partners of Energy Transfer, which is calculated by adjusting Distributable Cash Flow
(consolidated), as follows:
• For subsidiaries with publicly traded equity interests, Distributable Cash Flow (consolidated) includes 100% of Distributable Cash Flow attributable to such subsidiary, and Distributable Cash Flow attributable to the our partners includes distributions to be received by the parent company with respect to
the periods presented.
• For consolidated joint ventures or similar entities, where the noncontrolling interest is not publicly traded, Distributable Cash Flow (consolidated) includes 100% of Distributable Cash Flow attributable to such subsidiaries, but Distributable Cash Flow attributable to the partners reflects only the amount of
Distributable Cash Flow of such subsidiaries that is attributable to our ownership interest.
For Distributable Cash Flow attributable to partners, as adjusted, certain transaction-related and non-recurring expenses that are included in net income are excluded.
33You can also read