Cash grants to manufacturers after Cyclone Idai - RCT evidence from Mozambique WIDER Working Paper 2021/87
←
→
Page content transcription
If your browser does not render page correctly, please read the page content below
WIDER Working Paper 2021/87

Cash grants to manufacturers after Cyclone Idai

RCT evidence from Mozambique

Hanna Berkel, Peter Fisker, and Finn Tarp*

May 2021
Abstract: In March 2019, Cyclone Idai hit central Mozambique and caused widespread damage,
including businesses in the enterprise sector. We use panel data and a randomized controlled trial
to estimate the impact of unconditional cash grants on micro enterprises and their recovery. We
find that, on average, the cash grants had a positive effect on firm revenue, profits and savings,
and the likelihood of having their roof repaired. The cash had a stronger impact in the more
damaged city (Beira) compared to the less affected location (Chimoio) and was particularly
effective for carpenters. These findings indicate that access to finance is critically important for
firm recovery following disasters.
Key words: firms, manufacturing, natural disasters, cyclone, unconditional cash grants,
randomized controlled trial
JEL classification: O12, O14, Q54, H81
Acknowledgements: The authors wish to thank the participants of the PhD course ‘Global
Disaster Studies: Past, Present, and Future’ at the University of Copenhagen, the Inclusive Growth
in Mozambique Annual Conference 2019 and 2020, the Climate Talks at the University of
Copenhagen, the Oxford CSAE Conference 2021, and the DERG seminar, whose comments
improved our paper. We are grateful to John Rand, Sam Jones, Ricardo Santos, Edith Zink, and
Sina Smid for excellent feedback and to Mary Lukkonen for copyediting. Moreover, we express
our gratitude to the enumerators who collected the data with a lot of dedication and the firm
owners who patiently participated in our interviews.

*Development Economics Research Group, University of Copenhagen, Denmark; corresponding author: hmb@econ.ku.dk
This study has been prepared within the UNU-WIDER project Inclusive growth in Mozambique – scaling-up research and capacity
implemented in collaboration between UNU-WIDER, University of Copenhagen, University Eduardo Mondlane, and the
Mozambican Ministry of Economics and Finance. The project is financed through specific programme contributions by the
governments of Denmark, Finland, and Norway.
Copyright © UNU-WIDER 2021
UNU-WIDER employs a fair use policy for reasonable reproduction of UNU-WIDER copyrighted content—such as the
reproduction of a table or a figure, and/or text not exceeding 400 words—with due acknowledgement of the original source,
without requiring explicit permission from the copyright holder.
Information and requests: publications@wider.unu.edu
ISSN 1798-7237 ISBN 978-92-9267-027-6
https://doi.org/10.35188/UNU-WIDER/2021/027-6
Typescript prepared by Mary Lukkonen.
United Nations University World Institute for Development Economics Research provides economic analysis and policy advice
with the aim of promoting sustainable and equitable development. The Institute began operations in 1985 in Helsinki, Finland, as
the first research and training centre of the United Nations University. Today it is a unique blend of think tank, research institute,
and UN agency—providing a range of services from policy advice to governments as well as freely available original research.
The Institute is funded through income from an endowment fund with additional contributions to its work programme from
Finland, Sweden, and the United Kingdom as well as earmarked contributions for specific projects from a variety of donors.
Katajanokanlaituri 6 B, 00160 Helsinki, Finland
The views expressed in this paper are those of the author(s), and do not necessarily reflect the views of the Institute or the United
Nations University, nor the programme/project donors.

1     Introduction

A tropical cyclone is a rotating system of clouds that develops over tropical waters. It consists of
winds, thunderstorms, torrential rains, large waves, and floods (NOAA 2020). Tropical cyclones
are one of the most destructive weather phenomena on the planet, and climate change increasingly
affects their intensity. Furthermore, coastal populations are particularly prone to suffer from the
consequences of cyclones because of rising global sea levels (Walsh et al. 2019; Peduzzi et al. 2012).

In March 2019, Cyclone Idai hit central Mozambique and destroyed the country’s second-largest
port city Beira and surrounding areas. Around 1.85 million people were affected, 400,000
displaced, and more than 1,000 died in what is reported to be the most devastating disaster in the
history of southern Africa. Roads that connect the area with the rest of Mozambique and
neighboring countries were washed away and people suffered from severe food and water
shortages, disease outbreaks, and criminal activities (COM 2019a, 2019b, 2019c; WHO 2019a,
2019b). As one of the countries most vulnerable to climate change, similar weather events might
occur on a more regular basis in the future. Hence, it is crucial to create scientific evidence on the
current limitations to recovery.

Compared to households, firm recovery from cyclone destruction is not studied much. There
exists little evidence on firms and disasters in high-income countries, and studies on businesses in
the Global South are even scarcer. However, micro, small, and medium enterprises (MSMEs)
employ around 90 per cent of all workers in developing countries and are often the only source of
income for the poor (Page and Söderbom 2015). Thus, the local community will be able to recover
fully only if MSMEs get back on their feet after a disaster (Mendoza et al. 2018).

To our knowledge, only one other randomized controlled trial (RCT) exists that investigates the
recovery of enterprises in a low-income country following a natural disaster. Specifically, de Mel
et al. (2012) randomly allocated in-kind and cash grants to micro-sized businesses in Sri Lanka
after the Asian tsunami of December 2004. They show that access to capital matters for the
recovery of enterprises. Those who received grants recovered their profit levels almost two years
before comparable firms. Further, business recovery appears to be slow, and therefore, grants
might have the potential to boost the recovery process of micro firms after a weather-related
shock.

The present study implements an experiment that is comparable to the one by de Mel et al. (2012)
but with a few modifications, most notably a different setting and a different type of disaster.
Further, our project is smaller as it only covers two survey rounds and focuses only on the
manufacturing sector. As the generalizability of RCTs has been questioned (Barrett and Carter
2010), this study contributes to the debate about applications of somewhat similar RCTs in
different contexts.

Another contribution is the sampling strategy, which employs a stratified adaptive cluster sampling
approach (Thompson 1990, 1991). This allowed us to locate informal enterprises, i.e. those not
registered with any government agency. Informal businesses represent the majority of enterprises
in Mozambique, so we believe that our results are more representative of an average firm in the
country than the studies that look at formal enterprises only. Furthermore, informal firms are likely
to be more vulnerable than their formal counterparts because they are smaller and exhibit lower
performance, underlining the importance of understanding what can help informal firms after a
climate-related shock.

                                                  1
We find that, on average, our cash grants had a positive effect on firm income, profit, savings, and
roof repair. We cannot identify any significant effect of the treatment on firm size. More
importantly, the grants had a stronger income return in the city affected by Cyclone Idai compared
to the less affected location, indicating that access to cash can enhance firm recovery after disasters.
In particular, a year after the cyclone, and six months after the treatment, treated firms in Beira
had a monthly income of around MZN5,080 more than expected in absence of treatment. When
investigating differential effects across manufacturing industries, we find that the treatment was
particularly effective for carpenters.
Our paper is structured as follows. The next section outlines the relevant literature. A detailed
outline of our sample and intervention follows, including summary statistics. Section 4 provides
our methodology, and Section 5 presents the results, while Section 6 concludes.
2 Literature and context
Unconditional cash transfers (UCTs) are cash payments given to underprivileged people without
requiring anything in return. Governments, non-governmental organizations (NGOs), and
research projects in low- and middle-income countries provide cash transfers as social protection
to support people’s livelihoods by, for example, reducing poverty or boosting health and education
outcomes (Pega et al. 2017). A recent meta-analysis shows that most cash transfer programmes
have a statistically significant impact on their intended objectives (Bastagli et al. 2019). ‘[C]ash
transfers not only play a role in reducing poverty by transferring resources but can also foster
people’s economic autonomy and self-sufficiency’ (Bastagli et al. 2019: 589). In terms of medium-
or long-term effects, however, the evidence of an effect is weaker and more limited.
In the context of disasters, cash transfers have the potential to protect basic consumption to
prevent food insecurity, hamper diseases, recover damaged assets, and preserve human capital by
securing children’s education. Thereby, people are assisted to avoid falling into deeper poverty
(Doocy and Tappis 2017; Gentilini 2016; World Bank 2007). Several studies exist that investigate
the effects of UCTs on households following a nature-related disaster. For the case of Fiji, Mansur
et al. (2018) find that households that received cash transfers after a tropical cyclone recovered
quicker in terms of repair of their dwellings, food stocks, and investments in new livelihoods. Cash
grants in the Philippines following typhoon Yolanda reduced malnutrition prevalence and
increased school attendance among children (Reyes et al. 2018).
Despite mounting evidence of the benefits of cash grants in post-disaster settings, the Government
of Mozambique did not allow international aid agencies to hand out direct cash transfers to the
victims of Cyclone Idai in Beira (SARTCWG 2019).
While firms affected by disasters in high-income countries are often covered by insurance, have
savings, or can obtain recovery loans (Kemp 2017; Webb et al. 2002), businesses in developing
countries rarely have these options. Despite these obstacles, the admittedly limited existing
evidence suggests that firms in the Global South repair damages and replace losses at a relatively
quick pace. In Sri Lanka, for example, firms had recovered their pre-disaster size 15 months after
the tsunami. Most of them relied on personal savings or loans from family and friends during the
recovery process (de Mel et al. 2012).
Moreover, de Mel et al. (2012) tested whether cash grants helped disaster-affected firms in their
recovery process in Sri Lanka. The principal outcome was that firms that obtained grants after a
tsunami recovered their profit levels around two years earlier than enterprises that did not receive
2support. This effect, however, is stronger for the retail than for the manufacturing sector. In turn,
the authors conclude that a lack of financial capital is not the main constraint in manufacturing
firms’ recovery process.
3 Data and intervention
3.1 Timeline
On 15 March 2019, the second-deadliest tropical cyclone in the Southern Hemisphere’s history hit
central Mozambique. 1 With its strong winds of up to 175 km/h, torrential rains, and severe
flooding, Cyclone Idai killed more than 1,000 people and left catastrophic damage of more than
US$2 billion (EM-DAT 2020). Formal companies reported overall damage of US$145 million and
12,000 destroyed jobs in large enterprises alone (COM 2019d). One of the areas most affected was
Mozambique’s second-largest port city, Beira (IFRC 2020).
The event timeline in Figure 1 shows that six months after the cyclone, in September 2019, we
initiated our sampling approach (see Section 3.3) and baseline data collection in the cities of Beira
and Chimoio. After completion of the baseline data collection, we randomly selected 130 firms
into our treatment group and handed out cash grants in October 2019. In April 2020, we
conducted a follow-up survey. In total, firms were asked to recall five different points in time, i.e.
months. In the baseline data collection, enterprises provided information about their pre-cyclone
situation in February 2019 (1), post-cyclone condition in April 2019 (2), and baseline state in
August 2019 (3). In the follow-up survey, we enquired about their post-treatment situation in
February 2020 (4) and one year after the cyclone in March 2020 (5). Hence, we have two survey
waves but five different points in time for which the enterprises provided data. The follow-up
survey could not take place through personal interviews because of the COVID-19 pandemic and
was done by telephone.
3.2 Sample and intervention
Manufacturing firms are an essential part of the industrial sector, and the development of a strong
industry carries with it the potential of high and dynamic economic growth and employment
generation, which are critically important for a low-income country like Mozambique (Szirmai
2009). We therefore focus on the manufacturing sector. Specifically, we compare the effects of
cash grants for firms in the city of Beira, which was strongly affected by Cyclone Idai, with the
grants’ impact on enterprises in the city of Chimoio, which was also hit but to a much smaller
extent. This allows for interpreting the difference-in-difference estimates as a lower bound of the
true treatment effect.
1 The deadliest cyclone recorded in the Southern Hemisphere was the 1973 Flores cyclone in Indonesia, with more
than 1,600 deaths.
3Figure 1: Event timeline
Source: authors’ illustration.
Almost all enterprises in Beira suffered some type of damage caused by the cyclone, while it
affected fewer businesses in Chimoio. Our sample shows that in the month following Cyclone Idai
(April 2019), firms in Beira only earned 36 per cent of the pre-cyclone income level, while
enterprises in Chimoio reported an average of 56 per cent. Further, 85 per cent of the Beira firms
had their roof damaged or destroyed, while this was only the case for 43 per cent of the enterprises
based in Chimoio. Of the firms that had fixed walls during the cyclone, 40 per cent in Beira
declared damaged walls compared to 16 per cent in Chimoio. Similarly, external sources estimate
that almost the entire economic infrastructure of Beira was destroyed by Idai, while Chimoio’s
situation was much more stable (COM 2019d).
In Mozambique, a majority of micro enterprises are informal. In the case of Beira, a recent study
shows that for each formal enterprise there are 17 informal businesses (Jolevski and Ayana Aga
2019). Because informal firms are unregistered with government authorities, there does not exist
any representative enterprise sample for the country or any Mozambican city. To obtain a
representative sample of the population of micro-sized firms from the manufacturing sector, we
therefore used a stratified adaptive cluster sampling approach (Thompson 1990, 1991) similar to
Jolevski and Ayana Aga (2019). We divided the areas for examination (e.g., the cities of Beira and
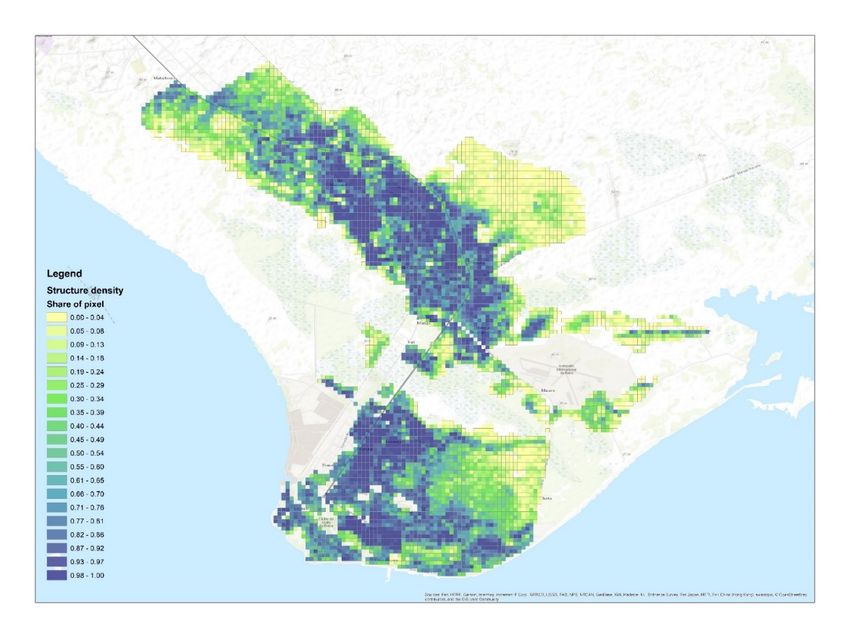
Chimoio) into squares of 115 m x 115 m (see Figure 2). In each city, we randomly selected 200
squares. To account for the uneven population density across the area, we weighted the random
draw of cells by information on the density of structures in each cell, following Sohnesen et al.
(2020). A group of enumerators located all micro businesses that were operative in the selected
squares. When one or more firms were found in a square, its neighbouring squares (i.e. the squares
north, south, east, and west of the square) were also inspected for enterprises.
Additionally, we managed to re-interview 80 micro firms that were already included in our previous
enterprise surveys (IIM 2018, 2013). 2 These IIM enterprises report larger profits, more employees,
higher educational levels, and a smaller likelihood to be informal because we sampled them from
government data sets in the past. The firms that we found with our cluster sampling approach are
more likely to be representative of an average micro enterprise in Mozambique as there exist many
2IIM stands for manufacturing enterprise survey and was implemented in 2012 and 2017 with support from the Development
Economics Research Group (DERG) at the University of Copenhagen. See more details in our reports. See IIM (2013, 2018).
4more informal than formal businesses in the country. Overall, we believe that our sample is
representative of the manufacturing sector in the respective cities because almost all firms located
when walking through the whole town participated in our enquiry. Most firms agreed to participate
for compensation of mobile phone credits of MZN200.
Figure 2: Beira decomposed into squares with colours indicating structure density
Source: authors’ illustration using ArcMap and Google Earth.
We conducted a panel survey with 427 micro enterprises from the manufacturing sector affected
by Cyclone Idai. Some 215 firms are in Beira, the city most affected by the cyclone. The other 212
enterprises are located in Chimoio, a city about 200 km away from Beira and much less affected
by Idai (COM 2019d). Micro-size implies that a firm employs less than 10 workers. A few of the
enterprises employed more than nine workers at some point in time during the studied period.
However, they did not exceed the size requirement when taking the average number of workers
during the whole period (February 2019–March 2020). Our classification of manufacturing
industries follows the definitions by the International Standard Industrial Classification of All
Economic Activities (ISIC codes) at the four-digit level (UNSD 2008).
The baseline questionnaire asked enterprises about owner characteristics such as age, education,
risk attitude, and gender as well as firm characteristics like registration status, number of
employees, sales, expenses, and savings. Further, we enquired which assets were damaged or
destroyed by the cyclone and if they had been repaired or replaced. We also posed a few questions
on the type of help received following the cyclone, insurance, knowledge about climate change,
and future adaptation.
After the baseline survey, we randomly selected 130 enterprises and provided them with
unconditional cash grants of MZN6,000 (about US$100). In the end, only 121 firms received the
money because the remaining eight were unavailable or refused to receive the grant. Of those who
received the grant, 61 are located in Beira and 60 in Chimoio. The grant amount matches the
median yearly investments made by a micro-sized firm in Beira prior to the cyclone (IIM 2018)
5and ensures comparability with a similar study (de Mel et al. 2012). We transferred most grants to
interviewees’ mobile money accounts (MPesa), and, in case they did not have a mobile account,
we handed over the grants in cash. Our guidance instructed recipients to use the money for their
business and not for any personal or household-related purchases. We did not specify the type of
business-related spending they were supposed to make with the money. We framed the treatment
in terms of a lottery in which all enterprises that participated in the interview were taking part.
Using standard power calculation tools (see Duflo et al. 2006) jointly with knowledge about micro
businesses from the IIM 2017 survey (IIM 2018), we aimed at interviewing a sample of around
400 manufacturing companies with less than 10 employees. We assumed that the detectable effect
of our treatment would be relatively low (around 25 per cent of a standard deviation in the outcome
variable) and that we could explain 50 per cent of the variation in the outcome variable by a
combination of the treatment variable and covariates. Hence, a sample of 400 firms would yield a
power of around 90 per cent at a 0.05 significance level. This is a high level of power because 80
per cent is acceptable in most of the cases. We were able to interview more than 400 firms in both
survey rounds and handed the treatment to 130 enterprises instead of 140.
Attrition is low. In total, we interviewed 475 firms in the baseline and less than 10 per cent could
not be re-interviewed in the follow-up (442). If we had been able to implement the survey in
person, attrition would probably have been lower because several entrepreneurs refused to submit
confidential information over the phone. During the cleaning process, we dropped a few
businesses, for example, because they did not fulfil the requirement of being micro-sized. The final
panel data set consists of 427 enterprises. All firms that received the treatment are included in the
panel except for one.
3.3 Recovery counterfactual
To find the causal effect of our treatment, the cash grant, we should ideally observe the same firm
in a situation where it receives the treatment and compare it to a counterfactual situation where it
does not receive a cash grant. This, however, is impossible because we can only observe one
outcome per firm. Random assignment of enterprises into treatment and control groups in
combination with the law of large numbers allows us to establish solid counterfactuals (Seawright
2016). Specifically, we can estimate the expected average effect of our treatment on a group of
enterprises by comparing them to a similar group of enterprises that did not receive the treatment.
The two groups should only differ by their exposure to the cash grant (Duflo et al. 2006).
Furthermore, to understand the recovery process of firms, we need to know how they would have
developed in the absence of the cyclone. Therefore, we compare Beira, a city the catastrophe
destroyed almost entirely, with Chimoio, the next biggest city that was also affected but to a much
smaller extent. Both cities are located in central Mozambique, only 200 km apart, and both depend
to some extent on trade with neighboring Zimbabwe. In 2016, the micro-sized IIM enterprises
located in Beira and Chimoio reported statistically different average income levels than the firms
in the country’s five other major cities combined. In terms of firm size, businesses in Beira and
Chimoio were slightly larger than in the remaining provinces. Moreover, only 17 per cent of firms
in Beira and Chimoio reported paying taxes, while 34 per cent did so in the other areas (see
Appendix Table A1). As Chimoio was also to some degree affected by the cyclone, it is
furthermore likely that our estimates are slightly biased towards zero, i.e. showing a smaller effect
of the cash grants than the true effect.
63.4 Exploring the data
We start by looking at firm revenue gained from sales (income) in Table 1. Before the cyclone, an
average business made MZN37,000 per month. This value dropped sharply to MZN17,000 in the
month following Cyclone Idai. Six months later, the income had already increased to MZN30,000,
around 80 per cent of the pre-cyclone revenue level. However, one year after Idai, the average
firm’s income had not recovered to pre-cyclone values. The income was even lower (MZN26,000)
than the income six months after Idai (MZN29,000).
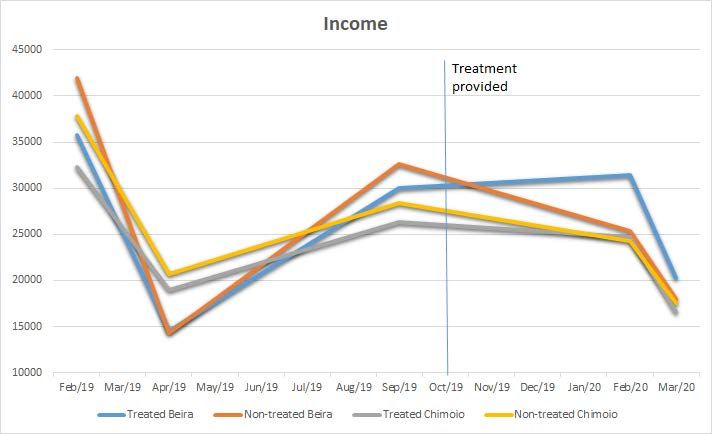
Figure 3: Firm income over time
Source: authors’ illustration based on cyclone data.
When differentiating between treatment and control groups in the two cities, we find that Beira
and Chimoio had similar income levels before the cyclone (see Figure 3). However, after the
cyclone, average enterprise revenue dropped much more in Beira than in Chimoio. Firms
recovered in both locations but did not reach pre-cyclone income levels six months after the
cyclone in September 2019. Beira did slightly better than Chimoio, but the difference is statistically
insignificant. After our cash grants had been handed out, the treatment group in Beira reported
higher income levels (MZN32,000) than both the treatment group in Chimoio and the control
groups in the two cities (MZN25,000). In March 2020, revenue dropped again, perhaps because
of the COVID-19 pandemic. The treatment group in Beira, however, still had higher income than
the three remaining groups.
Our income data are based on recall, so one may raise the concern that firms in Beira systematically
underreported the baseline income from February 2019 (pre-cyclone) because of the large shock
they experienced. If the actual baseline income in Beira was statistically different from the one
reported, we would obtain biased estimations of the causal effect. Therefore, we apply a parallel
trends analysis in Appendix Figure A1. Using a data set of manufacturing firms from previous
years (IIM 2013, 2018), we find that enterprises in Beira and Chimoio had very similar income
levels between 2011 and 2016 and followed the same trend over time (see also Appendix Table
A2).
7Table 1: Summary statistics
Beira Chimoio
Whole Treated Control Treated Control
sample
Income before Idai (Feb’19) 37,418 34,760 40,993 31,071 37,368
Income after Idai (Apr’19) 17,207 14,489 14,247 18,917 20,622
Income 6 months after Idai (Sep’19) 29,790 29,879 32,577 26,234 28,335
Income 1 year after Idai (Feb’20) 26,259 31,459 25,393 25,779 25,238
Savings before Idai (Feb’19) 3,705 2,675 4,555 1,940 3,954*
Savings after Idai (Apr’19) 1,034 613 888 548 1,543
Savings 6 months after Idai (Sep’19) 2,510 2,696 2,523 1,533 2,810
Savings 1 year after Idai (Feb’20) 2,993 3,582 2,691 2,513 3,252
Firms without employees 0.08 0.11 0.08 0.10 0.07
Firm size before Idai (Feb’19) 3.38 3.28 3.62 2.78 3.40
Firm size after Idai (Apr’19) 2.93 2.75 3.03 2.45 3.09**
Firm size 6 months after Idai (Sep’19) 3.10 2.95 3.27 2.72 3.13
Firm size 1 year after Idai (Feb’20) 3.22 3.13 3.25 2.68 3.44*
Roof damaged/destroyed 0.64 0.88 0.85 0.41 0.42
Roof repaired 6 months after Idai 0.78 0.82 0.78 0.81 0.72
Primary education 0.38 0.51 0.43 0.37 0.29
Secondary education or higher 0.29 0.21 0.32 0.25 0.30
University degree 0.01 0.02 0.01 0.03 0.01
Business-related education 0.26 0.30 0.27 0.20 0.24
Informal 0.77 0.84 0.75 0.78 0.77
Female 0.10 0.13 0.11 0.00 0.11***
Owner age 40.25 42.57 42.60 37.43 38.06
Electricity access 0.79 0.75 0.81 0.85 0.76
Internet access 0.05 0.03 0.07 0.05 0.04
Smartphone owner 0.38 0.25 0.40** 0.43 0.40
Bank loan 0.04 0.03 0.07 0.00 0.03
Carpenter 0.35 0.30 0.42* 0.33 0.31
Tailor 0.23 0.33 0.25 0.15 0.20
Blacksmith 0.15 0.15 0.12 0.33 0.13***
Food producer 0.10 0.05 0.06 0.11 0.15
Observations 427 61 154 60 152
Note: mean estimates; stars represent significance levels for t-tests. *Significance at a 10 per cent level,
**significance at a 5 per cent level, and ***significance at a 1 per cent level.
Source: authors’ calculations based on cyclone data.
Column 1 of Table 1 shows that eight per cent of the sampled businesses do not have any
employees. Before the cyclone, they had an average of 3.4 workers, which dropped to 2.9 after the
cyclone but slowly increased in the following months to 3.2 one year after the disaster. Around 40
per cent of the entrepreneurs have completed primary education, and one-third have attended
secondary school or hold at least a secondary school degree. Only one per cent have a university
degree, whereas one-quarter went through an education programme related to their business
activity. Almost 80 per cent of the enterprises are informal in the sense that they do not pay taxes.
However, given their low revenue level, 70 per cent of the informal firms were tax exempt in 2019
such that they do not need to have to be formal in the sense of paying taxes anyway. 3 Only 10 per
cent of the enterprises have female owners or managers. The firm owners’ average age is 40 years,
with entrepreneurs in Chimoio being slightly younger (38 years) than in Beira (43 years). About 80
per cent of the sample has electricity access but only five per cent has internet access, while 38 per
cent own a smartphone. A very small share of four per cent has a bank loan. More than one-third
of the sample are active as carpenters in the furniture industry, i.e. they produce products made of
3Of 209 informal firms, 145 were tax exempt in 2019 because they had an annual turnover of less than MXN252,000,
which is 36 times the minimum wage of the manufacturing industry (GOM 2019).
8wood such as tables, beds, and closets. The second-largest industry is composed of tailors (23 per
cent), followed by blacksmiths (15 per cent) and food producers (10 per cent).
Because we randomly assigned the cash grants to firms, the treatment assignment should not be
related to any firm characteristics. To validate this assumption, Table 1 compares the averages of
observable features of the treatment and control groups in Beira to the treatment and control
groups in Chimoio (Appendix Table A3 compares Beira with Chimoio and the treatment with the
control group). T-tests show whether the averages are statistically different across groups. There
are almost no statistically significant differences between the treatment and control groups in both
locations. Firms’ income levels, savings, and size are similar over time. However, in Chimoio, the
savings between the treated and control firms differed significantly in the month before the
cyclone, as they were lower for treated (MZN1,940) than for control firms (MZN3,954). Further,
the firm size of Chimoio’s enterprises differed significantly between the treatment and control
groups in April 2019 (2.5 vs. 3.1) and one year after the cyclone (2.7 vs. 3.4), while the firm size of
Beira’s treatment and control groups did not differ statistically.
Treatment and control groups in both cities are similar in terms of education, informality, age,
electricity access, internet access, and usage of bank loans. We find a few statistically significant
differences in firm/owner characteristics among each city. In Chimoio, the treatment group does
not include any female owner or manager, while 11 per cent of the control group’s firm owners
are women. Surprisingly, Beira’s treated firms have significantly fewer smartphone users (25 per
cent) than the control group (40 per cent). Regarding manufacturing industries, there are
significantly more carpenters in Beira’s control group (42 per cent) than in its treatment group (30
per cent), while there is no statistically significant difference in carpenter shares in Chimoio.
Among Chimoio’s firms, there are significantly more blacksmiths in the treatment (33 per cent)
than in the control group (13 per cent).
4 Methodology
We start by estimating whether the treatment, i.e. the cash grants, had an effect on the treated
firms (ATT), independently of their location:
Yi,m = αi + β1Ti,m + β2Mi + β3Xi + γm + εi,m (1)
In equation 1, Yi,m denotes the outcome of interest for firm i at time m, which is measured along
several firm performance indicators, with firm revenue from sales being the main one. T is a
dummy variable indicating whether a firm is part of the treatment group. To control for time
trends, we count the event of Cyclone Idai as being a shock for firm performance. Thus, we create
a dummy for the month before the cyclone (M=0 for Feb 2019) and for the four months for which
we have data after the cyclone (M=1 for Apr 2019, Sep 2019, Feb 2020, Mar 2020). X are variables
controlling for a firm owner being female, age, education, and if she owns a smartphone because
these are the variables that differ significantly between the different groups. Furthermore, we
include firm fixed effects (FE) into our specification, which are denoted by αi.
Our main purpose is to find out whether access to finance enhances firm recovery. Recovery does
not only imply that firms manage to recover to pre-cyclone levels but that they catch up to levels
at which they would have been in absence of the cyclone. In our case, Chimoio represents the
situation in which the enterprises would have found themselves if Idai had not happened. Thus,
we have to look at the differential impact of the treatment between Chimoio and Beira.
9Yi,m = αi + β1MBTi,m + β2Bi + β3Ti,m + β4Mi + β5MB + β6MT + βBT+ εi,m (2)
B is a dummy variable indicating if a firm is located in Beira (1) or Chimoio (0), and the interaction
of being located in Beira and in the treatment group during the post-cyclone period, β1, is our main
estimate of interest.
5 Results
We begin by investigating if the cash grants had an effect on the treatment group, independent of
whether being located in the cyclone-affected Beira or the less affected Chimoio. Table 2 shows
that the cash grants increased firms’ income by 65 per cent. The estimate increases to 91 per cent
when including firm FE. Further, the grants increased profits by 15 per cent and savings by 164
per cent compared to the control group. Enterprises that received the grants are also more likely
to have their roof repaired compared to the control group. One channel through which the
treatment might have affected firm performance is the hiring of new employees. We test this
hypothesis but have to reject it, i.e. the cash grants did not increase the treated firms’ size.
Table 2: Cash grants and firm outcomes
Income Income Profits Savings Firm size Repaired roof
OLS FE FE FE FE FE
Treatment 0.651*** 0.906*** 0.153* 1.642*** 0.101 0.109**
(0.151) (0.218) (0.082) (0.412) (0.068) (0.048)
Post-cyclone -1.511*** -1.542 -0.451*** -1.506*** -0.077*** 0.043***
period (M) (0.097) (0.083) (0.056) (0.171) (0.018) (0.009)
Female 0.055 0.277 -0.074 -1.245 -0.219** 0.148
(0.214) (0.630) (0.193) (1.112) (0.111) (0.117)
Age -0.007 0.011 -0.000 -0.004 0.006 0.001
(0.005) (0.013) (0.008) (0.031) (0.005) (0.002)
Primary education -0.319** -0.046 0.170* -0.615 -0.073 -0.024
(0.135) (0.234) (0.103) (0.464) (0.085) (0.056)
Smartphone 0.309** -0.065 0.090 -0.349 -0.007 0.053
(0.130) (0.211) (0.126) (0.408) (0.049) (0.043)
Observations 2,135 2,135 2,135 2,135 1,528 1,275
Number of firms 427 427 427 427 407 279
R2 0.09 0.06 0.03 0.06 0.03 0.06
Note: ordinary least squares (OLS) regression in Column 1 and fixed-effects (FE) regressions in Columns 2–6.
Robust standard errors in parentheses. *Significance at a 10 per cent level, **significance at a 5 per cent level,
and ***significance at a 1 per cent level. We include industry dummies for carpenters, tailors, blacksmiths, and
food producers. Income, profits, savings, and firm size are logged.
Source: authors’ calculations based on cyclone data.
To understand if firms located in the cyclone-affected city managed to recover to the level at which
they would have been if Idai had not occurred, we add an interaction term (treatment X Beira X
post-cyclone period) as specified in equation (2). Table 3 shows that the treatment effect is positive
and statistically different for enterprises located in Beira. Treated firms in Beira report an increase
in income of 109 per cent compared to the counterfactual, and when adding firm FE, this estimate
increases to 175 per cent. In monetary terms, Beira’s treated firms’ income is around MZN5,070
higher than what would have been expected in absence of treatment.
We also investigate the effect of the grants on other firm outcomes. We do not find any statistically
different effect of the grants in Beira compared to Chimoio regarding profits, savings, the
likelihood of a repaired roof, and firm size.
10Table 3: Cash grants and firm outcomes in Beira
Income Income Profits Savings Firm size Repaired
roof
OLS FE FE FE FE FE
Post-cyclone 1.088*** 1.750*** 0.237 0.090 0.133 -0.026
period (M) x (0.313) (0.395) (0.151) (0.811) (0.135) (0.097)
Treatment x Beira
Post-cyclone -0.993*** -1.087*** -0.115 -1.147*** -0.060* -0.014
period x Beira (0.200) (0.154) (0.110) (0.336) (0.035) (0.021)
Post-cyclone -0.987*** -0.984*** -0.391*** -0.912*** -0.044* 0.054***
period (M) (0.120) (0.096) (0.063) (0.229) (0.025) (0.018)
Observations 2,135 2,135 2,135 2,135 1,528 1,275
Number of firms 427 427 427 427 407 279
R2 0.06 0.07 0.03 0.05 0.02 0.05
Note: robust standard errors in parentheses; income, profits, savings, and firm size are logged. *Significance at a
10 per cent level, **significance at a 5 per cent level, and ***significance at a 1 per cent level.
Source: authors’ calculations based on cyclone data.
To check the robustness of our results, we run the same regressions separately for the Beira and
Chimoio sample, and we obtain very similar findings (see Appendix Tables A4 and A5). The cash
grants positively affected firm income and profits in Beira but not in Chimoio. In Beira, treated
firms’ income increased by 180 per cent and their profits by 25 per cent compared to the control
group. However, in both cities, the grants had an effect on savings. In Beira, treated firms’ savings
increased by 174 per cent compared to the control group, and in Chimoio, the magnitude was
similar with 165 per cent. Moreover, in Beira, the treatment had a positive impact on the likelihood
of a repaired roof and on firm size, while there was no significant effect on these outcomes in
Chimoio.
As outlined, Beira was the location most affected, whereas Chimoio also suffered from the
consequences of Cyclone Idai, albeit to a smaller extent. To validate the finding that the firms
located in the most-affected location benefit the most from cash, we substitute our Beira dummy
with a damage index. The damage index measures the extent of damage and destruction a firm
suffered because of the cyclone. It is composed of five different dummies, asking about the damage
of a specific firm asset, i.e. whether the roof, walls, raw material, finished products, and machinery
were fully destroyed or damaged. If all of these assets were destroyed or parts of them damaged,
a firm gets the value of 5 on the index and if none were destroyed or damaged a value of 0.
Appendix Table A6 shows that the cash grants had a stronger impact on income and profit among
firms that suffered stronger damage or destruction. Because the enterprises located in Beira, on
average, report more damage than in Chimoio, our previous results showing that our cash grants
enhanced firm recovery in the most-affected location are confirmed.
5.1 Heterogeneous treatment effects
Next, we look at heterogeneous treatment effects on income across manufacturing industries.
Overall, Table 4 shows that there exist differential effects of the grants by industry. Treated
carpenters stand out as their income increased by 102 per cent compared to the remaining firms.
We do not find any statistically significant effect of the cash grants on tailors, blacksmiths, or food
producers.
One explanation for why the treatment had a positive impact on carpenters might be related to
the demand of their services. Many people lost their homes or parts of them during the cyclone.
Carpenters provide repair services and basic furniture, both of which might have been in high
11demand after the cyclone. As carpenters might have been in high demand, they could make
effective use of the cash grants, which then would lead to positive performance outcomes, while
the other industries might have been less vital in the post-disaster period. The work of tailors, for
example, was probably less requested because most people did not lose or damage their clothes in
the cyclone. Therefore, tailors did not have outstanding returns on the cash grants. Overall, access
to finance might be effective for the recovery of some manufacturing industries but not for all.
Table 4: Treatment effects by manufacturing industry
Income
Carpenters Tailors Blacksmiths Food producers
M X Treatment X 1.023** -0.525 -0.258 -0.487
Industry (0.441) (0.482) (0.442) (0.640)
Post-cyclone -1.334*** -1.575*** -1.581*** -1.605***
period (M) (0.099) (0.092) (0.089) (0.087)
Treatment 0.596** 1.049*** 0.976*** 0.968***
(0.242) (0.242) (0.252) (0.223)
Observations 2,135 2,135 2,135 2,135
Number of firms 427 427 427 427
R2 0.06 0.06 0.06 0.06
Note: we control for firm FE. Robust standard errors in parentheses. Income is logged. *Significance at a 10 per
cent level, **significance at a 5 per cent level, and ***significance at a 1 per cent level.
Source: authors’ calculations based on cyclone data.
5.2 How the grants were spent
In our follow-up survey, we asked the treated firms for what purposes they spent the grant money.
About 97 per cent reported having spent all of the grant money, and a majority (70 per cent)
indicated that the cash was of great help. Figure 4 shows that two-thirds used it for more than one
purpose. About 14 per cent of the enterprises used some part of the money for non-business
purposes such as food and helping family/friends, but at the same time, the remaining part of the
money was used for business goals. Only one firm handed over the whole grant to family/friends.
In ‘other’ purposes, entrepreneurs specified that they paid their employees, paid to transport raw
materials, repaid some debt, or purchased a piece of land. The most common business-related
expense was the purchase of raw materials (63 per cent bought raw materials) followed by the
acquisition of new machinery or tools (41 per cent). In Chimoio, however, enterprises were
significantly more likely to buy new machinery and give some part of the money to family or
friends than in Beira. One reason why the returns on the grants were significantly higher in Beira
might be related to higher returns on raw materials in the cyclone-affected area.
12Figure 4: Types of expenses paid for with the cash grants
Source: authors’ illustration based on cyclone data.
We investigate whether the grants had differential effects depending on how they were spent.
Table 5 illustrates that the grants were particularly effective for firm income when they were used
for the purchase of raw materials, machinery, or ‘other’ purposes. Enterprises that bought some
type of raw material for their economic activity experienced an increase in income by 126 per cent
compared to firms that used the grants for any of the other purposes instead. A rise in income of
88 per cent was the result for business owners who acquired new machinery. Even businesses
spending their money on ‘other’ purposes had an increase in income of 87 per cent compared to
the enterprises that used the money for other goals. In contrast, roof repair or handing over the
money to family/friends did not have statistically significant income effects.
Table 5: Differential effects by spending purpose
Income
Roof repair Raw Machinery Non-business Other
materials purpose:
family/friends
Spending purpose 0.745 1.262*** 0.880*** 0.759 0.865*
XM (0.531) (0.341) (0.298) (0.631) (0.457)
Post-cyclone -1.313*** -1.530*** -1.431*** -1.293*** -1.359***
period (M) (0.130) (0.160) (0.146) (0.126) (0.135)
Observations 605 605 605 605 605
Number of firms 121 121 121 121 121
R2 0.05 0.07 0.06 0.05 0.05
Note: we control for firm FE. Robust standard errors in parentheses. Income is logged. *Significance at a 10 per
cent level, **significance at a 5 per cent level, and ***significance at a 1 per cent level.
Source: authors’ calculations based on cyclone data.
136 Conclusion
This paper investigates whether access to finance after a natural disaster can boost micro-enterprise
recovery. In 2019, we handed out cash grants to randomly selected firms in the manufacturing
sector following Cyclone Idai in central Mozambique. Overall, the grants had a significant and
positive effect on firm income, profit, the likelihood of having the roof repaired, and savings. More
importantly, we find that our treatment had stronger returns in the city of Beira, which was almost
entirely destroyed by Idai, compared to the control city, which was affected to a smaller extent.
Specifically, the grants only had a statistically significant effect on performance measured as
income or profits in Beira but not in Chimoio. Thus, as has been found in a different context after
a different natural disaster (de Mel et al. 2012), our results confirm that cash grants can enhance
firm recovery following disasters. Investigating differences by industry, we find that the grants
were particularly effective for carpenters, showing that the grants may be helpful for some
manufacturing industries but not all. Further, we are the first to illustrate that the grants had the
strongest effect on firms that spent the money on raw materials, new machinery, or other business
purposes relative to enterprises who used the cash to repair their roof or on non-business goals.
Overall, cash grants for firms seem to be an effective type of aid in disaster-ridden areas. As natural
disasters are likely to increase because of anthropogenic climate change, our study’s results are
valuable for policies and development programmes.
References
Barrett, C., and M. Carter (2010). ‘The Power and Pitfalls of Experiments in Development Economics:
Some Non-Random Reflections’. Applied Economic Perspectives and Policy, 32: 515–48.
https://doi.org/10.1093/aepp/ppq023
Bastagli, F., J. Hagen-Zanker, L. Harman, V. Barca, G. Sturge, and T. Schmidt (2019). ‘The Impact of Cash
Transfers: A Review of the Evidence from Low- and Middle-Income Countries’. Journal of Social Policy,
48: 569–94. https://doi.org/10.1017/S0047279418000715
COM (Club of Mozambique) (2019a). ‘Mozambique After Cyclone Idai: “Some People Have Not Eaten in
Weeks”’. Mozambique: COM. Available at: https://clubofmozambique.com/news/mozambique-
after-cyclone-idai-some-people-have-not-eaten-in-weeks/ (accessed 26 October 2020).
COM (2019b). ‘Cyclone Idai was the Deadliest Storm to Strike Mozambique in at Least 3 Decades’.
Mozambique: COM. Available at: https://clubofmozambique.com/news/cyclone-idai-was-the-
deadliest-storm-to-strike-mozambique-in-at-least-3-decades/ (accessed 26 October 2020).
COM (2019c). ‘Mozambique: Beira Residents Lack Water, Power, Food in Aftermath of Cyclone Idai’.
Mozambique: COM. Available at: https://clubofmozambique.com/news/mozambique-beira-
residents-lack-water-power-food-in-aftermath-of-cyclone-idai/ (accessed 26 October 2020).
COM (2019d). ‘Companies in Central Mozambique Face US$145 Million Losses from Cyclone Idai’.
Mozambique: COM. Available at: https://clubofmozambique.com/news/companies-in-central-
mozambique-face-us145-million-losses-from-cyclone-idai/ (accessed 26 October 2020).
de Mel, S.D., D. McKenzie, and C. Woodruff (2012). ‘Enterprise Recovery Following Natural Disasters’.
The Economic Journal, 122: 64–91. https://doi.org/10.1111/j.1468-0297.2011.02475.x
Doocy, S., and H. Tappis (2017). ‘Cash-Based Approaches in Humanitarian Emergencies: A Systematic
Review.’ Campbell Systematic Reviews, 13(1). https://doi.org/10.4073/csr.2017.17
Duflo, E., R. Glennerster, and M. Kremer (2006). Using Randomization in Development Economics Research: A
Toolkit. Working Paper 333. Cambridge, MA: NBER. https://doi.org/10.3386/t0333
14EM-DAT (2020). ‘The International Disaster Database.’ Brussels: Centre for Research on the
Epidemiology of Disasters. Available at: https://www.emdat.be/ (accessed 12 May 2021).
Gentilini, U. (2016). The Other Side of the Coin: The Comparative Evidence of Cash and In-Kind Transfers in
Humanitarian Situations. World Bank Studies. Washington, DC: World Bank.
https://doi.org/10.1596/978-1-4648-0910-1
GOM (2019). Diploma Ministerial No. 42/2019 de 7 de Maio. Mozambican Government Gazette. I Série,
Número 87, 7 de Maio de 2019. Maputo, Mozambique. Available at:
https://www.dlapiperafrica.com/export/sites/africa/mozambique/insights/legislation-
series/employment/downloads/Salario_Minimo_2019.pdf_2063069299.pdf (accessed 12 May 2021).
IFRC (2020). ‘Mozambique Cyclone “90 Per Cent” of Beira and Surrounds Damaged or Destroyed.’
Geneva: International Federation of Red Cross and Red Crescent Societies. Available at:
https://media.ifrc.org/ifrc/press-release/mozambique-cyclone-90-per-cent-beira-surrounds-
damaged-destroyed/ (accessed 12 May 2021).
IIM (2013). 2012 Survey of Mozambican Manufacturing Firms. Mozambique: Ministry of Planning and
Development, Republic of Mozambique. Available at:
https://web.econ.ku.dk/ftarp/Publications/Docs/Reports/survey_of_mozambican_manufacturing
_firms_iim2012.pdf (accessed 12 May 2021).
IIM (2018). Survey of Mozambican Manufacturing Firms 2017. Descriptive Report. Helsinki: UNU-WIDER,
University of Copenhagen, and University Eduardo Mondlane. Available at:
https://www.wider.unu.edu/publication/survey-mozambican-manufacturing-firms-2017 (accessed
26 October 2020).
Jolevski, F., and G. Ayana Aga (2019). ‘Shedding Light on the Informal Economy: A Different
Methodology and New Data.’ World Bank Blogs. Washington, DC: World Bank. Available at:
https://blogs.worldbank.org/developmenttalk/shedding-light-informal-economy-different-
methodology-and-new-data (accessed 12 May 2021).
Kemp, H. (2017). ‘The Survival of Small Businesses in Northeastern Florida After a Natural Disaster’.
Management Science. Available at: https://www.semanticscholar.org/paper/The-Survival-of-Small-
Businesses-in-Northeastern-a-Kemp/5055f55337d8c02ab314e7fa03ce188472750ca1 (accessed 26
October 2020).
Mansur, A., J. Doyle, and O. Ivaschenko (2018). Cash Transfers for Disaster Response: Lessons from Tropical
Cyclone Winston. SSRN Scholarly Paper No. ID 3143459. Rochester NY: Social Science Research
Network. https://doi.org/10.2139/ssrn.3143459
Mendoza, R.U., A. Lau, and M.T.Y. Castillejos (2018). ‘Can SMEs Survive Natural Disasters? Eva Marie
Arts and Crafts Versus Typhoon Yolanda’. International Journal of Disaster Risk Reduction, 31: 938–52.
https://doi.org//10.1016/j.ijdrr.2018.08.004
NOAA (2020). ‘What is the Difference Between a Hurricane and a Typhoon?’ Blog post. Washington, DC:
National Oceanic and Atmospheric Administration, US Department of Commerce. Available at:
https://oceanservice.noaa.gov/facts/cyclone.html (accessed 12 May 2021).
Page, J., and M. Söderbom (2015). ‘Is Small Beautiful? Small Enterprise, Aid and Employment in Africa’.
African Development Review, 27: 44–55. https://doi.org//10.1111/1467-8268.12138
Peduzzi, P., B. Chatenoux, H. Dao, A. De Bono, C. Herold, J. Kossin, F. Mouton, and O. Nordbeck (2012).
‘Global Trends in Tropical Cyclone Risk’. Nature Climate Change, 2: 289–94.
https://doi.org//10.1038/nclimate1410
Pega, F., S.Y. Liu, S. Walter, R. Pabayo, R. Saith, and S.K. Lhachimi (2017). ‘Unconditional Cash Transfers
for Reducing Poverty and Vulnerabilities: Effect on Use of Health Services and Health Outcomes in
Low‐ and Middle‐Income Countries’. Cochrane Database of Systematic Reviews, 11.
https://doi.org//10.1002/14651858.CD011135.pub2
Reyes, C., J.R. Albert, and C.C. Reyes (2018). Lessons on Providing Cash Transfers to Disaster Victims: A Case
Study of UNICEF’s Unconditional Cash Transfer Program for Super Typhoon Yolanda Victims. Discussion
15Paper Series No. 2018-04. Makati, Philippines: Philippine Institute for Development Studies. Available
at: https://hdl.handle.net/11540/8171 (accessed 26 October 2020).
SARTCWG (2019). Humanitarian Cash Coordination in the Cyclone Idai Response. After-Action Review by the
Southern African Technical Cash Working Group September 2019. Available at:
https://www.alnap.org/system/files/content/resource/files/main/Humanitarian%20cash%20coor
dination%20in%20the%20Cyclone%20Idai%20response%20SARTCWG%20after%20action%20re
port%20Final.pdf (accessed 12 May 2021).
Seawright, J. (2016). Multi-Method Social Science: Combining Qualitative and Quantitative Tools. Cambridge, UK:
Cambridge University Press. https://doi.org/10.1017/CBO9781316160831
Sohnesen, T., P. Fisker, and D. Malmgren-Hansen (2020). ‘Using Satellite Data to Guide Urban Poverty
Reduction’. Remote Sensing, 12(2409). https://doi.org/10.3390/rs12152409
Szirmai, A. (2009). Is Manufacturing Still the Main Engine of Growth in Developing Countries? Helsinki: UNU-
WIDER. Available at: https://www.wider.unu.edu/publication/manufacturing-still-main-engine-
growth-developing-countries (accessed 26 October 2020).
Thompson, S.K. (1990). ‘Adaptive Cluster Sampling’. Journal of the American Statistical Association, 85(412):
1050–9. https://doi.org/10.1080/01621459.1990.10474975
Thompson, S.K. (1991). ‘Stratified Adaptive Cluster Sampling.’ Biometrika, 78(2): 389–97.
https://doi.org/10.1093/biomet/78.2.389
UNSD (2008). International Standard Industrial Classification of All Economic Activities (ISIC). UN Statistical
Papers, Series M No. 4/ Rev. 4. New York: United Nations. Available at:
https://unstats.un.org/unsd/classifications/Econ/Download/In%20Text/ISIC_Rev_4_publicatio
n_English.pdf (accessed 12 May 2021).
Walsh, K.J.E., S.J. Camargo, T.R. Knutson, J. Kossin, T.-C. Lee, H. Murakami, and C. Patricola (2019).
‘Tropical Cyclones and Climate Change’. Tropical Cyclone Research and Review, 8: 240–50.
https://doi.org//10.1016/j.tcrr.2020.01.004
Webb, G.R., K.J. Tierney, and J.M. Dahlhamer (2002). ‘Predicting Long-Term Business Recovery from
Disaster: A Comparison of the Loma Prieta Earthquake and Hurricane Andrew’. Global Environmental
Change Part B: Environmental Hazards, 4: 45–58. https://doi.org//10.3763/ehaz.2002.0405
WHO (2019a). Tropical Cyclone Idai Mozambique Situation Report 1. Mozambique: WHO. Available at:
https://www.afro.who.int/publications/tropical-cyclone-idai-mozambique-situation-report-1
(accessed 26 October 2020).
WHO (2019b). Tropical Cyclones Idai and Kenneth Mozambique Situation Report 6. Mozambique: WHO. Available
at: https://www.afro.who.int/publications/tropical-cyclones-idai-and-kenneth-mozambique-
situation-report-6 (accessed 26 October 2020).
World Bank (2007). Helping South Asia Cope with Natural Disasters: The Role of Social Protection. South Asia:
human development sector discussion paper series, No. 20. Washington, DC: World Bank. Available
at: https://hdl.handle.net/10986/18014 (accessed 26 October 2020).
16Appendix
Table A1: Summary statistics of IIM 2017 data
(1) (2) (3) (4) (5)
Beira Chimoio Beira and Remaining Maputo
Chimoio provinces
combined
Income 1,002,394 874,073 953,596 5,363,763 6,550,823
Firm size 3.19 3.69 3.38 2.93* 3.05
Secondary degree 0.52 0.65 0.57 0.56 0.58
Female 0.08 0.19* 0.12 0.07* 0.05*
Informal 0.82 0.85 0.83 0.66*** 0.74*
Blacksmith 0.11 0.22* 0.15 0.22* 0.21
Tailor 0.09 0.06 0.08 0.17** 0.22***
Observations 88 52 142 236 91
Note: the combined provinces in column 4 are Maputo province, Gaza, Nampula, and Tete. Stars represent the
significance level of two-sample t-tests. In column 2, Beira is compared with Chimoio. Column 4 compares the
remaining provinces with the combined sample of Beira and Chimoio. Column 5 compares the city of Maputo with
the combined sample of Beira and Chimoio. *Significance at a 10 per cent level, **significance at a 5 per cent
level, and ***significance at a 1 per cent level.
Source: authors’ calculations based on IIM 2017 data (IIM 2018).
Figure A1: Parallel trends analysis, log income over time
13
12
11
10
9
8
7
2011 2012 2013 2014 2015 2016 2017 2018 Feb-19 Apr-19 Sep-19
Beira Chimoio
Source: authors’ illustration based on IIM 2017 data (IIM 2018) and cyclone data.
17Table A2: Log income by year and location
Beira Chimoio Observations
2011 12.2 12.47 25
2015 12.59 12.96 66
2016 12.2 12.63 65
Feb 2019 12.39 12.39 427
Apr 2019 7.26 10.64 427
Sep 2019 12.07 12.12 427
Note: means of log income; the samples only cover micro-sized enterprises. The observations for 2011–16 are
much fewer than in Table A1 because many enterprises did not report financial information. The monthly data
from 2019 were multiplied by 12 to make them comparable to the values of the previous years (2011–16).
Source: authors’ calculations based on IIM 2012 and 2017 data (IIM 2013, 2018) and cyclone data.
Table A3: Summary statistics by treatment group and city
Whole Treated Control Beira Chimoio
sample
Income before Idai (Feb’19) 37,418 32,931 39,192 39,225 35,586
Income after Idai (Apr’19) 17,207 16,685 17,414 14,316 20,139
Income 6 months after Idai (Sep’19) 29,790 28,071 30,470 31,812 27,740
Income 1 year after Idai (Feb’20) 26,259 28,642 25,316 27,114 25,391
Savings before Idai (Feb’19) 3,705 2,311 4,256** 4,021 3,384
Savings after Idai (Apr’19) 1,034 581 1,214 810 1,261
Savings 6 months after Idai (Sep’19) 2,510 2,119 2,665 2,572 2,448
Savings 1 year after Idai (Feb’20) 2,993 3,052 2,969 3,043 2,943
Firms without employees 0.08 0.11 0.08 0.09 0.08
Firm size before Idai (Feb’19) 3.38 3.03 3.51* 3.53 3.23
Firm size after Idai (Apr’19) 2.93 2.60 3.06* 2.95 2.91
Firm size 6 months after Idai (Sep’19) 3.10 2.83 3.20 3.18 3.01
Firm size 1 year after Idai (Feb’20) 3.22 2.91 3.35 3.22 3.23
Roof damaged/destroyed 0.64 0.66 0.64 0.86 0.41
Roof repaired 6 months after Idai 0.78 0.82 0.76 0.79 0.75
Primary education 0.38 0.44 0.36 0.45 0.31***
Secondary education or higher 0.29 0.23 0.31 0.29 0.29
University degree 0.01 0.02 0.01 0.01 0.01
Business-related education 0.26 0.25 0.26 0.28 0.23
Informal 0.77 0.81 0.76 0.77 0.77
Female 0.10 0.06 0.11 0.12 0.08
Owner age 40.25 40.88 40.83 42.59 37.88***
Electricity access 0.79 0.80 0.78 0.80 0.78
Internet access 0.05 0.04 0.06 0.06 0.04
Smartphone owner 0.38 0.34 0.40 0.36 0.41
Bank loan 0.04 0.02 0.05 0.06 0.02**
Carpenter 0.35 0.31 0.37 0.39 0.32
Tailor 0.23 0.24 0.22 0.27 0.18**
Blacksmith 0.15 0.24 0.12*** 0.13 0.18*
Food producer 0.10 0.08 0.10 0.06 0.14***
Observations 427 121 306 215 212
Note: *significance at a 10 per cent level, **significance at a 5 per cent level, and ***significance at a 1 per cent
level.
Source: authors’ calculations based on cyclone data.
18You can also read