INVESTOR PRESENTATION - BlackBerry
←
→
Page content transcription
If your browser does not render page correctly, please read the page content below

INVESTOR PRESENTATION Q1FY2022
SAFE HARBOR   STATEMENT
 Safe Harbor Statement
Some of the statements made within this presentation constitute forward-looking statements and are made pursuant to the safe harbor
provisions of applicable U.S. and Canadian securities laws.

Forward-looking statements are indicated by using words such as expect, will, should, model, intend, believe and similar expressions.
Forward-looking statements are based on estimates and assumptions made by the company in light of its experience and its perception of
historical trends, current conditions and expected future developments as well as other factors that the company believes are relevant.

Many factors could cause the company's actual results or performance to differ materially from those expressed or implied by the forward-
looking statements, including the risk factors that are discussed in the company's annual report on Form 10-K and in our MD&A.

You should not place undue reliance on the company's forward-looking statements. The company has no intention and undertakes no
obligation to update or revise any forward-looking statements, except as required by law.

This presentation includes certain non-GAAP measures. We believe that these non-GAAP measures, which may be defined differently by
other companies, explain our results of operations in a manner that allows for a more complete understanding of the underlying trends in our
business. However, these measures should not be viewed as a substitute for those determined in accordance with GAAP. For a
reconciliation between the non-GAAP measures used in this presentation and our GAAP results, please see our Q1 Fiscal 2022 earnings
press release and supplement available through our website and on EDGAR and SEDAR.                     2

                                                                                                                © 2020 BlackBerry. All Rights Reserved.   2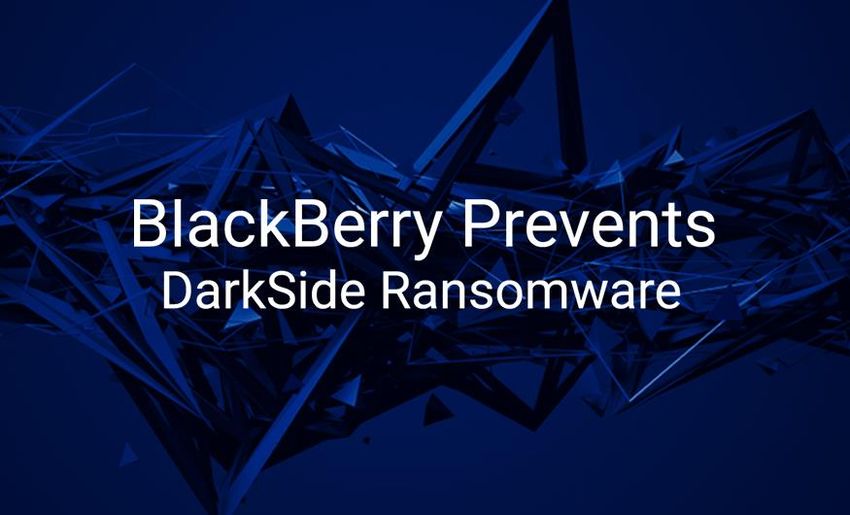
At the Heart of the Smart City
         IMAGINE T HE POSSIBIL IT IES

                                        © 2021 BlackBerry. All Rights Reserved.   |   3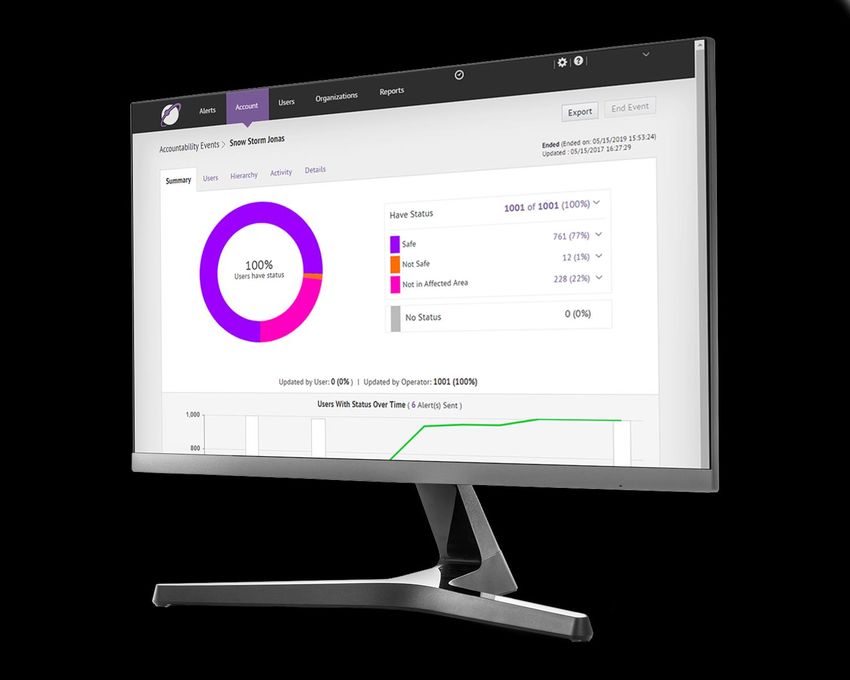
Q1 FY22 Financial Summary

                            %                      $                                                  $
    $174M                  66%                ($0.05)                                        ($6M)
      Revenue           Non-GAAP               Non-GAAP                                       Adjusted
                       Gross Margin1       Earnings per Share1                                EBITDA1,2

        $                                                                                            %
    $769M                 ~90%                $490M                                               94%
    Total ending      Recurring Software     QNX Royalty                              Dollar-Based Net
 Cash & Investments    Product Revenue2    Revenue Backlog2                           Retention Rate2

                                                          1. See appendix for detail and reconciliation of non-GAAP measures to US GAAP
                                                                                             2. See Form 10-K for definitions of key metrics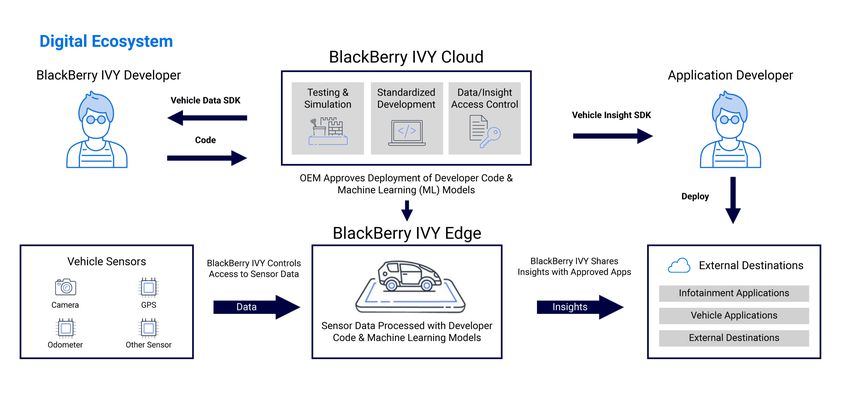
FY22 Revenue Reporting
                    SOFTWARE & SERVICES                               LICENSING & OTHER

              IoT                      CYBER SECURITY
                                                                          IP Patent Licensing
                                                                          Portfolio of 38,000+ patents

   Safety-Critical Real-Time            Unified Endpoint Security +
   Operating System                     Unified Endpoint Management       Technology Licensing
                                                                          (e.g. mobility licensing
                                                                          arrangements)
 BlackBerry IVY™
   Intelligent Vehicle Data Platform    Critical Event Management         Service Access Fees
                                                                          Legacy revenue from hardware
                                                                          business
   Cryptography & Device Security
                                        Secure Voice

   Asset Tracking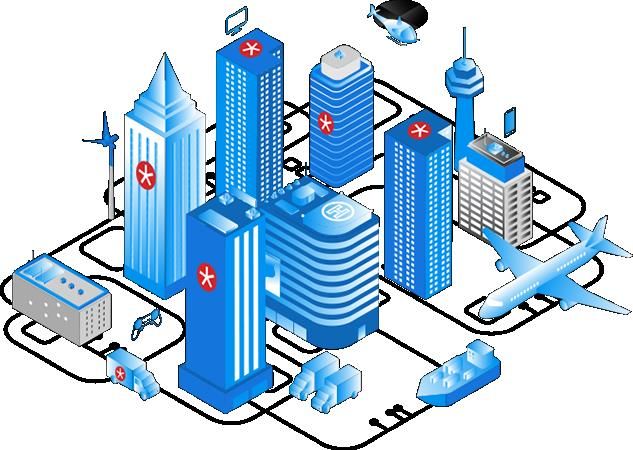
Q1 FY22 Financial Summary
                                        IoT                                                                                              CYBER SECURITY
Segment Financials            Q1 FY21 Q2 FY21 Q3 FY21 Q4 FY21         FY21          Q1 FY22               Segment Financials                        Q1 FY21 Q2 FY21 Q3 FY21 Q4 FY21                     FY21         Q1 FY22
 Segment revenue ($M)              29      31         32       38          130              43              Segment revenue ($M)                           119         120         130          122         491             107
 Segment gross margin ($M)         23      25         26       33          107              36              Segment gross margin ($M)                       72           74          77          76         299              61
 Segment gross margin %          79%      81%       81%      87%          82%            84%                Segment gross margin %                        61%         62%          59%         62%         61%             57%
Key Metrics                   Q1 FY21 Q2 FY21 Q3 FY21 Q4 FY21                       Q1 FY22               Key Metrics                               Q1 FY21 Q2 FY21 Q3 FY21 Q4 FY21                                  Q1 FY22
                1                                                                                                                        1
ARR: IoT ($M)                     103      92         88       84                           86            ARR: Cyber Security ($M)                         370         367         365          369                         364
QNX Royalty Revenue Backlog                                                                               DBNRR: Cyber Security (%)1                     101%        100%          95%         95%                         94%
                                  450                                                     490
($M)

                                                                    LICENSING & OTHER
                                              Segment Financials                    Q1 FY21 Q2 FY21 Q3 FY21 Q4 FY21                    FY21         Q1 FY22
                                                Segment revenue ($M)                        58        108           56          50           272            24
                                                Segment gross margin ($M)                   50        101           47          44           242            18
                                                Segment gross margin %                   86%          94%         84%         88%            89%          75%

                                                              1.    In Q1 FY22, the Company discontinued its use of software deferred revenue acquired in its key metrics as the Company no longer reports non-GAAP revenue.
                                                                         For purposes of comparability, the Company’s key metrics for the four quarters of FY21 have been updated to conform to the current year’s presentation.
Q1 FY22 Achievements
  Volvo Group selects         BlackBerry QNX            BlackBerry’s IVY        BlackBerry announces
  BlackBerry® QNX®          is now embedded in          Innovation Fund       BlackBerry® Optics 3.0, its
 operating system and         over 195 million      makes first investment      next-generation cloud-
hypervisor as foundation    vehicles, increasing     in Electra Vehicles, a   based endpoint detection
 for its ‘Volvo Dynamic    from over 175 million     start-up that will use      and response (EDR)
   Software Platform’,        vehicles last year     data from BlackBerry              solution
to meet the needs of the                               IVY in its AI-driven
       ‘whole truck’                                 platform to optimize
                                                     battery performance

 WM Motor, a Chinese        BlackBerry launches     BlackBerry’s AI-driven,   BlackBerry further builds
   electric carmaker,          BlackBerry IVY           prevention-first       out Extended Detection
chooses BlackBerry QNX      Advisory Council to       BlackBerry® Protect       and Response (XDR)
  to power its W6 all-         drive use case       product demonstrated       strategy with launch of
      electric SUV            generation. Initial   to block both DarkSide    BlackBerry® Gateway, AI-
                              members include       and Conti ransomware,      empowered Zero Trust
                           Geico, Cerence, HERE,      even using the 2015     Network Access (ZTNA)
                             Telus and Amazon        version of the product            product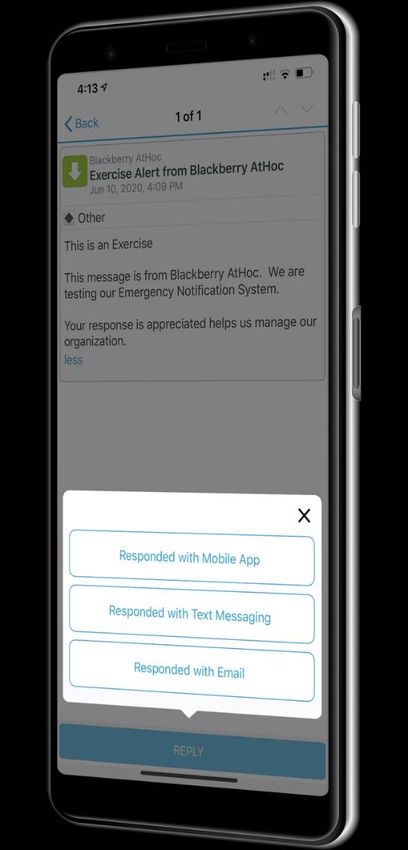
Investment Highlights
AI in EPP & EDR         BlackBerry
Our Journey                                                IVY™

From Wireless Security
to Intelligent
Cybersecurity
                          UEM

                                                  UES

                        App
            Containerization
                                                                     QNX® Secure
                                                                     OS in Autos
                                   Smartphone

                    NOC

                                                                Mobile Device
                                                                Management
BlackBerry: An Internet of Things Market Leader

   500M+                    195M+                    23 / 25                   38K+
 Endpoints protected   Vehicles protected by QNX   Top EV Automakers    Patents and applications

   AI/ML                    18/G20                     45%                        #1
                                                    Fortune 100           Frost & Sullivan
  Industry-leading     Governments connected &     Customers across       BlackBerry IVY named a
 AI/ML-driven Cyber           protected                industries      leader in Auto & Smart Cities
     software
BlackBerry Customers and Partners
TOP-TIER CUSTOMERS & PARTNERS1
Notes: 1. As at Q1 FY22.
2,200+ Partners Across Our EcosystemOpportunities for Long-Term Growth
We have the right strategy, the right technology and are playing in the right markets.
Accelerate Growth • Investing in growth • Sustainable revenue
Opportunities • Opportunities to lead in growth
large markets
• Innovating and investing • Long-term value
Capture the Future in future categories creation
• Recurring revenue growth • Increased earnings power
Scalable Financial • Greater cash flow
• Efficient operating models
Model generationTotal Addressable Market (TAM)
Large, growing market opportunities
IoT
~$45bn
IoT 2025:
~$15bn
2021:
$89bn1
2020: $45bn1 Cyber
~$44bn
$38bn
Cyber
~$30bn
1. Sources include IDC, Gartner, McKinsey & Company, Data Bridge Market Research, VDC Research and Berg InsightTimeless Model Goals
FY21 actuals Goals
~90% ~90%
73% ~80-85%
8% ~20-25%
16% ~25-30%
1. See form 10-K for detail and reconciliation of non-GAAP measures to U.S. GAAP. 2. See Form 10-K for definitions of key metrics.IoT
Safety-Certified, Secure Embedded OS
to Secure the ‘Edge’
  SMART HOME                                         SMART CAR                                            SMART CITY

                                                   Artificial Intelligence‒based Security

                                                                                  Complex Domain
                                           Telematics
                                                                                    Controllers

                             Acoustics
                                                                                               Secure
                                                                                              Gateways
                  Infotainment

                    V2X

 CLOUD SERVICES    Control
                  Systems
                                                                         Instrument
 • OTA                                                                     Clusters
 • Jarvis                        Digital
                                                                                            Traditional
                                 Cockpit
                                                        ADAS,
                                                     Active Safety                          Growth
BlackBerry QNX
AUTOMOTIVE SECULAR TRENDS IMPACT
• Cars are becoming ‘smarter.’
• ECUs are consolidating to higher-
powered chips, where QNX operates.
Autonomous Digitization • An increasing portion of new cars have
(Levels 2‒5) (Via connectivity) a significant software component.
• Significant growth in safety-critical
systems such as ADAS, Digital
cockpits and Gateways.
• Commoditization of hardware and
ECU consolidation emergence of software are key
Electrification
(Higher powered chips) (New everything) differentiators for Automakers.
• An increased need for cybersecurity.IoT BlackBerry IVY
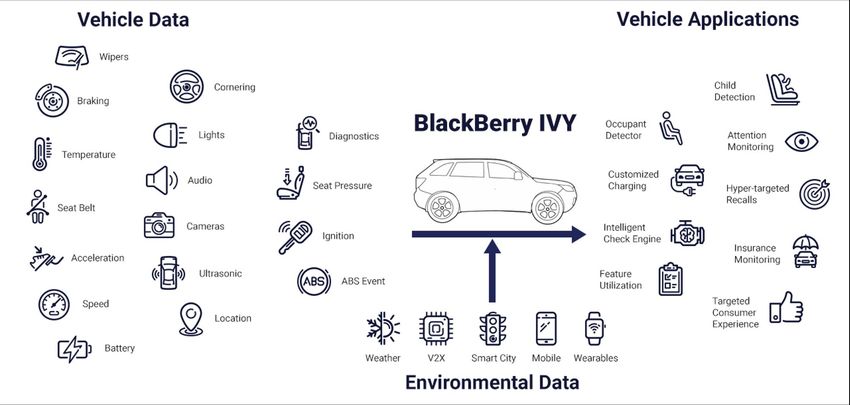
BlackBerry IVY - Opportunity to harness data in the car
Diverse sensors generate huge amounts of data in unique formats
BlackBerry IVY’s Digital Ecosystem
Enabling a cross-brand, cross-model app & services ecosystem
BlackBerry IVY’s Addressable Market
Access to standardized, intelligent insights leads to endless possibilities

                                                                              Automakers / Suppliers

                                                                                  App Developers

                                                                                    Consumer Services

                                                                                     Smart Cities

                                                                                   EV charging providers

                                                                                Insurance Companies

                                                                         Vehicle maintenance providers
BlackBerry IVY – Strategic Alliance for Co-Development Why did we co-invest in this partnership to jointly build a single solution? • Trusted leader in automotive safety and • Leading global cloud provider with a culture security of innovation • Deep knowledge of embedded automotive • Unmatched machine learning expertise and software systems IoT capabilities • Exceptional track record of delivery, • Proven builder of successful developer integration, and support ecosystems
Cyber Security
Spark Suite
AI-powered, prevention-first security that works smarter, not harder
BlackBerry’s Prevention-first approach

 Current version of BlackBerry® Protect artificial intelligence (AI) based endpoint protection platform
 (EPP) prevented all known variants of DarkSide Ransomware

 2015 version prevented many known variants
Why Unify Endpoint Security
& Endpoint Management?

     TOO MANY VENDORS                       MOBILE IS VULNERABLE                                ENDPOINTS ARE CHANGING

70%                                      50%                                                   40%
of organizations will have               of organizations will have                            of workers use wearables
a unified console                        mobile threat defense                                 as primary devices

By 2024, the adoption of Windows 10,     By 2023, 50% of organizations will have               By 2023, 40% of frontline workers will use
Google Chrome OS and Apple macOS will    mobile threat defense (MTD) in place,                 wearables as their primary computing
drive the need for a combined endpoint   growing from less than 20% of                         devices, an increase from less than 10%
management console in more than 70%      organizations in 2020.                                in 2019.
of organizations.

                                                                        *Gartner Report, "Predicts 2020: Mobile and Endpoint Technologies," Feb. 3, 2020
What is Zero Trust?
AI SECURITY
Behavioral Constant
Analytics Monitoring
HUMAN MACHINE
Continuous Adaptive
Authentication ZERO TRUST Policy
The components work in concert as a foundation for a Zero Trust enterprise security architecture.Cyber Security
Critical Event Management

         KEEP YOUR PEOPLE SAFE                                    REDUCE IT DOWNTIME

How do you communicate to your staff,                  In the event of a system outage, can you
contractors, visitors and students quickly if          automatically communicate and coordinate a
there is an incident?                                  response and short-term workarounds to reduce
                                                       downtime?

 GET CLEAR, TIME-CRITICAL FEEDBACK                              MINIMIZE DISRUPTIONS

How do you collate feedback from your people as        What are the threats you can anticipate and how
they are responding to a critical event, so you have   do you keep track of changing threat levels from
the full picture?                                      weather and natural events, cyberattacks and local
                                                       authority warnings?
Critical Event Management • Notify anyone, anywhere, on any device. • Gather critical information from your people to achieve situational awareness. • Gain real-time visibility into your personnel status and location. • Communicate and collaborate with other organizations.
Critical Event Management
         END-TO-END CRISIS MANAGEMENT

         Plan             Respond             Collaborate

Alert           Collect             Account           Connect

Secure          Unified             Mobile             Flexible
Cyber Security
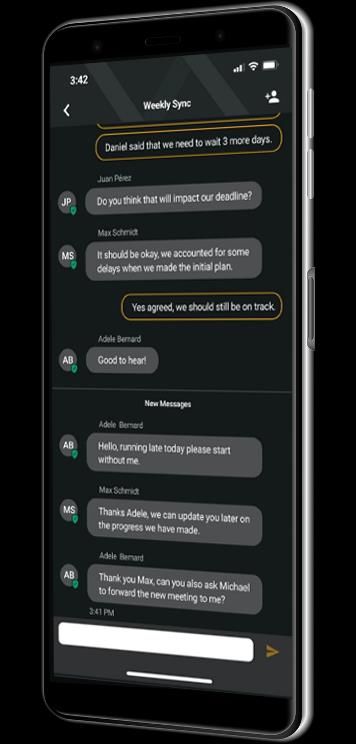
BlackBerry SecuSUITE
Secure Voice & Messaging                       Sovereign Network
Built to meet national security standards;     Uses a closed virtual network, so you will
offering end-to-end security for voice calls   never be bothered by adware or spam
and messages on standard iOS and               calls.
Android devices.
                                               Control of Metadata
Encrypted Communication                        What is collected, who has access.
Protects the content of your
communication with strong encryption.          Security Certifications
                                               Regularly undergoes rigorous certification
Contact Verification                           reviews to meet the strictest standards;
Continually confirms the identities of your    its proven technology is trusted by key
contacts and their devices, so you can         governments around the world.
talk confidently with protection from
identity spoofing.
BlackBerry SecuSUITE
EASY & INTUITIVE TO USE
The app is easy and intuitive to use and offers
high-quality voice on both Wi-Fi and cellular data.
ENTERPRISE INTEGRATION
It can also be easily integrated into your
enterprise telephony system, making it the perfect
addition to a secure working environment.Appendix (Q1 FY22 Financials)
GAAP Income Statement ($M)
                                                              Q1-21           Q2-21           Q3-21           Q4-21      FY 2021           Q1-22

      Cyber Security                                      $       119     $       120     $       130     $       122    $      491    $       107
       IoT                                                          29              31              32              38          130              43
   Software & Services                                            148             151             162             160           621            150
   Licensing and Other                                              58            108               56              50          272              24
   Total Revenue                                                  206             259             218             210           893            174
   Cost of Sales                                                    63              60              69              58          250              60
   GAAP Gross Margin                                              143             199             149             152           643            114
     Research and Development                                       57              57              53              48          215              57
     Selling, Marketing and Administration                          90              79              83              92          344              73
     Amortization                                                   46              46              45              45          182              46
     Impairment of Long-lived Assets                              -                 21            -                 22           43            -
     Impairment of Goodwill                                       594             -               -               -             594            -
     Debentures Fair Value Adjustment                                1              18              95            258           372              (4)
     Total Operating Expenses                                     788             221             276             465         1,750            172
   GAAP Operating Loss                                           (645)            (22)           (127)           (313)       (1,107)           (58)
     Investment Income (Loss), Net                                -                 (5)             (1)           -              (6)             (2)
   Loss before Income Taxes                                      (645)            (27)           (128)           (313)       (1,113)           (60)
     Provision for (recovery of) income taxes                       (9)             (4)              2               2           (9)              2
   GAAP Net Loss                                          $      (636)    $       (23)    $      (130)    $      (315)   $   (1,104)   $       (62)
     Basic Loss per Share                                 $     (1.14)    $     (0.04)    $     (0.23)    $     (0.56)   $    (1.97)   $     (0.11)
     Diluted Loss per Share                               $     (1.14)    $     (0.04)    $     (0.23)    $     (0.56)   $    (1.97)   $     (0.11)
   Weighted-average number of common shares outstanding
   (000s)
     Basic                                                    557,839         558,882         562,443         566,089        561,305       567,358
     Diluted                                                  557,839         558,882         562,443         566,089        561,305       567,358
Non-GAAP Reconciliation ($M)
Non-GAAP Adjustments (Pre-Tax and After-Tax) Q1-21 Q2-21 Q3-21 Q4-21 FY 2021 Q1-22
Debentures Fair Value Adjustment 1 18 95 258 372 (4)
Restructuring Charges 1 1 - - 2 -
Stock Compensation Expense 14 9 12 17 52 7
Acquired Intangible Amortization 33 32 32 32 129 32
Goodwill Impairment Charge 594 - - - 594 -
LLA Impairment Charge - 21 - 22 43 -
Total Non-GAAP Adjustment (Pre-Tax and After-Tax) $ 643 $ 81 $ 139 $ 329 $ 1,192 $ 35
GAAP to non-GAAP Gross Margin Q1-21 Q2-21 Q3-21 Q4-21 FY 2021 Q1-22
GAAP Revenue $ 206 $ 259 $ 218 $ 210 $ 893 $ 174
GAAP Cost of Sales 63 60 69 58 250 60
Non-GAAP Adjustments to Cost of Sales (2) (1) (1) (1) (5) (1)
Non-GAAP Gross Margin $ 145 $ 200 $ 150 $ 153 $ 648 $ 115
Non-GAAP Gross Margin % 70% 77% 69% 73% 73% 66%Non-GAAP Reconciliation ($M) (Cont.)
Adjusted EBITDA Q1-21 Q2-21 Q3-21 Q4-21 FY 2021 Q1-22
GAAP Operating Loss $ (645) $ (22) $ (127) $ (313) $ (1,107) $ (58)
Non-GAAP Adjustments to Operating Loss 643 81 139 329 1,192 35
Non-GAAP Operating Income (Loss) (2) 59 12 16 85 (23)
Amortization 50 50 49 49 198 49
Acquired Amortization Intangibles (33) (32) (32) (32) (129) (32)
Adjusted EBITDA $ 15 $ 77 $ 29 $ 33 $ 154 $ (6)
Reconciliation from GAAP Net Loss to Non-GAAP Net
Income and Non-GAAP Earnings per Share Q1-21 Q2-21 Q3-21 Q4-21 FY 2021 Q1-22
GAAP Net Loss $ (636) $ (23) $ (130) $ (315) $ (1,104) $ (62)
Total Non-GAAP Adjustment (After-Tax) 643 81 139 329 1,192 35
Non-GAAP Net Income (Loss) 7 58 9 14 88 (27)
Non-GAAP Basic Earnings (Loss) per Share $ 0.01 $ 0.10 $ 0.02 $ 0.02 $ 0.16 $ (0.05)
Shares outstanding for Non-GAAP income per
share reconciliation ('000) 557,839 558,882 562,443 566,089 561,305 567,358
Non-GAAP Revenue, non-GAAP Gross Margin, non-GAAP Operating Income (Loss), non-GAAP Net Income (Loss), Adjusted EBITDA, and non-GAAP Earnings (Loss) Per Share do not have a standardized
meaning prescribed by GAAP and thus are not comparable to similarly titled measures presented by other issuers. The Company believes that the presentation of these non-GAAP measures enables the Company
and its shareholders to better assess the Company's operating results relative to its operating results in prior periods and improves the comparability of the information presented. This non-GAAP information should
not be considered as a substitute for, or superior to, measures of financial performance prepared in accordance with GAAP. You are encouraged to review the Company's filings on SEDAR and EDGAR. The
company makes no commitment to update the information above subsequently.Amortization And Reconciliation Details ($M)
Restructuring Charges Details (Pre-Tax) Q1-21 Q2-21 Q3-21 Q4-21 FY 2021 Q1-22
Cost of Sales $ - $ - $ - $ - $ - $ -
Selling, Marketing and Administration 1 1 - - 2 -
Total Restructuring Charges $ 1 $ 1 $ - $ - $ 2 $ -
Amortization of Intangibles and PP&E Details Q1-21 Q2-21 Q3-21 Q4-21 FY 2021 Q1-22
Cost of Sales Amortization
Property, Plant and Equipment $ 1 $ 1 $ 1 $ 1 $ 4 $ 1
Intangibles Assets 3 3 3 3 12 2
Total in Cost of Sales 4 4 4 4 16 3
Operating Expenses Amortization
Property, Plant and Equipment $ 4 $ 5 $ 4 $ 4 $ 17 $ 3
Intangibles Assets 42 41 41 41 165 43
Total in Operating Expenses Amortization 46 46 45 45 182 46
Total Amortization
Property, Plant and Equipment $ 5 $ 6 $ 5 $ 5 $ 21 $ 4
Intangibles Assets 45 44 44 44 177 45
Total Amortization $ 50 $ 50 $ 49 $ 49 $ 198 $ 49
The information above is supplied to provide meaningful supplemental information regarding the Company's operating results because such information excludes amounts that are not necessarily related to its
operating results. The Company believes that the presentation of these non-GAAP measures enables the Company and its shareholders to better assess the Company's operating results relative to its operating
results in prior periods and improves the comparability of the information presented. This non-GAAP information should not be considered as a substitute for, or superior to, measures of financial performance prepared
in accordance with GAAP. You are encouraged to review the Company's filings on SEDAR and EDGAR. The company makes no commitment to update the information above subsequently.investorinfo@blackberry.com # B L A C K B E R R Y T R U S T | # S E C U R I T Y | # P R I V A C Y | # C O N T R O L
You can also read