Gaylord Entertainment Company - Presentation to Morgan Keegan, Inc. September 30, 2003 Memphis, Tennessee - Media Corporate IR Net

Page created by Kelly Cunningham
 
CONTINUE READING
Gaylord Entertainment Company - Presentation to Morgan Keegan, Inc. September 30, 2003 Memphis, Tennessee - Media Corporate IR Net
Gaylord Entertainment Company
           Presentation to Morgan Keegan, Inc.
    September 30, 2003 ♦ Memphis, Tennessee

                                        1
Gaylord Entertainment Company - Presentation to Morgan Keegan, Inc. September 30, 2003 Memphis, Tennessee - Media Corporate IR Net
The information contained in this slide presentation is summary information that is
intended to be considered in the context of SEC filings and other public
announcements made by Gaylord Entertainment (the "Company"), by press release
or otherwise, from time to time. The Company undertakes no duty or obligation to
publicly update or revise the information contained in this slide presentation,
although it may do so from time to time as management believes is warranted. Any
such updating may be made through the filing of reports or documents with the SEC,
through press releases or through other public disclosure.

This slide presentation contains statements as to the Company’s beliefs and
expectations of the outcome of future events that are forward-looking statements as
defined in the Private Securities Litigation Reform Act of 1995. These forward-looking
statements are subject to risks and uncertainties that could cause actual results to
differ materially from the statements made. These include the risks and uncertainties
associated with economic conditions affecting the hospitality business generally, the
timing of the opening of new hotel facilities, costs associated with developing new
hotel facilities, business levels at the Company’s hotels, the ability to successfully
complete potential divestitures, and the ability to consummate the financing for new
developments. Other factors that could cause operating and financial results to
differ are described in the filings made from time to time by the Company with the
Securities and Exchange Commission. The Company does not undertake any
obligation to release publicly any revisions to forward-looking statements made by it
to reflect events or circumstances occurring after the date hereof or the occurrence
of unanticipated events.                                                               2
Gaylord Entertainment Company - Presentation to Morgan Keegan, Inc. September 30, 2003 Memphis, Tennessee - Media Corporate IR Net
Overview of Gaylord Entertainment

                                    3
Gaylord Entertainment Company - Presentation to Morgan Keegan, Inc. September 30, 2003 Memphis, Tennessee - Media Corporate IR Net
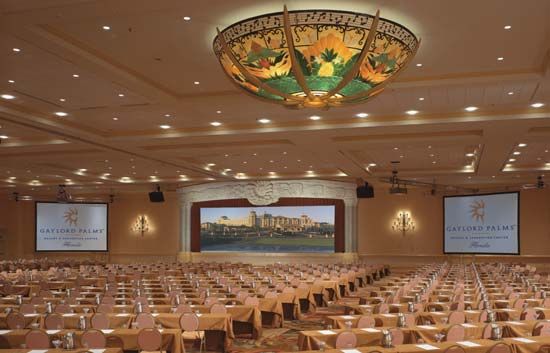
Strategic transformation
        April 2001                       Today

 Hospitality

 Media & Entertainment

                         $330 million
                         assets sold
                                        Non-Core

                                                   4
Gaylord Entertainment Company - Presentation to Morgan Keegan, Inc. September 30, 2003 Memphis, Tennessee - Media Corporate IR Net
5
Gaylord Entertainment Company - Presentation to Morgan Keegan, Inc. September 30, 2003 Memphis, Tennessee - Media Corporate IR Net
Gaylord Hotels - overview
     ƒ Gaylord Hotels is the only lodging brand focused solely on the large
       group meetings segment of the hospitality industry
             – market estimated to be $102 billion (1)
             – our core customers are meeting planners who service large groups (200+
               peak room nights)

     ƒ We provide custom-tailored solutions for our customers’ unique needs

     ƒ Our customers often have a rotational pattern, as they change the
       location of their meetings around the country from year to year

     ƒ We will continue to win the long-term loyalty of our customers and
       further strengthen our sustainable competitive advantages

                                                                                        6
(1) Convention Industry Council (2001).
Gaylord Entertainment Company - Presentation to Morgan Keegan, Inc. September 30, 2003 Memphis, Tennessee - Media Corporate IR Net
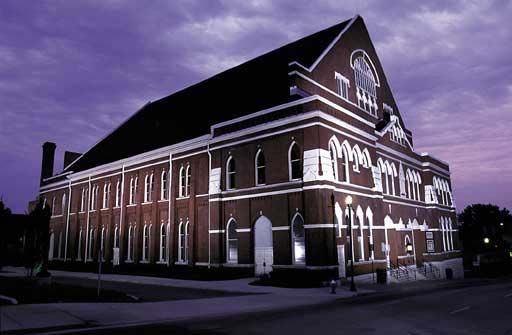
Gaylord Hotels – brand development
Customer behavior drives our brand development

                                    Brand Development

                     Superior           Superior        Entertaining
                     Product            Service         Environment
      Superior
    Knowledge &
    Relationships

                                         Customers:
                                Meeting Planners & Attendees

                                       Sustainable
                                       Advantage

                                                                       7
Gaylord Entertainment Company - Presentation to Morgan Keegan, Inc. September 30, 2003 Memphis, Tennessee - Media Corporate IR Net
Gaylord Hotels – large group focus
82% of our business comes from group business;
19% of groups generate 87% of group room nights

                                                                      Group
                 Total Room Nights           Groups                 Room Nights

                                                                        13%
      18% Non-Group
                                                                        17%
                                             1046

                                                                        70%
                     82% Group
                                              121
                                              129

                                             Star (600+)
                                             Target (201-599)
                                             Exec. Mtgs. (10-200)
                                                                                  8
Note: Information based on 2002 occupancy.
Gaylord Entertainment Company - Presentation to Morgan Keegan, Inc. September 30, 2003 Memphis, Tennessee - Media Corporate IR Net
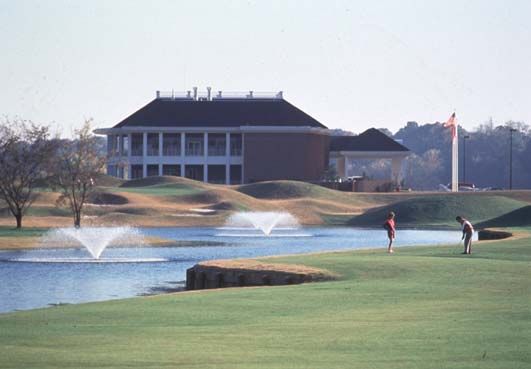
Gaylord Hotels – customer characteristics
The booking characteristics of our customers provide revenue visibility
and stability

                     Customer Segmentation                                           Average Booking Window
                                                                                 5

                                                                                         4.2
                     18%                                                         4

     11%                                                49%                      3

                                                                         YEARS
                                                                                               2.5
                                                                                                     2.1
                                                                                 2

                    22%
                                                                                 1

                                                           Association
                                                           Corporate             0
                                                           Other Group
                                                           Leisure

                                                                                                              9
Note: Information based on current bookings for all future periods.
Gaylord Entertainment Company - Presentation to Morgan Keegan, Inc. September 30, 2003 Memphis, Tennessee - Media Corporate IR Net
Gaylord Hotels – expansion

                     Satisfaction = Loyalty = Rotation = Growth

San Francisco, CA                                                                                             New York, NY
                                                                           Chicago, IL
                                                                                                           Washington, D.C

                        Las Vegas, NV                                                Nashville, TN
      Los Angeles, CA     Phoenix, AZ
                      
           San Diego, CA
                                                                                            
                                                                       Dallas, TX             Atlanta, GA

                                                                                                        Orlando, FL
  Existing site                                                                                   
  Under construction
 Top convention markets*

                                                                                                                        10
* Association and corporate top cities. Source: 2002 Meetings Market Report.
Customer satisfaction improved…
ƒ Measure customer satisfaction through an outside firm

ƒ Guest satisfaction ratings increased dramatically in 2002, based
  on percentage of top-rated scores
   – Overall satisfaction -- 78% (3Q01) to 84% (2Q03)
   – Price/value -- 64% (3Q01) to 77% (2Q03)

ƒ Guest satisfaction incentive bonus paid in 3Q02, 4Q02 and 1Q03

                                                                 11
…which led to strong 2002 bookings
                                                                   (1)
                                             Room nights booked

                        1400
                        1200
                        1000
          (thousands)

                        800
                        600
                        400
                        200
                                0
                        -200         1999     2000     2001       2002     2003E

                                Nashville   Palms    Texas    Est. Low   Est. High
                                                                                     12
(1)   For all future periods.
Gaylord Hotels – prospect inventory

                                 Prospect room nights

               2,500
              3,000,000

              2,500,000
               2,000
 Roomnights

              2,000,000
               1,500
              1,500,000

               1,000
              1,000,000

               500,000
                 500

                   -
                          2Q02   3Q02       4Q02        1Q03   2Q03

                                                                      13
Gaylord Hotels – rotation bookings
                                                                                          (1)
                                                     Rotation bookings

            70%
                                                                                58.6%
            60%
            50%
            40%                                                36.6%                                      37.0%

                             29.5%            30.8%
            30%
                                                                                                  19.6%
            20%
            10%
               0%
                           1Q02             2Q02             3Q02            4Q02               1Q03      2Q03

(1)   2002 multi-property Star account bookings as a percentage of total Star account bookings.                   14
Gaylord Hotels - product scale
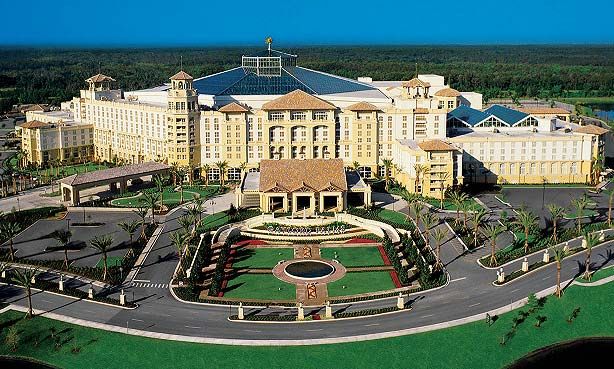
 Our hotels are large and nationally-recognized. Unique entertainment
 options inside each property are supplemented by local destination appeal

                                                                 Guest    Convention &
                                                                 rooms    meeting space     Restaurants

  Gaylord Opryland Nashville                                      2,881   600,000 sq. ft.      12 (1)

  Gaylord Palms Florida                                           1,406   400,000 sq. ft.        3

  Gaylord Opryland Texas                                          1,511   400,000 sq. ft.        4

  (1) Includes 6 fast food restaurants in the property’s food court
                                                                                                        15
Gaylord Hotels - properties

  Gaylord Opryland Nashville                        Gaylord Palms                       Gaylord Opryland Texas

              State-of-the-art meeting facilities                   Indoor atriums / entertainment         16
Nashville attractions

                        17
Despite the environment, our RevPAR index
has improved dramatically…
                                         Gaylord Hotels RevPAR Index (1)
             140%
                                               120.9%
             120%
                                    97.9%                                                   99.4%
             100%                                                               91.3%

               80%
               60%
               40%
               20%
                 0%
                                          Palms                                    Nashville
                                                       2Q2002            2Q2003

 (1)   Gaylord Hotels RevPAR as a percentage of the average RevPAR of those hotels within each properties’ respective   18
       competitive set. Source: Smith Travel Research
…as has our hospitality segment profitability

   ($ millions)
                                                       2Q02 A                 2Q03 A                Variance
       Revenues
       Rooms                                                $40.9                  $44.4                       $3.5
       Food & beverage                                       28.8                   33.9                        5.1
       Other                                                 10.8                   12.0                        1.2
         Total                                              $80.5                  $90.2                        9.7

       Departmental Profit
       Rooms                                                $30.4                  $33.6                       $3.2
       Food & beverage                                        9.0                   12.3                        3.3
       Other                                                  3.1                    3.7                        0.6
         Total                                              $42.5                  $49.5                        7.0

                     (1)
       EBITDA                                               $17.6                  $24.0                       $6.4

                           (1)
       % margin                                            21.8%                  26.6%                       4.8%
(1) EBITDA and EBITDA margin are used in this presentation because Gaylord believes they allow for a more complete
     analysis of operating performance by presenting an analysis of operations separate from the earnings impact of capital   19
     transactions and because they provide an additional measure of our ability to service debt, fund capital expenditures
     and grow our business. A reconciliation of these items to operating income is provided on page 42.
Gaylord Hotels – financing strategies
 ƒ As Gaylord Hotels continues to mature, we will evaluate ways to
   unlock capital from our real estate holdings to accelerate growth
    – Recycle capital invested in real estate
    – Increase return on invested capital
    – Move to joint-venture / management fee model

 ƒ Utilize cash from non-core asset sales to fund future growth

 ƒ Return on invested capital threshold = 12% IRR (after-tax, unlevered)

                                                                    20
21
Grand Ole Opry - overview
  ƒ An American icon with a 75+ year heritage as the cornerstone
    of country music

  ƒ Nationally and internationally renowned brand with
    extraordinary awareness and imagery

  ƒ 70 million “Country Lifestyle” consumers in the United States

  ƒ Opportunity to strategically position the brand and capitalize
    on its elasticity

  ƒ Non capital-intensive growth engine for Gaylord

                                                                     22
Grand Ole Opry - brand awareness
 The Grand Ole Opry is among the most widely recognized “Country
 Lifestyle” brands in the United States

                                                      Northeast
                                                      Northeast 78%
                                                                78%

         West
         West 85%
              85%
                                 Midwest
                                 Midwest 89%
                                         89%

                                    South
                                    South 83%
                                          83%

                                                                      23
Grand Ole Opry - brand imagery
      Consumers describe the Grand Ole Opry with overwhelmingly positive
      attributes

                Legendary                                                 96

            All-American                                              90

              High quality                                           85

                 Traditional                                        84

                      Original                                       84

                  Authentic                                         82

                              Fun                                   81

                                    0%              20%             40%         60%             80%            100%

Base: Those who were at least somewhat familiar with the Grand Ole Opry; numbers reflect percentage of those                    24
who felt the attributes described the Opry “very well” or “well”.                                          Source: FutureBrand July, 2002
Grand Ole Opry - brand development
                             Brand Extension

                                                                    Ap
                                                                      pa
                                                                        r   el
             les
          tib
                               Core Proposition
            c
         lle
       Co

                                                   g to artists/
                                                 Value
                         Distribution
                                                  record labels

                                                                                     Audio
                   Increased brand                      Artist demand
                        value                          for appearance
        Cr

                                        High quality
                                          content
          uis

                                                                                 o
              es

                                                                               de
                             Touring Shows                                  Vi               25
Grand Ole Opry - distribution
  ƒ   The building blocks have been established through alliances with
      distribution partners

                Cable Television (US)           reaches 25 million consumers

                Cable Television (Canada)       reaches 8 million consumers

                Terrestrial Radio (FM/AM)       205 stations; 2 million weekly cume

                Terrestrial Radio (FM)          33 markets

                Terrestrial Radio (FM)          reaches 0.8 million consumers; military bases

                Terrestrial Radio (AM, internet) 33 states and parts of Canada; internet stream

                Satellite Radio                 reaches 0.2 million consumers

                                                                                          26
Grand Ole Opry - brand development
                                           Brand Extension

                                                                                  Ap
                                                                                    pa
                                         Communicate Owned                            r   el
                                        & Operated Businesses
             les
          tib
                                             Core Proposition
            c
         lle
       Co

                                                                 g to artists/
                                                               Value
                                       Distribution
                                                                record labels

                                                                                                      Audio
                                                                                      ResortQuest
                   Attractions

                                 Increased brand                      Artist demand
                                      value                          for appearance
        Cr

                                                      High quality
                                                        content
          uis

                                                                                                  o
              es

                                                                                                de
                                                                                             Vi
                                              Gaylord Hotels

                                           Touring Shows                                                      27
Non-core assets

                                 Ownership

           Bass Pro Shops           19.0%

           Nashville Predators      12.8%

           Various real estate

                                             28
Overview of operating/financial metrics

                                     29
Total RevPAR drives operating margins
                                                                    Example         ADR +5%        OCC +5%
            Occupancy                                                  75.0%           75.0%          78.8%
            ADR                                                      $150.00         $157.50        $150.00

            RevPAR                                                    $112.50         $118.13        $118.13
            Food & Beverage PAR                                        $87.35          $87.35         $91.71
            Other PAR                                                  $35.05          $35.05         $36.80
            Total RevPAR                                              $234.90         $240.52        $246.64

            Food & Beverage per Occupied Room                         $116.46         $116.46        $116.46
            Other Revenue per Occupied Room                            $46.74          $46.74         $46.74
            Total Revenue per Occupied Room                           $313.20         $320.70        $313.20

            Revenues
            Rooms                                                       $176.0         $184.8         $184.8
            F&B                                                          136.7          136.7          143.5
            Other                                                         54.8           54.8           57.6
            Total Revenues                                              $367.6         $376.4         $385.9

            Operating Margin
            Rooms                                         77.0%         $135.5         $142.3         $142.3
            F&B                                           35.0%           47.8           47.8           50.2
            Other                                         29.0%           15.9           15.9           16.7
            Total                                                       $199.3         $206.1         $209.3
Note: Example case is for discussion purposes only. Assumes only Palms and Opryland Nashville rooms are in service.
                                                                                                                           30
Business mix and operating margins are indicative of Gaylord Hotels business model but are not indications of historical
or future operating performance.
EBITDA sensitivity
EBITDA is sensitive to changes in certain operating metrics

   ($ millions)

                     10,000 room nights                                                      = $1.5

                     1 occupancy point                                                       = $2.3

                     $1 ADR                                                                  = $1.1

                     1% increase in EBITDA margin                                            = $3.6

                                                                                                                             31
Note: Assumes only Palms and Opryland Nashville in operation. $150 average ADR, $150 F&B and other revenue and 50% average margin.
Financial transformation

                                                                           LTM                     LTM
                  ($ millions)                                            2Q02
                                                                               (1)
                                                                                                  2Q03
                                                                                                       (1)

                   Revenues                                                    $346.1                  $429.5
                   EBITDA                                                           39.8                    69.0
                                  (3)

                       % margin                                                  11.5%                  16.1%
                                              (3)

                   Total debt                                                  $403.2                  $470.7
                   Net debt                                                       312.9                  297.9
                                        (2)

                   Net debt / EBITDA                                                7.9x                    4.3x
(1) Last twelve months ended.
(2) Defined as total debt less cash and equivalents of $172.9 million and $90.3 million, respectively, for 2Q03 and 2Q02.
(3) EBITDA and EBITDA margin are used in this presentation because Gaylord believes they allow for a more complete
     analysis of operating performance by presenting an analysis of operations separate from the earnings impact of capital   32
     transactions and because they provide an additional measure of our ability to service debt, fund capital expenditures
     and grow our business. A reconciliation of these items to operating income is provided on page 41.
33
Anticipated benefits
  ƒ Provide Gaylord significant growth with limited capital
    expenditure
  ƒ Vacation home management industry favorable characteristics
     – large and growing market
     – fragmented market with “mom-and-pop” competition
  ƒ Build unique demand delivery system through Gaylord’s millions
    of hospitality and entertainment customers
  ƒ Leverage Gaylord’s brand expertise
  ƒ Provide ResortQuest access to development capital
  ƒ Realize cost saving synergies
     – public company costs
     – efficient corporate practices
  ƒ Increase public float of the pro forma company
  ƒ Win / win for both companies’ shareholders
    – stock-for-stock transaction                              34
Gaylord customer interface
  The significant volume of customers associated with our various businesses gives us
  the ability to capitalize on tremendous cross-selling activity into ResortQuest
  properties
                                        Gaylord
                                        Gaylord Opryland
                                                Opryland Nashville
                                                         Nashville                                Gaylord
                                                                                                  Gaylord Palms
                                                                                                            Palms
                                                  (TN)
                                                   (TN)                                                (FL)
                                                                                                        (FL)

                                                                                          n   600,000+ guests / year
                                    n   1.2 million guests / year
                                                                                          n   Upscale customer base with more
                                                                                              disposable income
                                                                                          n   Orlando market

           Bass                                                                                                              Gaylord
                                                                                                                             Gaylord Opryland
                                                                                                                                     Opryland Texas
                                                                                                                                               Texas
           Bass Pro
                Pro Shops
                    Shops                                                                                                             (TX)
                                                                                                                                       (TX)

    n   19.1% ownership interest in company                                                                              n    600,000+ guests / year
    n   Large customer database (3 million)                                                                              n    Dallas market
    n   Customers generally have active
        lifestyle
                                                                        Stimulate
                                                                        Stimulate demand
                                                                                   demand
                                                                           at
                                                                           at ResortQuest
                                                                              ResortQuest

          Grand
          Grand Ole
                Ole Opry
                    Opry
          media                                                                                                                      WSM-AM
                                                                                                                                     WSM-AM
          media exposure
                exposure

    n   Most widely known platform for Country music                                                                     n    Large listener base
        in the world                                                                                                     n    Channel reaches 32 states and
    n   Millions of weekly listeners                                                                                          parts of Canada each night
                                                                          Strategic
                                                                          Strategic alliances
                                                                                    alliances
    n   Distribution:
               ¾ Great American Country (25 million reach)
               ¾ Westwood One FM syndication (205 stations)
                                                                    n    Significant co-branded marketing
               ¾ Armed Forces Radio
                                                                         programs
               ¾ Sirius Satellite Radio
                                                                    n    Major alliances include Coca-Cola, Visa,
               ¾ Audiences in Opry House                                 American Express, American Airlines,
               ¾ WSM-AM                                                  Southwest Airlines, AT&T, BellSouth,
                                                                         Cingular, Hertz, Office Depot, etc.                                                  35
“Country Lifestyle” consumers

    “Country Lifestyle” consumers who rented vacation properties
    in the past two years
                                                                    3-5    6-10     11+
                                        Total   1 trip   2 trips   trips   trips   trips
    Beach                               23%     11%        8%       3%      1%      0

    Mountains                           18%     10%        4%       3%      1%      1%

    Other                               11%      5%        3%       2%      1%      0

    ƒ Because of cross-overs, approximately 30 percent of "Country
      Lifestyle" consumers indicate they have stayed in rental
      accommodations more than once in the past 2 years

   Source: Future Brand, 2002 Survey.
                                                                                           36
Financial impact of brand maturity

  ƒ There is a significant opportunity for EBITDA growth as market share
    escalates and margin improves

   ($mm)

                           Gross                                                  EBITDA margin (3)
     Share of             lodging RZT mgmt.
    industry (1)         revenue (1) fee (2)                            15%                  20%                  25%

          4%                 $480                 $168                $25.2                 $33.6                $42.0

          6%                  720                   252                 37.8                 50.4                 63.0

          8%                  960                   336                 50.4                 67.2                 84.0

         10%                1,200                  420                  63.0                 84.0                105.0
  (1) Assumed for illustrative purposes. Analysis assumes the industry reaches $12 billion in gross lodging revenue over the next five years.
  (2) Potential RZT management fee revenue assuming 35% management fee.                                                              37
  (3) Shows EBITDA performance at varying levels of EBITDA margin.
Vision for the future
                 Today                                                     Tomorrow

                                                        ƒ       Extended property platform
  ƒ   3 property platform
                                                        ƒ       Capital partner relationships for growth
  ƒ   Invested own capital to prove
      business model                                    ƒ       Unlock capital from real estate holdings
  ƒ   Significant real estate ownership                 ƒ       Leverage customer relationships for
                                                                product improvements / extensions
  ƒ   Extensive customer relationships
                                          3 – 5 Years

                                                        ƒ       Dominant brand in the vacation
                                                                property management industry
      ƒ   AM, cable, satellite
                                                        ƒ       Integrated marketing plan with rest
          distribution complete
                                                                of Gaylord businesses
      ƒ   FM distribution limited
      ƒ   Limited product set

              Non-Core                                      ƒ    Distribution network complete
                                                            ƒ    Broad product set and licensing
                                                                 relationships

                                                                    Non-Core Assets Monetized         38
Guidance
  Gaylord Hotels
       ƒ FY2003 RevPAR                           4% to 7% growth
       ƒ FY2003 capex                            $230 to $240 million
       ƒ 3Q03 RevPAR                             -3% growth
       ƒ 3Q03 revenue                            $95 to $98 million
       ƒ 3Q03 EBITDA margin                      10% range
       ƒ 3Q03 capex                              $55 to $70 million
       ƒ 4Q03 RevPAR                             -2% growth
       ƒ FY2004 RevPAR (1)                       estimated to be flat
       ƒ FY2005-07 RevPAR (1)                    high single-digit growth each year

  ResortQuest
       ƒ FY2003 revenue                          $150 - $155 million
       ƒ FY2003 EBITDA margin                    12% range

  (1) Based on current booking trends and assuming no significant economic recovery.   39
This communication is not a solicitation of a proxy from any security holder of Gaylord Entertainment
Company or ResortQuest International, Inc. Gaylord and ResortQuest intend to file a registration statement
on Form S-4 with the SEC in connection with the merger. The Form S-4 will contain a prospectus, a proxy
statement and other documents for the stockholders’ meetings of Gaylord and ResortQuest at which time
the proposed transaction will be considered. Gaylord and ResortQuest plan to mail the proxy statement
and prospectus contained in the Form S-4 to their respective stockholders. The Form S-4, proxy statement
and prospectus will contain important information about Gaylord, ResortQuest, the merger and related
matters. Investors and stockholders should read the Form S-4, the proxy statement and prospectus and the
other documents filed with the SEC in connection with the merger carefully before they make any decision
with respect to the merger. The Form S-4, proxy statement and prospectus, and all other documents filed
with the SEC in connection with the merger will be available when filed free of charge at the SEC’s web site,
www.sec.gov. In addition, all documents filed with the SEC by Gaylord in connection with the merger will be
made available to investors free of charge by writing to: Gaylord Entertainment Company, One Gaylord
Drive, Nashville, Tennessee 37214, Attn: Investor Relations. All documents filed with the SEC by ResortQuest in
connection with the merger will be made available to investors free of charge by writing to: ResortQuest
International, Inc., Suite 203, 8955 Highway 98 West, Destin, Florida 32550, Attn: Investor Relations.

Gaylord, ResortQuest, their respective directors and executive officers may be deemed participants in the
solicitation of proxies from Gaylord's stockholders and ResortQuest's stockholders. Information concerning
Gaylord's directors and certain executive officers and their direct and indirect interests in Gaylord is
contained in its proxy statement for its 2003 annual meeting of stockholders. Information concerning
ResortQuest's directors and certain executive officers and their direct and indirect interests in ResortQuest is
contained in its proxy statement for its 2003 annual meeting of stockholders. Additional information
regarding the interests of these participants in the merger will be available in the proxy statement regarding
the merger. Investors can obtain free copies of these documents from the SEC’s website, Gaylord and
ResortQuest using the contact information above.

                                                                                                             40
Gaylord financial reconciliation
                                                                           (1)
        Gaylord Entertainment Company:                          LTM 2Q03

        Net Income                                                   $102.3
         Cumulative effect of accounting change, net of taxes           0.0
         Income from discontinued operations, net of taxes            (84.7)
         Provision (benefit) for income taxes                          10.3
         Other gains and losses                                        (1.6)
         Unrealized gain (loss) on derivatives                        (57.4)
         Unrealized gain (loss) on Viacom stock                         7.8
         Interest expense, net                                         40.5
            Operating income / (loss)                                 $17.3
         Depreciation                                                  53.0
         Amortization                                                   4.5
         Restructuring charges, net                                    (0.0)
         Noncash lease expense                                          6.5
         Noncash naming rights for Gaylord Arena                        1.0
         Gain on sale of assets                                       (20.0)
         Preopening costs                                               6.7
         Pension charges, net of tax                                    0.0
            EBITDA                                                    $69.0
                                                                                 41
   (1) Last twelve months, as of 2Q03.
Gaylord financial reconciliation

    Hospitality Segment:
                                              2Q02            2Q03
    ($ millions)                          $          %    $          %

    Operating income / (loss)             $5.3    6.6%    $8.5    9.5%
     Plus: preopening costs                0.7    0.8%     2.2    2.5%
     Plus: noncash lease expense           1.6    2.0%     1.6    1.8%
     Plus: depreciation & amortization    10.0   12.4%    11.6   12.8%
       EBITDA                            $17.6   21.8%   $24.0   26.6%

                                                                         42
   (1) Last twelve months, as of 2Q03.
Q&A

      43
You can also read