Investigation of laser-powder interaction in laser powder bed fusion process in additive manufacturing
←
→
Page content transcription
If your browser does not render page correctly, please read the page content below
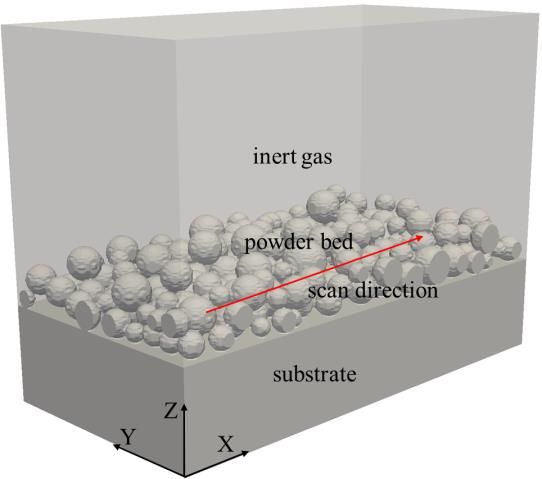
EPJ Web of Conferences 249, 12002 (2021) https://doi.org/10.1051/epjconf/202124912002
Powders and Grains 2021

 Investigation of laser-powder interaction in laser powder bed
 fusion process in additive manufacturing
 Erlei Li, Lin Wang, Ruiping Zou, Aibing Yu, and Zongyan Zhou*
 ARC Research Hub for Computational Particle Technology, Department of Chemical Engineering, Monash University, Clayton, VIC
 3800, Australia

 Abstract. Laser powder bed fusion (LPBF) is one of the most promising additive manufacturing (AM)
 technologies to fabricate metal components using laser beams. To understand the underlying thermal and
 physical phenomena in LPBF process, discrete element method (DEM) is applied to generate the randomly
 packed powder, then computational fluid dynamics (CFD) coupled with volume of fluid (VOF) is adopted
 to simulate the laser-powder interaction. The penetration and multiple reflection of laser rays is traced. The
 physics of melting and solidification is captured. The temperature profile indicates the laser travel path and
 the adsorption and transmission of laser rays with the powder. The wetting behaviour of the melt pool driven
 by the capillary forces leads to the formation of pores at the connection zone. It has been demonstrated that
 the developed model can capture the laser-powder interaction for further understanding of LPBF process.

 1 Introduction the mushy zone, surface tension, Marangoni effect and
 recoil pressure. Laser ray tracing model with multiple
 Laser powder bed fusion (LPBF) is one of the additive reflection is interpolated to represent the laser rays and
 manufacturing (AM) technologies, which is fast discrete transfer radiation model (DTRM) is employed
 developing in recent years for industrial metal to describe the adsorption and transmission between
 production in aerospace [1] and biomedical sectors [2]. laser rays and powder. Thus, it is able to to capture the
 In LPBF process (particularly the selective laser melt pool flow dynamics and thermal behaviour in the
 melting), thin layers of metal powder are distributed by melting and solidification process. However, the powder
 a spreader (blade or roller). Then Laser beam with high layer used is a square-packed array, and also the detailed
 energy density is applied to melt the powder, following analysis of laser-powder interaction is lacking in our
 the process that melted regions solidify and fuse previous work [7]. Hence, this work aims to address the
 together to form a layer of the built component. The two issues, in particular, the random powder bed is
 process of powder deposition, melting and solidification generated by discrete element method (DEM).
 is repeated until achieving the final part.
 Although the LPBF technology has been widely
 applied, it still faces challenges in controlling fabricated 2 Model description
 part quality that is affected by the defect formation (e.g.,
 balling effects, lack of fusion and pores) [3]. These
 undesired generated defects are closely related to the
 thermophysical phenomena such as heat transfer in
 powder bed, melting of powder, droplet spattering and
 evaporation which are resulted from laser-powder
 interaction. Understanding the physics and defects
 formation mechanisms in LPBF is crucial for production
 control. Research work has been taken in the past years.
 For example, X-ray imaging is used to capture the laser-
 powder interaction directly while it is limited by the
 spatial resolution [4]. Modelling is an alternative
 method to obtain the detailed information such as the
 temperature and velocity in melting and solidification, Fig. 1. Framework for the LPBF modelling: DEM is used to
 for example, as reviewed in [5, 6]. In our recent work generate powder layers (the top), and CFD is applied to
 [7], a three-phase model on the basis of CFD coupled capture the melting/solidification of powder (the bottom).
 with volume of fluid (VOF) was developed to capture
 Powder bed deposition and melting and solidification
 the melt pool dimensions and melt pool dynamics. In
 are the two main steps of LPBF process. Therefore, in
 such a model, important terms are considered such as

 * Corresponding author: zongyan.zhou@monash.edu
 A video is available at https://doi.org/10.48448/x797-vy17
© The Authors, published by EDP Sciences. This is an open access article distributed under the terms of the Creative Commons Attribution License 4.0
(http://creativecommons.org/licenses/by/4.0/).
EPJ Web of Conferences 249, 12002 (2021) https://doi.org/10.1051/epjconf/202124912002
Powders and Grains 2021

 this work, the powder bed deposition is produced by momentum conservations, energy equation and laser
 DEM which gives the detailed information of individual energy with multiple reflections can be found in [7].
 powder such as the particle size and positions [8]. This
 detailed particle information is then transferred to CFD
 2.2 Simulation conditions
 model [7] to simulate the melting and solidification
 process, and the framework is shown in Fig. 1. A random distributed powder bed with a powder size
 The governing equations for the modelling of DEM distribution in the range of 15 – 45 µm and d50 of 30 µm
 and CFD and simulation conditions are briefly described is applied in this work. Material of Ti-6Al-4V is adopted
 below. to simulate its interaction with the laser rays. The key
 parameters such as powder properties and model
 2.1 Governing equations parameters are listed in Table 1. The computational
 region consists of the substrate, powder bed and gas. The
 The detailed governing equations about powder bed laser scans along the positive X axis (the red arrow line
 spreading in DEM can be seen in [8]. For CFD model, shown in Fig. 2).
 VOF with mass transfer (melting and solidification mass
 Table 1. Key parameters used in the simulation.
 transfer) is utilized to track the free surface at different
 phases and its governing equation is expressed as: Parameters Values

 + ∙ ( ) = 0 (1), Density of solid ( ) 4420 kg m-3
 Density of liquid ( ) 3682 kg m-3
 where α is the volume fraction of each phase, U Specific heat capacity of solid
 represents the velocity. Note that the melting mass ( )
 670 J kg-1 K-1
 transfer rate is controlled by the melting coefficient: Specific heat capacity of liquid
 ̇ =
 ( − )
 > (2), 831 J kg-1 K-1

 ( )
 where ̇ , , and respectively represent the Specific heat capacity of gas
 520.32 J kg-1 K-1
 melting mass transfer rate, melting coefficient, solid ( )
 phase fraction, temperature and liquidus temperature. Thermal conductivity of solid
 10.6 W m-1 K-1
 The molten liquid is assumed to be incompressible, ( )
 and mushy zone (the solid-liquid mixture region formed Thermal conductivity of liquid
 33.4 W m-1 K-1
 ( )
 in the melting and solidification process), surface
 Thermal conductivity of gas 1.772 × 10⁻² W m-
 tension, Marangoni force (resulted from surface tension ( ) 1 -1
 K
 variation caused by temperature gradient) and recoil
 Liquidus temperature ( ) 1923 K
 pressure (a force generated on the liquid-gas interface Solidus temperature ( ) 1877 K
 when the temperature is higher than the boiling point) Surface tension (σ) 1.5 kg s-2
 are considered in the momentum equation: Dynamic viscosity of liquid ( ) 0.002541 kg m-1 s-1
 ( )
 + ∙ ( ) = − + + ∙ ( (∇ + ∇ )) Latent heat of fusion ( ) 2.86×10⁵ J kg-1

 (1 − )2
 + + ∇ + (∇ − ( ∙ ∇ ))|∇ |
 3 +
 ( − )
 +0.54 0 ∇ (3),

 where ρ is the density, p is the pressure, g is the gravity
 acceleration, μ is the dynamic viscosity, C is a constant
 related to mushy zone, αl is the liquid volume friction, σ
 is the surface tension, and the last two terms correspond
 to the Marangoni force and recoil pressure, respectively.
 Latent heat of fusion, convective heat transfer,
 radiative heat transfer and input energy from laser are
 include in the energy conservation:
 ( ) ( )
 + ∙ ( ) = ∙ ( ) − ( + ∙

 4
 ( )) − ℎ ( − ) − ( 4 − ) + (4),
 where Cp is specific heat capacity, k represents thermal
 Fig. 2. Computational domain of 500 µm ×250 µm ×370 µm
 conductivity, Lf is the latent heat of fusion, hc is the
 which consists a 100-µm tall substrate, a 70-µm tall powder
 convective heat transfer coefficient, σsb is the Stefan- bed and a 200-µm tall inert gas region.
 Boltzmann constant, εe is the emissivity, and S is the
 input laser energy considering the multiple reflection. To satisfy the CFL (Courant Friedrichs Lewy)
 Note that in the laser ray tracing model, a set of condition, time step of 10-8 s is chosen first, and it can
 collimated rays are traced when they travel through the be adjusted automatically to make the Courant number
 medium. In DTRM, the change of laser energy density lower than 1.0 in the calculation process. The initial
 along the travel path is calculated by the radiative temperature field inside the simulation domain is set to
 transfer equation. be 300 K. The temperature boundary conditions for
 More details about the CFD governing equations bottom surface and other faces are fixed temperature of
 including the VOF with mass transfer, continuity and 300 K and zero gradient, respectively. All faces are set

 2
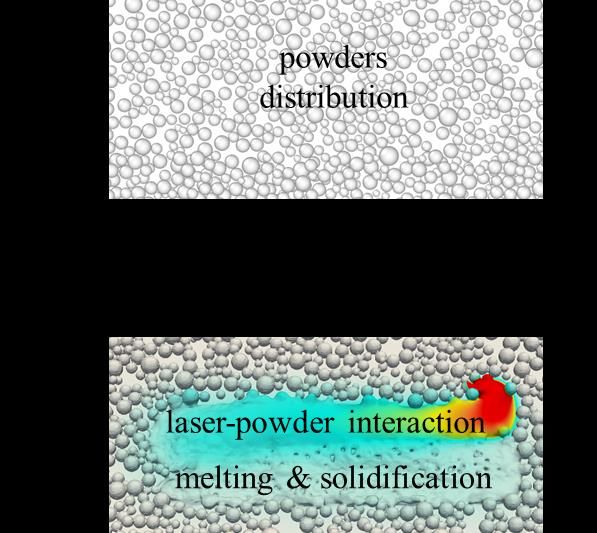
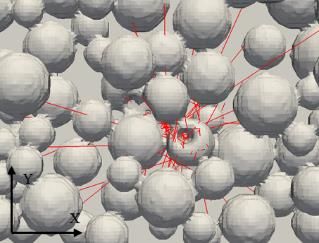
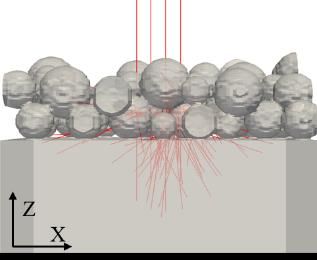
EPJ Web of Conferences 249, 12002 (2021) https://doi.org/10.1051/epjconf/202124912002 Powders and Grains 2021 as zero for velocity except the left face with a fixed value shape which can be observed at t = 250, 275 and 300 µs of 1 m/s. in Fig. 4. Due to the different layer thickness along the laser scanning direction, the melted part in the substrate is uneven and three disconnected concave regions are 3 Results and discussion generated at t = 300 µs. This phenomenon indicates that Capturing the laser-powder interaction and realistic the laser ray tracing method used in the model can lead representation of heat deposition on the powder bed are to non-uniform melting and this method is more realistic the advantages of the model. This model has been to represent the laser beams than surface or volume heat validated by the data of melt pool width and surface source. roughness from experiments [7]. Note that this work is based on the bed with random distributed powder which is quite different to [7] using the uniform and ordered powder arrangement. Besides, the physics of laser- powder interaction and partial melting of powder has not been fully revealed by our previous work [7]. To observe the laser-powder interaction directly, the travel path of laser rays is illustrated in Fig. 3. At the beginning, four collimated laser beams shot to the system and they pass through the gas media (see Fig. 3(a)) and hit the solid powder surface (see Fig. 3(b) where the solid surface is changed to concave due to the mass transfer to liquid, which indicates that only the Fig. 4. The process of laser-powder interaction. The laser region under the initial laser-powder interaction is power is 150 W with a spot size of 50 µm and a scanning melted). Based on the random distributed powder and speed of 1000 mm/s. the spherical morphology of particles, multiple reflection is generated as shown in Fig. 3(b) where laser beams scatter to surrounding powder and gas domain. 3000 This physics can increase the laser energy adsorption [8]. The laser rays penetrate to the powder deeply, even to 2500 Temperature the substrate presented in Fig. 3(a). It can lead to Temperature/K substrate melting which will be discussed in the 2000 2 following section. 1500 1000 1 laser position 500 3 0 0 80 160 240 320 400 Position along Z axis/µm (a) (b) Fig. 5. Temperature profile in the Z axis (at X = 440 µm, Y = Fig. 3. The travel path of laser rays: (a) penetration of rays in 125 µm). The numbers of 1, 2, and 3 correspond to the the X-Z plane; and (b) top view of multiple reflection in the X- substrate, powder bed and gas region, respectively (region Y plane. The laser rays are indicated by the red lines. between dashed lines). The lasers position is indicated by the vertical dotted line. The melting point indicted by the The powder interaction with the laser rays (the laser horizontal dotted line is 1948 K. The process parameters are scans from the bottom to the top) is presented in Fig. 4. the same as shown in Fig. 4s caption. At the beginning, the laser rays touch the powder, and To better observe the laser-powder interaction and the temperature increases rapidly to the melting point of heat transfer, the temperature distribution along the Z 1984 K (t = 200 µs). The adsorbed heat energy axis in the simulation domain is collected and shown in reallocates in the powder bed from the laser spot centre Fig. 5. Partial laser energy is absorbed by the gas region, to surrounding media by the heat conduction. After 25 and the left laser rays can transmit through gas and reach µs, the powder which interacts with laser rays first is to the powder bed which adsorbs most of the heat melted partially. This makes the substrate exposed in the density, thus presenting the highest temperature ranging laser beam and the melting behaviour can penetrate from 1500 K to 2900 K. Note that the temperature in the deeper. With the laser moving forward, the first powder gas region decreases along the positive direction of Z interacted with laser is completely melted and the axis. Due to the heat conduction and laser penetration, powder on the left of this one is partially melted because the temperature in some area of the substrate exceeds the of the limited range of laser beam energy (t = 250 µs). melting point which is consistent with the melting The particles at the edge of the laser diameter are heated results in Fig. 4. The bottom face is set as 300 K initially while the temperature of these particles is lower than the as the boundary condition which may affect the melting point, hence keeping their original spherical temperature distribution in the substrate. Further study 3
EPJ Web of Conferences 249, 12002 (2021) https://doi.org/10.1051/epjconf/202124912002 Powders and Grains 2021 is needed to investigate the effect of thermal boundary ranging from 2×10³ s-1 to 6×10⁴ s-1. Results show that conditions. the melt pool dimension of width and depth, and the melt The powder melting and melt pool solidification pool volume increase with the increase of melting process is illustrated in Fig. 6. The region interacted with coefficient. It indicates that the increase of melting the laser rays is melted which keeps the spherical shape coefficient enlarges the melting mass transfer rate. For (t = 200 µs) in the beginning. The melted powder example, the volume grows from 1.55×105 µm3 to presents the fluid dynamics and collapses to the melt 8.86×105 µm3 as the melting coefficient increases from pool which can be well observed at t = 250 and 300 µs. 2×10³ s-1 to 6×10⁴ s-1. The molten liquid can wet neighboring powder driven by the capillary forces such as the surface tension and Marangoni effect. This phenomenon is presented at t = 4 Conclusions 425 and 500 µs where the melt pool connects with the The laser-powder interaction in LPBF process is studied two adjacent powder on the left and one large powder in this work where DEM provides particle positions and on the right. The molten liquid spreads and bounds CFD is used to simulate the melting and solidification together with surrounding powder, which results in the process. The travel path of laser rays in the system is pores (t = 1000 µs) which are generated at the traced, and the penetration and multiple reflection of connection zone (edge of the melt pool) after fully laser rays is illustrated. The thermal and physical solidifying. Theses pores could be eliminated by multi- phenomena such as powder full and partial melting are track scanning. well captured. Non-uniform melting is observed due to the spatial layer thickness variation on the random distributed powder bed. The temperature distribution in the simulation domain indicates the laser travel path and the interaction between laser rays and the media including the gas, powder and substrate. The wetting dynamics of melt pool and pores formation mechanism are revealed. The increase of melting coefficient enlarges the melting mass transfer rate. This model can capture the main features in LPBF process, but the model still needs further improvement to enable to reveal metal evaporation and laser-vapor interaction. The authors are grateful for the financial support from Australian Research Council, and the National Computational Infrastructure for computation. Fig. 6. Snapshots of melting and solidification process in the Y-Z plane (X = 220 µm). The process parameters are the same References as shown in Fig. 4s caption, and the laser turns off at 440 µs. The melt pool and formed porosities are indicated by the [1] Z.L. Lu, J.W. Cao, H. Jing, T. Liu, F. Lu, D.X. Wang, shallow blue contour and red dashed circle, respectively. D.C. Li, Virtual Phys. Prototyp. 8, 87-95 (2013) 120 10 [2] J.E. Biemond, G. Hannink, N. Verdonschot, P. Buma, J Mater. Sci. Mater. Med. 24, 745-753 (2013) [3] B. Zhang, Y. Li, Q. Bai, Chin. J. Mech. Eng. 30, 515- Melt pool volume (×105 µm3) 8 Melt pool dimension (µm) 100 527 (2017) 6 [4] C.L.A. Leung, S. Marussi, R.C. Atwood, M. Towrie, 80 width P.J. Withers, P.D. Lee, Nat. Commun. 9, 1-9 (2018) depth volume 4 [5] P.S. Cook, A.B. Murphy, Addit. Manuf. 31, 100909 (2020) 60 [6] H.L. Wei, T. Mukherjee, W. Zhang, J.S. Zuback, 2 G.L. Knapp, A. De, T. DebRoy, Prog. Mater. Sci. 116, 100703 (2021) 40 0 0 10 20 30 40 50 60 [7] E.L. Li, L. Wang, A.B. Yu, Z.Y. Zhou, Powder Melting coefficient (×103 s-1) Technol. 381, 298-312 (2021) Fig. 7. Melt pool dimension and volume at different melting [8] L. Wang, E.L. Li, H. Shen, R.P. Zou, A.B. Yu, Z.Y. coefficients at 425 µs. The process parameters are the same as Zhou, Powder Technol. 363, 602-610 (2020) shown in Fig. 4s caption. Note that the phase change from solid powder to molten liquid occurs in LPBF process and the mass transfer rate is controlled by the melting coefficient [7]. Fig. 7 gives the melt pool dimension and melt pool volume with various values of melting coefficient 4
You can also read