Investigating the Mechanism of Germinal Center Shutdown
←
→
Page content transcription
If your browser does not render page correctly, please read the page content below
ORIGINAL RESEARCH
                                                                                                                                            published: 14 July 2022
                                                                                                                                  doi: 10.3389/fimmu.2022.922318

                                          Investigating the Mechanism of
                                          Germinal Center Shutdown
                                          Theinmozhi Arulraj 1, Sebastian C. Binder 1 and Michael Meyer-Hermann 1,2*
                                          1Department of Systems Immunology, Braunschweig Integrated Centre of Systems Biology, Helmholtz Centre for Infection
                                          Research, Braunschweig, Germany, 2 Institute for Biochemistry, Biotechnology and Bioinformatics, Technische Universität
                                          Braunschweig, Braunschweig, Germany

                                          Germinal centers (GCs) are transient structures where affinity maturation of B cells gives
                                          rise to high affinity plasma and memory cells. The mechanism of GC shutdown is unclear,
                                          despite being an important phenomenon maintaining immune homeostasis. In this study,
                                          we used a mathematical model to identify mechanisms that can independently promote
                                          contraction of GCs leading to shutdown. We show that GC shutdown can be promoted
                                          by antigen consumption by B cells, antigen masking by soluble antibodies, alterations in
                                          follicular dendritic cell (FDC) network area, modulation of immune complex cycling rate
                                          constants, alterations in T follicular helper signaling, increased terminal differentiation and
                           Edited by:
                         Paolo Casali,    reduced B cell division capacity. Proposed mechanisms promoted GC contraction by
The University of Texas Health Science    ultimately decreasing the number of B cell divisions and recycling cells. Based on the in-
 Center at San Antonio, United States
                                          silico predictions, we suggest a combination of experiments that can be potentially
                      Reviewed by:
                           Alex Dent,
                                          employed by future studies to unravel the mechanistic basis of GC shutdown such as
       Purdue University Indianapolis,    measurements of the density of pMHC presentation of B cells, FDC network size per B
                        United States     cell, fraction of cells expressing differentiation markers. We also show that the identified
                             Wei Luo,
       Purdue University Indianapolis,    mechanisms differentially affect the efficiency of GC reaction estimated based on the
                        United States     quantity and quality of resulting antibodies.
               *Correspondence:
                                          Keywords: germinal center shutdown, chronic germinal centers, vaccination, antibody responses,
           Michael Meyer-Hermann
                                          mathematical modeling
         mmh@theoretical-biology.de

                   Specialty section:
         This article was submitted to    INTRODUCTION
                        B Cell Biology,
               a section of the journal   Germinal centers (GCs) are highly organized structures in secondary lymphoid organs that support
              Frontiers in Immunology
                                          affinity maturation of B cells by iterative rounds of mutation and selection (1). A mature GC is
             Received: 17 April 2022      composed of two compartments – a Dark zone (DZ) and a Light zone (LZ) (2, 3). In the DZ,
            Accepted: 20 June 2022        dividing B cells called centroblasts mutate their B cell receptor (BCR) gene by a process termed
            Published: 14 July 2022
                                          somatic hypermutation. B cells are referred as centrocytes in the LZ, where the B cells are selected
                              Citation:   based on the BCR affinities. For this purpose, LZ comprises a network of follicular dendritic cells
              Arulraj T, Binder SC and
                                          (FDCs) displaying immune complexes (ICs) and T follicular helper (Tfh) cells. Acquisition of ICs
            Meyer-Hermann M (2022)
       Investigating the Mechanism of
                                          from FDCs and peptide-MHC (pMHC) presentation to Tfh cells, prevents apoptosis of centrocytes
          Germinal Center Shutdown.       (4) and promotes recycling to the DZ for cell divisions (5) or induces differentiation into precursors
          Front. Immunol. 13:922318.      of memory or plasma cells that leave the GCs (6, 7). Mechanisms involved in selection and cell fate
    doi: 10.3389/fimmu.2022.922318        decisions of GC B cells are actively being elucidated (6, 8–11).

Frontiers in Immunology | www.frontiersin.org                                   1                                          July 2022 | Volume 13 | Article 922318
Arulraj et al.                                                                                                            Mechanisms of GC Shutdown

    This evolutionary process of B cells lasts only for a limited            proposed as a mechanism of GC shutdown over limiting T cell help
period of time as GCs are transient and undergo shutdown. The                (43). Previously, mathematical models were also used to establish
lifetime of single GCs in a lymphoid organ is unknown, but                   rules governing the differentiation of centroblasts to centrocytes,
collective GC responses in a lymphoid organ lasts for a period of            selection of centrocytes and recycling of selected centrocytes by
3 weeks in the case of model protein antigens and more than a                comparing the consistency with experimental GC kinetics and
month in chronic viral infections (12–14). Therefore, the exact              ability to recapitulate GC termination (44). Considering the new
lifetime of GC responses varies depending on the immunization                findings and recent advances in the understanding of GC evolution,
conditions such as the antigen and adjuvant used (15–17). In a               there is a potential to better characterize the mechanism of GC
normal infection or immunization, shutdown of GCs affects the                shutdown. In this study, we consider evidence from various
quality and quantity of antibody responses by limiting the                   experimental studies and identify mechanisms that can
timeline of affinity maturation and generation of output cells.               individually drive GC shutdown. We suggest a number of
Consequently, shutdown of GCs is an attractive target for the                experiments to test the proposed mechanisms. Finally, we discuss
therapeutic modulation of GC responses. However, GC                          the implications of GC shutdown on the quality and quantity of GC
shutdown remains poorly understood and the underlying                        output in different mechanisms.
mechanism is unresolved since decades, thus, hindering the
identification of strategies to efficiently modulate GC lifetime.
    GC contraction occurs due to a shift in the balance between              METHODS
proliferation, apoptosis and terminal differentiation of B cells
when apoptosis and differentiation overtake the proliferation                Overview of the GC Model
(18). These alternative B cell fates are modulated by interactions           Mechanisms of GC shutdown were implemented in the
with FDCs and Tfh cells (19). Proliferation of GC B cells is                 framework of GC model hyphasma (45–47). The base model
controlled by the transcription factor c-Myc, deficiency of which             includes a three-dimensional discrete lattice with CXCL12 and
can cause premature GC shutdown (20) suggesting the                          CXCL13 chemokine gradients. An agent-based approach was
importance of continued cell divisions in GC maintenance.                    used and individual B cells, Tfh cells and FDCs were randomly
Similarly, the absence of FDCs or Tfh cells lead to the                      placed in the lattice and simulated. Both the number of FDCs
dissolution of established GC reactions by inducing GC B cell                and Tfh cells were assumed to be 200. FDCs comprise a soma
apoptosis (21–23). Dysregulation of B cell proliferation,                    and six-dendrites of length 40 μm that extend from the soma of
apoptosis and terminal differentiation are commonly observed                 each FDC and therefore, occupy multiple lattice sites. Position of
in GC-derived B cell lymphomas (24–27).                                      soma of the FDCs were randomly chosen in the LZ region of the
    These experimental observations suggest the role of different            lattice. Each FDC was loaded with 3000 antigen portions and the
cell types and B cell intrinsic factors in controlling GC                    antigen amount was equally distributed among the lattice sites
maintenance but the exact mechanism behind natural GC                        occupied by the FDC.
shutdown is unknown (28). Nevertheless, recent studies have                      A four-dimensional shape space (48) was used for BCR affinity
identified progressive changes occurring during the GC reaction,              representation. Mutations were modelled by a random shift in the
in FDCs, Tfh cells, T follicular regulatory (Tfr) cells and GC B             shape space position to neighboring sites. GC B cells undergo state
cells. FDCs undergo changes in morphology and surface marker                 transition corresponding to different stages. B cells were randomly
expression (2, 29, 30). Tfh cells are selected depending on their            incorporated in the lattice with an influx rate of 2 cells per hour for
ability to recognize pMHC presented by B cells (31) and undergo              the first 4 days. Seeder B cells belong to the state DZ B cell, where
changes in the expression of CD40L and cytokines (32).                       each cell undergoes six divisions each and mutate with a probability
Dynamics of Tfr cells peak at late stages of GC reaction (33,                0.5 (49, 50). DZ B cell switches to the Unselected state after divisions
34), highlighting the potential role in GC shutdown. Repeated                and go through an antigen collection phase for 0.7 hours. Antigen
interactions of these cell types might lead to alterations in the GC         acquisition by B cell reduces the antigen amount on FDCs. Multiple
B cell fate and cause GC shutdown. But the mutual dependence                 antigen collection events were allowed while constraining the time
of different cell types and the mechanisms underlying the                    interval between subsequent antigen collection events to 0.02 hours.
characteristic changes during GC evolution are only partly                   Unselected to FDCselected transition signifies successful antigen
understood. It is also unclear whether these dynamic changes                 uptake and FDCselected cells establish contacts with Tfh cells.
are individually sufficient to terminate GCs.                                     Each interaction of B cell with Tfh lasts for 6 minutes.
    Poor understanding of GC shutdown is partly due to technical             Acquisition of Tfh signals occurs when the Tfh polarizes to the
challenges and complex behavior of GCs. Mathematical modeling                B cell. When multiple B cells are bound to a given Tfh cell, the
was an integral part of GC research and contributed to our                   Tfh cell is assumed to polarize only towards the B cell with
understanding of the mechanisms behind GC B cell selection (11,              highest antigen uptake. Signals acquired from Tfh is integrated in
35), predicted the existence of recycling (36, 37), predicted the role       a given B cell. If the signals acquired reach a threshold of 0.5 h
of soluble antibodies in GC shutdown (38), used to devise strategies         at the end of 3 hours, then the B cell is Selected. Selected cells
for induction of broadly neutralizing antibodies (39, 40) and for            acquire DZ B cell state and divide again. Seventy-two percent of
enhancing vaccination responses (41, 42). Based on an ordinary               the divisions were assumed to be asymmetric in terms of antigen
differential equation model of GC reaction, antigen limitation was           distribution (45, 51). It is assumed that one of the daughter cells

Frontiers in Immunology | www.frontiersin.org                            2                                      July 2022 | Volume 13 | Article 922318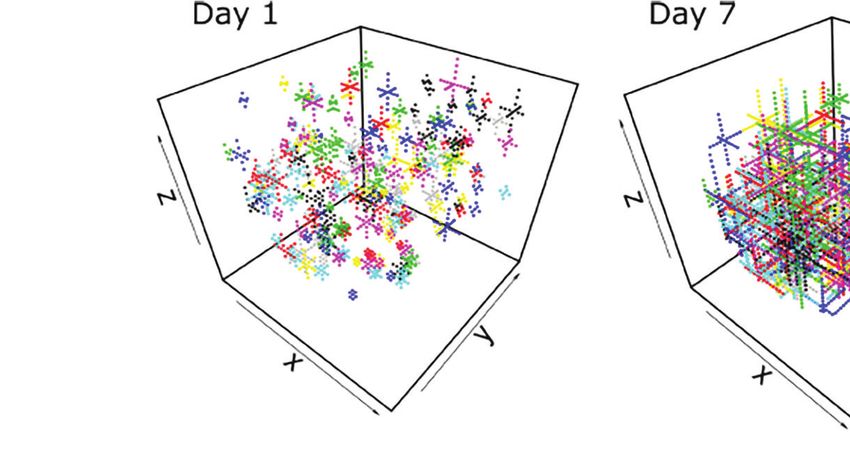
Arulraj et al.                                                                                                                        Mechanisms of GC Shutdown

r e t a i n s a n t i g e n a n d d i ff e r e n t i a t e s i n t o a n o u t p u t       single encounter with a FDC is varied relative to the total antigen
cell and the other cells switch to Unselected state and continue                           amount. In the control simulation corresponding to this
antigen collection.                                                                        mechanism, the amount of antigen consumed by GC B cell
                                                                                           was assumed to be extremely low relative to the total amount of
Alternate Assumptions Considered                                                           antigen and therefore, the decrease in antigen amount due to B
Different assumptions were considered to test the validity of the                          cell consumption was negligible.
predictions by varying the determinants of Tfh signaling
intensity and number of cell divisions.                                                    Mechanism 2: Antibody Feedback
                                                                                           Output cells exiting the GC area were assumed to differentiate
Number of Divisions                                                                        into plasma cells with a rate constant corresponding to a half-life
Number of divisions of recycling GC B cells ndiv was assumed to                            of 24 h. Plasma cells secrete antibodies at a rate of k1 = 3 x 10-18
depend either on the antigen uptake p or the Tfh signals collected                         mol per hour per cell (52). Antibodies were distributed in 11
Tsig according to the following equations.                                                 bins, that reflect differences in the affinities of antibodies
                                                                                           produced. Each bin (i) corresponds to a different koff and same
                                                    pn                                     kon thus leading to different affinities such that the dissociation
           ndiv ð pÞ = nmin + ðnmax − nmin Þ                         Equation 1
                                                 pn + K n                                  constant is in the range of 10-5.5 to 10-9.5 M. Antibodies were
                                                                                           assumed to undergo degradation with a rate constant of k2 =
                                                                                                   −1
                                                   Tsign                                  ln 2
                                                                                           14 day . The antibody concentration in each bin A(i) is diluted
       ndiv Tsig = nmin + ðnmax − nmin Þ                             Equation 2            over a volume V of 10 ml, as it is assumed to distribute
                                                 Tsign + K n
                                                                                           throughout the circulatory system and is calculated as follows.
  K is the amount of antigen captured or Tfh signals acquired
when ndiv = nmin2+nmax . We used a Hill coefficient n = 2, a                                              dAðiÞ k1
maximum number of divisions nmax = 6 and a minimum                                                             = np ðiÞ − k2 AðiÞ               Equation 4
                                                                                                           dt     V
number of divisions nmin = 1.                                                                 In this equation, np(i) is the number of plasma cells with
                                                                                           affinity corresponding to bin i.
Tfh Signaling Intensity                                                                       Masking of antigen by antibodies in Equation 4 leads to a
The Tfh signaling intensity was assumed to depend directly or
                                                                                           decrease in the free antigen concentration G FDC , while
only indirectly on the pMHC presentation of GC B cells. In the
                                                                                           dissociation of antibody increases the concentration of free
first scenario, upon successful polarization, Tfh signals Tsig =
                                                                                           antigen. Changes in the concentration of soluble antibodies by
Tmax J(p) delivered to the B cell is a function of pMHC
                                                                                           the formation of ICs is neglected. The rate of change of masked
presentation p and calculated as
                                                                                           antigen concentration CFDC follows
                                                pn
                 J = Jmin + ðJmax − Jmin Þ                           Equation 3                  dCFDC ðiÞ
                                             pn + Kpn                                                      = kon GFDC NAðiÞ − koff ðiÞCFDC ðiÞ    Equation 5
                                                                                                    dt
    with Jmin = 0, Jmax=3, n = 2 and Kp =7.1.                                                  To vary the strength of antibody feedback, a scaling factor (N)
    For the indirect dependence, Tfh signals delivered to the B cell                       is used to modulate the concentration of antibodies promoting
is simply a measure of the time period during which the Tfh cell                           feedback in the above equation. This scaling factor can be
is polarized to the B cell (J = 1). For direct and indirect                                interpreted as the number of synchronously initialized GCs
dependency, the Tfh cell polarizes towards the B cell that has                             (53, 54). In the control simulation, masking of antigen by
highest pMHC presentation in the presence of multiple                                      soluble antibodies is not considered.
interacting B cells leading to an indirect dependence of Tfh
signals on antigen collected under conditions of high B cell                               Mechanism 3: FDC Contraction
competition for Tfh help.                                                                  Length of FDC dendrites was assumed to increase at early time
                                                                                           points and decrease thereafter. At the start of the simulation, the
Implementation of Different Mechanisms                                                     length of FDC dendrites were assumed to be 5 μm. Their length
A control simulation was considered to test the ability of different                       was increased at a constant rate of 0.166 μm per hour until day 7
mechanisms to shutdown GCs. In the control, no mechanism of                                after GC onset. After day 7, the FDC dendrites were shortened at
GC shutdown is explicitly considered and decrease in free                                  a constant rate. Different values for the rate of FDC dendrite
antigen due to B cell consumption is neglected. Therefore, the                             contraction kc were considered. It is assumed that the extension
GC reaction does not terminate.                                                            and contraction of FDCs do not affect the total antigen
                                                                                           concentration on the surface of FDCs. After each FDC
Mechanism 1: Antigen Consumption                                                           extension or contraction event, the total amount of antigen in
Acquisition of antigen by B cells decreases the amount of antigen                          the FDC’s previous state was redistributed on all the FDC sites in
in the FDCs. This gradual decrease in antigen is assumed to be                             the current state. In the control simulation, growth of FDC
the cause of GC shutdown. To vary the speed of GC contraction,                             dendrites was considered as stated above but the FDC
the amount of antigen portions acquired by GC B cell upon a                                contraction rate was assumed to be 0.

Frontiers in Immunology | www.frontiersin.org                                          3                                     July 2022 | Volume 13 | Article 922318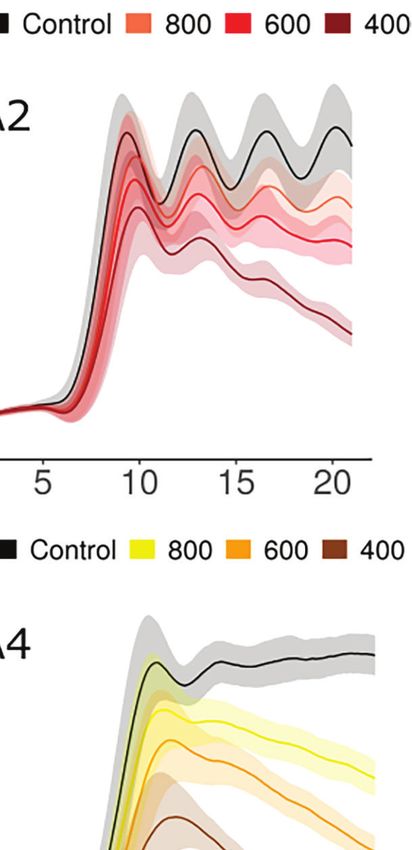
Arulraj et al.                                                                                                               Mechanisms of GC Shutdown

Mechanism 4: Ag Internalization                                                   where k (=0, 0.002, 0.003, 0.004 h-1) was varied to adjust the
Cycling of ICs in FDCs was considered in this mechanism as                     speed of GC shutdown. In the control simulations, F=0 and
implemented in (55). Antigen on FDCs is assumed to be present                  therefore, 100 % of selected cells recycle back to the DZ for cell
in either of the two states – Interior or Surface. Surface antigen             cycle re-entry.
Asurface is assumed to be available for GC B cell uptake. We
assumed that the rest of the antigen is in an internalized state               Mechanism 7: B Cell Division Capacity
Atotal-Asurface. The cycling rate constants kint =1/21 min-1 and kext          The number of divisions of GC B cells was assumed to depend on
=1/36 min-1 were estimated from PE-IC data of (56) in (55) and                 the number of DZ-LZ cycles underwent, in addition to the
are used at the start of the simulation. The amount of surface                 dependence on antigen uptake and Tfh signals acquired.
antigen on the FDCs due to internalization and externalization                    The value of K in Equations 1 and 2 was assumed to be a
varies according to                                                            function of the number of DZ-LZ cycles Ncyc and calculated as
                                                                                                                           n
     dAsurface                                                                                                            Ncyc
               = kext ðAtotal − Asurface Þ − kint Asurface Equation 6                  K = Kmin + ðKmax − Kmin Þ     n                   Equation 11
        dt                                                                                                          Ncyc   + Kkn
   As the GC progresses, kext is assumed to be modulated in a                      The value of K is minimum Kmin at the start of the simulation.
time t dependent manner according to                                           In the control simulation, the value of K remains constant and
                                                                             equal to Kmin throughout the simulation. We used n=2, Kmin = 1,
                                               tn
                 kext ðt Þ = kext ð0Þ 1 −    n                Equation 7       1, 0.5, 0 in A1-A4, respectively, and Kmax = 25, 25, 4.5, 6 in A1-
                                            t + Kextn                          A4, respectively. The value of KK (= 2, 5, 8 for A1-A3; 7, 5, 3 for
    with the Hill coefficient n= 2. kext , the time point where kext            A4) was varied in the simulations.
(t) = kext (0)/2, was varied (=100, 150, 200 h for A1; 150, 200, 250
h for A2; 60, 80, 100 h for A3; 200, 250, 300 h for A4) in the                 Calculation and Normalization of Readouts
simulations. In the control simulation, kint and Kext remain                   The average number of divisions of selected or recycled B cells
constant throughout the GC reaction.                                           were calculated at one-hour time windows during the course of
                                                                               the reaction.
                                                                                   To calculate Immune Power (IP) or efficiency of GC reactions
Mechanism 5: Tfh Signaling Capacity
                                                                               (53, 54), a test antigen concentration R =10-5 M was considered.
The intensity of the maximum Tfh signaling Tmax is assumed to
                                                                               The fraction of test antigen bound Rbound by soluble antibodies A
decrease according to the following Hill function in a time
                                                                               (i) produced from the GCs was calculated using the following
dependent manner t.
                                                                               steady state approximation which assumes that the
                                                                             concentration of test antigen is much higher than the
                                                 tn
                 Tmax ðt Þ = Tmax ð0Þ 1 −                     Equation 8       concentration of antibodies:
                                             t n + KTn
   with n=2. KT, the time point where Tmax(t) = Tmax(0)/2 , was                                                AðiÞR
                                                                                               Rbound ðiÞ =                              Equation 12
varied (= 400, 600, 800 h) to adjust the speed of GC contraction.                                             K ðiÞ + R
In the control simulation, the Tfh signaling intensity is assumed
to be constant throughout the simulation.
                                                                                                 IP =   oRbound ðiÞ                      Equation 13
                                                                                                              R
Mechanism 6: Terminal Differentiation
Tfh selected cells were assumed to differentiate to output cells
and exit the GC with probability F, without recycling to the DZ
for cell cycle re-entry. Different possibilities were considered for           RESULTS
this mechanism, where the terminal differentiation in the LZ is
antigen uptake (p), Tfh signal (Tsig) or time dependent (t). In                Mechanisms of GC Shutdown
antigen uptake and Tfh dependent terminal differentiation, the                 We performed in-silico simulations by implementing seven
probability of differentiation was calculated according to                     different mechanisms of GC shutdown (Figure 1) in the agent-
                                    Xn                                         based GC model hyphasma (45–47). Based on the primary cause
                            F= n                         Equation 9            of GC shutdown, these mechanisms can be broadly categorized
                                 X + KFn
                                                                               into four classes, namely, antigen limitation (M1-M4), Tfh help
where X=p and Tsig, respectively, and n=2. The value of KF (= 3,               limitation (M5), increased exit from the GCs (M6) and decreased
5, 9 antigen units in antigen dependent differentiation and 0.5, 1,            B cell division capacity (M7). Mechanisms M1-M4, result in
1.5 Tfh signal units in Tfh dependent differentiation) was varied              antigen limitation in different ways such as the consumption by
in the simulations. In time dependent (t) terminal differentiation,            B cells, binding of soluble antibodies, FDC contraction and
the probability of terminal differentiation follows                            antigen internalization (Figure 1).
                                                                                   In simulations, we assume that Tfh signaling intensity is
                                   F = 1 − e−kt              Equation 10       either dependent or independent of the amount of pMHC

Frontiers in Immunology | www.frontiersin.org                              4                                      July 2022 | Volume 13 | Article 922318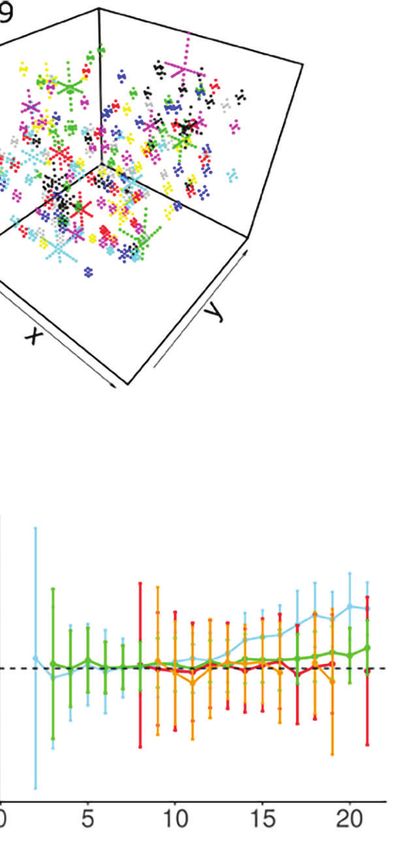
Arulraj et al.                                                                                                                                      Mechanisms of GC Shutdown

  FIGURE 1 | Schematic representation of the GC shutdown mechanisms. In mechanisms M1-M4, antigen limitation arises due to the consumption of antigen by B
  cells, masking of antigen by soluble antibodies (antibody feedback), contraction of FDC network and changes in antigen cycling rate constants leading to increased
  internalization of antigen, respectively. In M5, Tfh signaling intensity decreases leading to limiting T cell help. In M6, increased terminal differentiation of GC B cells into
  memory/plasma cells leads to increased exit from GCs. In M7, B cells have limited capacity to divide leading to decreased proliferation over time. GC, Germinal
  center; FDC, Follicular Dendritic Cell; T/Tfh, T follicular helper cell; Ab, Antibody; Ag, Antigen; PC, Plasma cell; Bm, Memory B cell; B, Germinal center B cell.

presented by GC B cells. In either assumption, when multiple B                                    In each mechanism, a control simulation was considered,
cells are interacting with a given Tfh cell, the Tfh cell polarizes                             where the GC does not shut down. This facilitates to infer the
and signals only the B cell with highest pMHC presentation (57).                                mechanistic changes during GC shutdown and also to identify
Due to such preferential polarization, there will be an indirect                                mechanisms that alone are able to induce GC shutdown.
dependence of Tfh signals acquired on pMHC presentation even
when the signaling intensity is considered to be independent of                                 Antigen Limitation (Mechanisms 1-4)
pMHC presented by GC B cells. Similarly, the number of GC B                                     Antigen accessibility or availability was hypothesized as a mechanism
cell divisions is assumed to be dictated either by pMHC                                         of GC shutdown and various potential causes of antigen limitation
presentation (antigen captured) or by Tfh signals acquired. By                                  have been identified (38, 43, 61). Firstly, antigen consumption by B
combining these alternative determinants of Tfh signaling                                       cells leads to a small decrease in the antigen amount. We performed
intensity and number of B cell divisions we consider four                                       GC simulations to test whether this antigen decrease is able to
different sets of assumptions (Table 1). These alternate                                        shutdown GCs (Figure S1). Shutdown of GCs was observed
assumptions vary in the extent of dependence of Tfh signals                                     irrespective of the assumptions in Table 1 (Figure S1A), when the
and GC B cell divisions on pMHC presentation and are each                                       contribution of apoptosis and exit exceeds proliferation (Figure S1B).
supported by experimental observations. The scenario with                                       In the control simulations, antigen decrease due to B cell
direct dependence of Tfh signaling intensity on pMHC                                            consumption was neglected, resulting in constant antigen amount
presented by GC B cells is based on the experimental                                            throughout the simulation (Figure S1C) and therefore, the GC
observations suggesting that the magnitude of Tfh signals                                       reaction did not terminate (Figure S1A, black curves). Varying the
received depend on the pMHC presentation (5, 57). In the                                        amount of antigen consumed by the B cell during a single encounter
scenario with indirect dependence, the low affinity GC B cells                                   with the FDC, altered the speed of GC contraction (Figure S1A).
are enabled to receive sufficient amount of Tfh signal in the                                        In this hypothesis, the average amount of antigen captured by
absence of higher affinity clones, an observation that is also                                   B cells was reduced (Figure S1D) due to the decreased
supported by experiments (58–60).                                                               availability of antigen. The average amount of Tfh signals

TABLE 1 | Assumptions considered for the simulations.

Assumptions                                                                       Tfh signals                                                                  No. of divisions

A1                                                                            pMHC independent                                                               pMHC dependent
A2                                                                            pMHC dependent                                                                 pMHC dependent
A3                                                                            pMHC independent                                                               Tfh signal dependent
A4                                                                            pMHC dependent                                                                 Tfh signal dependent

pMHC, peptide-major histocompatibility complex; Tfh, T follicular helper cells.

Frontiers in Immunology | www.frontiersin.org                                            5                                              July 2022 | Volume 13 | Article 922318
Arulraj et al.                                                                                                       Mechanisms of GC Shutdown

acquired per selected GC B cell increased due to alterations in            contraction of FDC dendrites was considered in the control
affinity maturation and competition with other GC B cells. In               simulations. Contraction of FDCs was sufficient to cause GC
assumptions A1 and A2, a decrease in the number of divisions               shutdown in assumptions A1, A2 and A4 (Figure 2B). In A1 and
was observed as it is assumed to depend on pMHC presentation.              A2, a decrease in antigen uptake of B cells reduced the average
Alternatively, in assumptions A3 and A4, where the number of               number of B cell divisions (Figure 2C). In A4, a small decrease in
divisions is dependent on the Tfh signals acquired, the average            fraction of selected LZ B cells was observed. Under assumption
number of divisions was not decreased but there was a small                A3, there were no observable changes in average divisions or
reduction in the fraction of selected LZ B cells, calculated as the        fraction of selected cells (Figure 2C). Consequently, there was
fraction of LZ B cells in Selected state (Figure S1D, see methods).        only a small reduction in GC volume (Figure 2B). This implies
In these simulations, the entire fraction of selected LZ B cells was       that when the number of divisions and the Tfh signaling
assumed to recycle to the DZ. Thus, a reduction in the fraction of         intensity are not directly dependent on pMHC presentation of
selected GC B cells will reduce the fraction of GC B cells that            B cells, the impact of FDC contraction is weak and is unlikely to
recycle back to the DZ. Depending on the assumptions                       cause GC shutdown independently.
considered (see Table 1), decreased antigen uptake reduced the                ICs in FDCs undergo a protective cycling mechanism (56, 63).
number of B cell divisions and/or the fraction of selected LZ B            Factors determining cycling rates are currently unknown but a
cells compared to the control simulation (Figure S1D). These               modulation in IC cycling rate constants might be expected during
results suggest that a small decrease in antigen amount is                 the GC reaction (55). By the dynamic modulation of IC
sufficient to cause GC contraction.                                         externalization rate constant, we tested whether a decrease in
    Similarly, binding of soluble antibodies can decrease antigen          surface IC amount due to changes in cycling rate constants can
access of GC B cells by a process termed antibody feedback (38),           shut down GCs (Figure S4A). This led to a decrease in surface
which has been hypothesized to be involved in GC shutdown (38,             antigen amount on FDCs (Figure S4A) and was able to shutdown
54). The strength of antibody feedback was varied using a scaling          GCs in all the assumptions (Figure S4B). Alterations in antigen
factor N that changes the concentration of antibodies promoting            uptake of B cells impacted either the number of divisions or the
feedback (Figure S2A, see methods) and compared with a                     number of selected LZ B cells (Figure S4C).
control simulation, where the soluble antibodies were not                     Collectively, M1-M4 suggest that changes in antigen
allowed to mask the antigen on FDCs. Antibody feedback led                 accessibility or availability have the potential to act as a
to GC contraction (Figure S2B), as the fraction of antigen                 primary mechanism of GC shutdown.
masked by soluble antibodies increases (Figure S2A). This
suggests that antibody feedback can independently shutdown                 Tfh Help Limitation (Mechanism 5)
GCs when the antibody concentration is high enough. Similar to             As Tfh cells undergo progressive changes in the GCs (31, 32), we
the previous case, shutdown was due to a decrease in average               tested whether changes in Tfh signaling capacity could terminate
antigen uptake of GC B cells that decreased the number of                  GCs in the absence of antigen limitation. More specifically, due
divisions and the fraction of selected LZ B cells compared to the          to the suppressive nature of Tfr cells in the GCs (34, 64–68), a
control simulation (Figure S2C). For assumption A1, the                    progressive decrease in Tfh signaling intensity was assumed in
number of divisions was decreased, and the fraction of selected            this hypothesis (Figure 3A). This mechanism was also able to
LZ B cells increased. Only a decrease in the fraction of selected          terminate GCs (Figure 3B). As in the antigen limitation models,
LZ B cells was observed in A3. Unlike in A1, the number of                 a reduction in number of divisions and fraction of selected LZ B
divisions and the fraction of selected LZ B cells were decreased           cells were observed depending on the assumptions considered
for both A2 and A4. When the Tfh signaling intensity directly              (Figure 3C). For A1 and A2, the number of divisions was not
depends on pMHC presentation (A2 and A4), a decrease in Tfh                reduced unlike in the antigen limitation models M1-M4.
signal acquisition was also observed (Figure S2C). As these                However, a decrease in the number of divisions was seen for
simulations were performed with a single epitope, we tested                A3 and A4. Therefore, changes in the Tfh help intensity in the
whether the effects of antibody feedback depend on the antigen             absence of antigen limitation is also a possible mechanism of GC
complexity by considering two epitopes in unequal proportions              shutdown. Due to the impact of this mechanism on GC B cell
(90 % for immunodominant epitope and 10 % for rare epitope).               affinity maturation and selection, it also affected antigen uptake
Similar to the simulations with a single epitope, antibody                 of GC B cells in dependence on assumptions A1-A4 (Figure 3C).
feedback led to the contraction of GCs suggesting that the role
of antibody feedback on GC shutdown persists even for antigens             Increased Terminal Differentiation
of higher complexity (Figure S3).                                          (Mechanism 6)
    The morphology of the FDC network changes during the GC                Terminal differentiation of GC B cells and exit from the GCs may
reaction (2) and alterations in aged stromal cells impact the GC           also act as the cause of GC shutdown. Although the exact
output (62). We hypothesized that a decrease in antigen                    mechanism governing the differentiation of memory and
accessibility due to changes in the area of FDC network might              plasma cells is not known, the strength of Tfh-B cell
cause GC shutdown. We modelled dynamic changes in the FDC                  interaction has been shown to determine the selected GC B cell
network by assuming that FDC dendrites extend at early stages              fate (6). We assumed that selected LZ GC B cells differentiate into
of GC reaction and contract thereafter (Figure 2A). No                     output cells (memory or plasma cells) with a probability that is

Frontiers in Immunology | www.frontiersin.org                          6                                    July 2022 | Volume 13 | Article 922318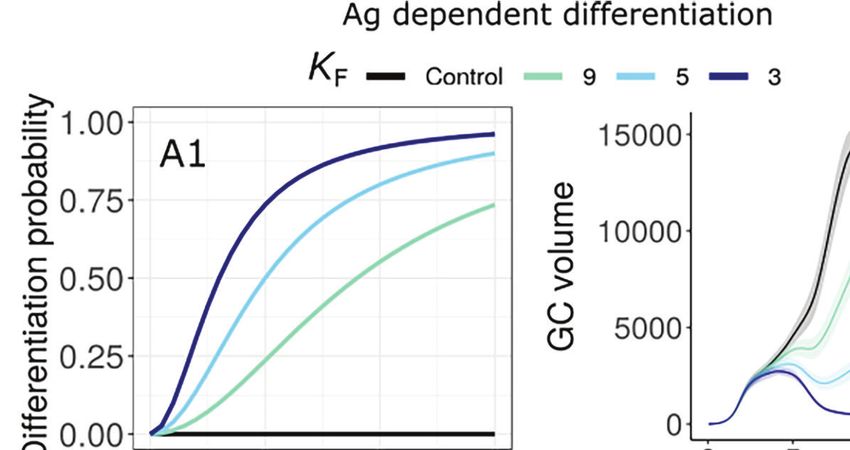
Arulraj et al. Mechanisms of GC Shutdown
A
B C
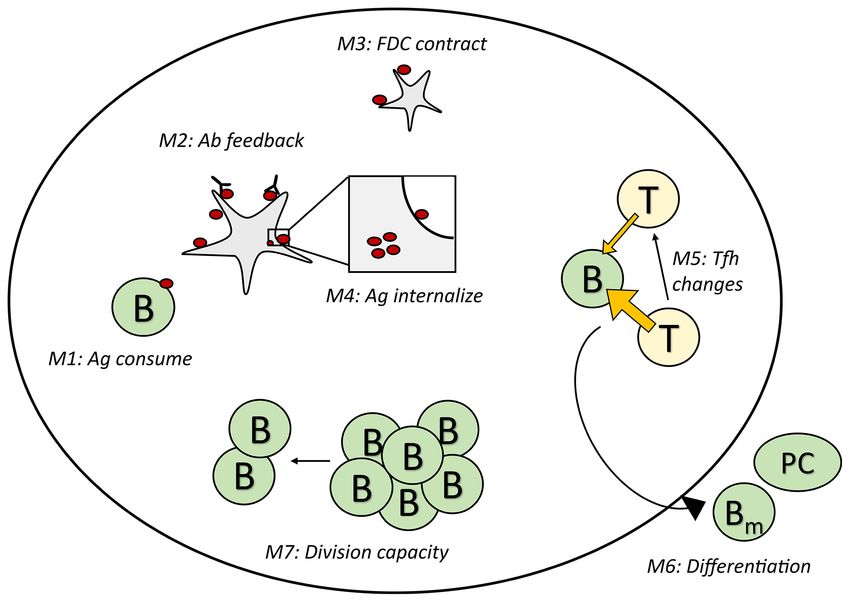
FIGURE 2 | GC shutdown due to contraction of FDCs (Mechanism 3). (A) Visualization of the FDC network in a GC simulation at 4 different time points (Days 1, 7,
13 and 19). In this representative simulation, assumption A1 (Table 1) was used with an FDC contraction rate kc of 0.166 µm per hour. Each lattice site occupied by
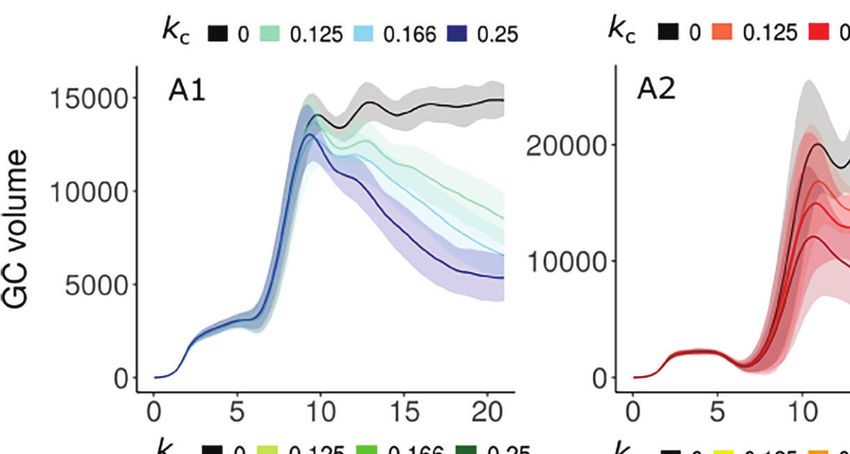
the FDC is shown as a dot. Soma and dendrites belonging to the same FDC are shown in the same color. (B) GC dynamics with assumptions A1-A4. Black curves
represent control simulations. Different colors represent different rates of FDC contraction kc as shown in the labels above panel (B) Solid lines and shaded regions
represent mean and standard deviation of 50 simulations, respectively. (C) Average antigen uptake per B cell, Tfh signals acquired per B cell, number of divisions of
recycling GC B cells and fraction of Tfh selected LZ B cells. Readouts were normalized with that of the control simulation. Colors represent the assumptions A1-A4.
Error bars represent standard deviation of 50 simulations. An FDC contraction rate of 0.166 µm per hour was used in panel (C) In all the panels, FDC extension rate
was 0.166 µm per hour. GC, Germinal center; FDC, Follicular Dendritic Cell; Tfh, T follicular helper cell; Ag, Antigen; LZ, Light Zone.
dependent on antigen uptake or Tfh signals received (Figures 4A, fatty acids varied at different time points of the GC reaction likely
B). Therefore, only a fraction of selected LZ B cells recycles to the DZ due to the exhaustion of fatty acids reserves in late GC B cells
unlike other mechanisms where all selected B cells recycle to the DZ. (69). Considering this finding, we presume that such progressive
Unexpectedly, under all the assumptions considered (A1-A4), changes in GC B cells might lead to decreased division capacity
either the GC could not be terminated or underwent premature irrespective of antigen uptake of GC B cells.
termination at a very early stage (Figures 4A, B for A1). Hence, To mimic this scenario, the division capacity of GC B cells
terminal differentiation when solely dependent on antigen uptake was assumed to decrease due to continuous circulation between
or Tfh signals is unlikely to cause GC shutdown in the absence of the GC zones. Therefore, the number of divisions was assumed to
other mechanisms that impact antigen uptake or Tfh signals. depend on the number of DZ-LZ cycles underwent by the GC B
Alternatively, it is possible that the terminal differentiation cell, in addition to the amount of antigen captured or the Tfh
depends on other unknown factors. signals acquired (Figure 5A, see methods). This mechanism led
To account for the unknown factors, we assumed that the to a decreased number of divisions over time leading to GC
probability of differentiation into output cells is time dependent shutdown (Figures 5B, C) even in the absence of alterations in
(Figure 4C). In this case, there was a progressive increase in the antigen amount on FDCs or signaling ability of Tfh cells. The
terminal differentiation of GC B cells and shutdown of GCs were fraction of selected LZ B cells and Tfh signals acquired per B cell
observed (Figure 4D). We quantified the recycling fraction as the were not reduced (Figure 5C).
fraction of selected LZ B cells that recycle to DZ. A large
reduction in the fraction of recycling cells was observed in this Experiments Proposed
mechanism due to increased exit from the GCs (Figure 4E). As Results discussed so far clearly show that mechanisms targeting
the direct dependence of differentiation on antigen uptake and various processes in the GCs can promote shutdown. Based on
Tfh signals acquired was ignored, the impact on the number of the in-silico predictions, potential experiments are suggested in
divisions was weak (Figure 4E). this section to test the proposed mechanisms.
Limited B Cell Division Capacity Density of pMHC Presentation
(Mechanism 7) Average antigen uptake of GC B cells decreases over time due to
Metabolic changes occur in B cells during the GC reaction. For the mechanism of antigen limitation. Therefore, a decrease in the
instance, the dependence of GC B cells on exogenously supplied density of pMHC presentation is expected to be associated with
Frontiers in Immunology | www.frontiersin.org 7 July 2022 | Volume 13 | Article 922318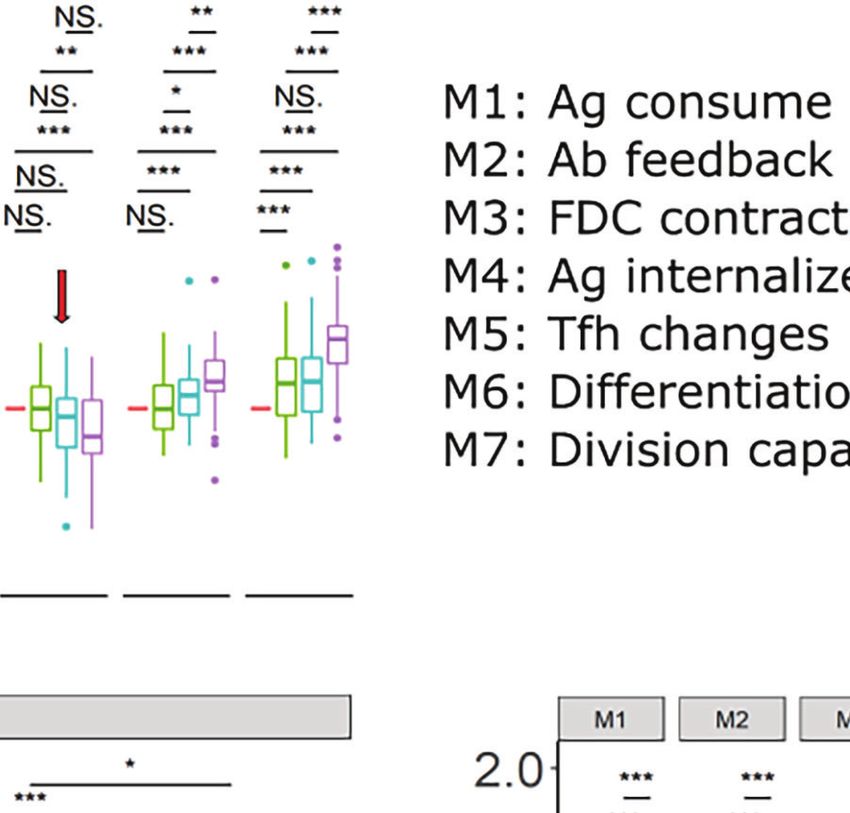
Arulraj et al.                                                                                                                             Mechanisms of GC Shutdown

                                                                           B

                             A

                             C

  FIGURE 3 | GC shutdown due to changes in Tfh signaling intensity (Mechanism 5). (A) Maximum Tfh signaling intensity Tmax vs time according to Equation 8 in
  assumptions A1-A4. Values were normalized to the maximum signaling intensity at the start of the simulation. Colors represent different values of KT and black curve
  labelled control represents the control simulation where no decrease in Tfh signaling intensity was considered. KT is the time point in hours where the maximum Tfh
  signaling intensity decreases to half of its initial value (see Equation 8, Methods sections). (B) GC dynamics in assumptions A1-A4. Black curves represent control
  simulations. Different colors represent value of KT used in Equation 8 and are shown in labels above panel (B) Solid lines and shaded regions represent mean and
  standard deviation of 50 simulations, respectively. (C) Average antigen uptake per B cell, Tfh signals acquired per B cell, average number of divisions per recycling
  GC B cell and fraction of Tfh selected centrocytes (with KT = 600). Readouts were normalized with that of the control simulation. Colors represent the assumptions
  A1-A4. Error bars represent standard deviation of 50 simulations. GC, Germinal center; Tfh, T follicular helper cell; Ag, Antigen; LZ, Light Zone.

GC contraction in mechanisms M1-M4 and might help indicate                              volume might not always decline immediately after a
the existence of antigen limitation. The decrease was confirmed                          maximum size is attained and there is a need to measure the
in silico for mechanisms M1-M4 and was not found for                                    GC volume in parallel with pMHC density to identify the GC
mechanisms M5-M7 (Figures 6A, S5-S7A). The observed                                     contraction period. This suggests that a potential way to
trend in the presented pMHC density depended on the                                     differentiate the presence of antigen limitation from other
characteristics of the GC volume kinetics: In mechanism M2                              mechanisms is to quantify the density of pMHC presentation
for assumptions A1, A2 and A4, there was an immediate                                   at different time points after the peak of the GC reaction and
decrease in pMHC density after the GC attained a maximum                                during GC contraction. As antigen uptake involves BCR
size. However, for assumption A3, the decrease in pMHC density                          crosslinking that induces changes in phosphorylation of Foxo1
was delayed after the peak GC volume was first attained and a                            (9), antigen uptake of GC B cells might be measured by such BCR
closer to maximum GC volume was maintained for a longer                                 crosslinking induced signaling changes. The experimental
period (Figure S6A). Given that the GC kinetics is sensitive to                         observation of a decrease in pMHC presentation over time
immunization conditions and experimental setups, the GC                                 during GC contraction would indicate the importance of at

Frontiers in Immunology | www.frontiersin.org                                       8                                           July 2022 | Volume 13 | Article 922318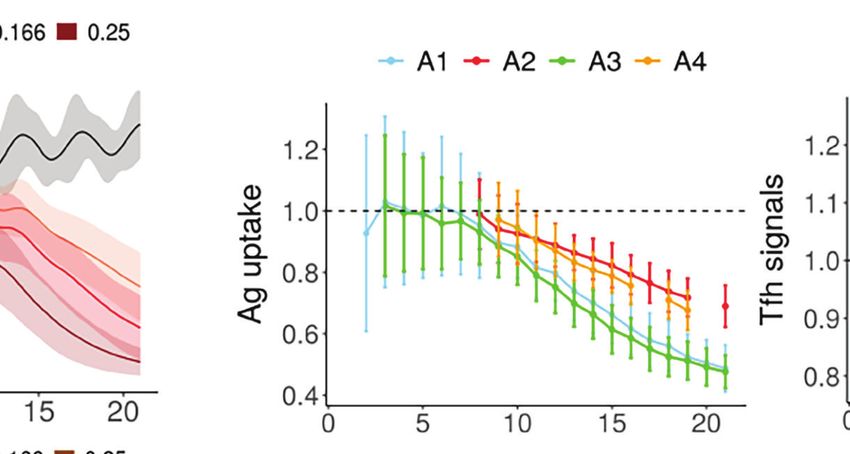
Arulraj et al.                                                                                                                                       Mechanisms of GC Shutdown

                          A                                                               D

                          B

                                                                   E

                         C

  FIGURE 4 | GC shutdown due to terminal differentiation of B cells (Mechanism 6). (A, B) Differentiation probability in antigen dependent (A) and Tfh signal dependent (B)
  terminal differentiation and corresponding GC volume dynamics. Colors represent different values of KF in Equation 9. KF is the amount of Ag captured (in antigen dependent
  terminal differentiation) or Tfh signals received (in Tfh signal dependent terminal differentiation) for half-maximal differentiation probability (see Methods). Assumption A1 was
  considered in these simulations. (C, D) Terminal differentiation probability vs time according to Equation 10 in assumptions A1-A4 for time dependent terminal differentiation
  (C). Colors represent different values of k and corresponding GC dynamics (D). Black curves represent control simulations. Different colors represent value of k in Equation
  10 and are shown in labels above (C, D) Value of k controls the increase in differentiation probability. Solid lines and shaded regions in panels A, B and D represent mean
  and standard deviation of 50 simulations, respectively. (E) Average antigen uptake per B cell, Tfh signals acquired per B cell, average number of divisions per recycling GC
  B cell and fraction of Tfh selected LZ B cells for time dependent terminal differentiation (k = 0.003). Readouts were normalized with that of the control simulation. Colors
  represent the assumptions A1-A4. Error bars represent standard deviation of 50 simulations. GC, Germinal center; Tfh, T follicular helper cell; Ag, Antigen; LZ, Light Zone.

least one of the antigen limitation mechanisms M1-M4 for GC                                       FDC-B cell interactions and antigen capture of naïve B cells in
shutdown, although it doesn’t exclude the co-existence of                                     primary follicles have been visualized by two-photon microscopy
mechanisms M5-M7. In contrast, if pMHC presentation was                                       with Phycoerythrin-labelled antigen and CFSE/CFP labelled B
found to increase over time or to remain constant, this would                                 cells (70). A similar analysis monitoring the fraction of FDC
support mechanisms M5-M7 to be responsible of GC shutdown.                                    encounters resulting in successful antigen capture needs to be
                                                                                              performed at different time windows spanning the GC reaction.
Fraction of Successful Antigen Acquisition Events                                             Provided that antigen limitation is a critical mechanism of GC
In the FDC contraction mechanism (M3), antigen limitation is                                  shutdown, an increasing fraction of successful antigen uptake
due to a reduced number of B cell- FDC encounters. However, in                                events over time would support the FDC contraction mechanism
the other antigen limitation mechanisms there is a decrease in                                M3 while a decreasing fraction would support M1, M2 or M4.
the number of B cell-FDC encounters with successful antigen
capture (Figures 6B, S5-S7B). Quantifying the fraction of FDC                                 FDC Network Size per B Cell
encounters with successful antigen acquisition can help identify                              The FDC network size per B cell was calculated by dividing the
the cause of decreased antigen access and can differentiate                                   total number of lattice sites occupied by the FDC network by the
the FDC contraction mechanism from other antigen                                              total number of GC B cells, which can be interpreted as a
limiting mechanisms.                                                                          measure for the GC space occupied by FDCs.

Frontiers in Immunology | www.frontiersin.org                                             9                                              July 2022 | Volume 13 | Article 922318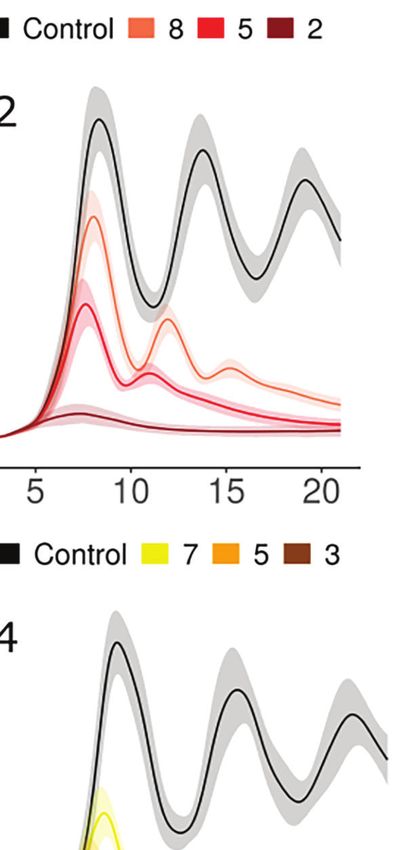
Arulraj et al.                                                                                                                                      Mechanisms of GC Shutdown

                                                                            B
                              A

                               C

  FIGURE 5 | GC shutdown due to limited B cell division capacity (Mechanism 7). (A, B) K vs number of DZ-LZ cycles according to Equation 11 (A) and GC dynamics (B)
  for assumptions A1-A4. Colors represent different values of KK as shown above the panels and black curves represent the control simulation. KK controls the increase in K
  with increasing number of DZ-LZ cycles. The value of K determines the dependence of the number of divisions on the amount of antigen captured in assumptions A1/A2 or
  Tfh signals acquired by B cells in A3/A4 (see Methods). Solid lines and shaded regions represent mean and standard deviation of 50 simulations, respectively. (C) Average
  antigen uptake per B cell, Tfh signals acquired per B cell, average number of divisions per recycling GC B cell and fraction of Tfh selected LZ B cells (with KK = 5). Readouts
  were normalized with that of the control simulation. Colors represent the assumptions A1-A4. Error bars represent standard deviation of 50 simulations. GC, Germinal center;
  Tfh, T follicular helper cell; Ag, Antigen; DZ, Dark zone; LZ, Light zone.

   In the absence of FDC contraction, the FDC network size per                                FDC Antigen Distribution
B cell decreases until the GC volume attains a peak and increases                             The IC cycling rate constants determine the fraction of ICs
thereafter. However, in the presence of FDC contraction, the                                  on the FDC surface which is defined as the ratio of IC amount on
FDC network size per B cell decreases or remains constant after                               the FDC surface, and the total antigen amount retained
the peak of the GC reaction (Figures 6C, S5–S7C). The FDC                                     in the FDC. The fraction of ICs on the FDC surface is
network can be visualized by staining for complement receptor                                 expected to remain constant if the IC cycling rate constants are
CD35 (70). Similar labelling and measurement of the FDC                                       constant throughout the GC reaction. Modulations of IC cycling
network size per B cell would be able to detect changes in the                                rate constants as proposed in mechanism M4 will lead to
FDC morphology. A reduced or constant FDC network size per                                    differences in the distribution of ICs on the FDC’s surface and
B cell after the peak of the GC volume would indicate the                                     interior during the GC reaction such that the fraction of ICs on
contraction of FDCs while an increase in FDC network size                                     the FDC surface decreases over time (Figures 6D, S5-S7 D). This
per B cell would exclude this mechanism.                                                      can be observed by monitoring the amount of antigen on the

Frontiers in Immunology | www.frontiersin.org                                            10                                              July 2022 | Volume 13 | Article 922318
Arulraj et al. Mechanisms of GC Shutdown
A B C
D E
F G H
FIGURE 6 | Proposed experiments to identify the existence of mechanisms (in assumption A1). (A) pMHC density of selected centrocytes, (B) Fraction of
successful antigen uptake events among all FDC-B cell encounters, (C) FDC network size per B cell, (D) Fraction of Ag on FDC surface, (E) Tfh signals received
by selected centrocytes, (F) Average number of divisions of recycling centrocytes, (G) Fraction of output cells among Tfh selected cells, (H) GC volume in all
mechanisms. All readouts were normalized with respect to (w.r.t) the value at the peak of the GC reaction. Different colors represent the different time points with
respect to GC reaction peak. The FDC network size per B cell was calculated by dividing the total number of lattice sites occupied by FDCs by the total number
of GC B cells. Statistical tests were performed by Wilcoxon test. Error bars represent standard deviation of 50 simulations. Red arrows indicate a decreasing
trend in readouts that differs from other mechanisms. Parameter values used in different mechanism: M1: 1 unit of Ag consumption per FDC-B cell interaction,
M2: N=300, M3: FDC contraction rate = 0.166 µm per hour, M4: Kext =150, M5: KT = 600, M6: k = 0.003, M7: KK = 5. GC, Germinal center; Tfh, T follicular
helper cell; Ag, Antigen; Ab, Antibody; FDC, Follicular dendritic cell. * = p < 0.05, ** = p < 0.01, *** = p < 0.001. NS, not significant.
FDC’s surface and interior at multiple time points of the GC as a proxy for Tfh signals in the simulations. c-Myc expression
reaction. Normalization of surface antigen amount with the total levels of c-Myc+ GC B cell subpopulations have been previously
antigen amount in FDCs would be necessary as there would be a examined (72). Similar analysis has to be performed at multiple
decrease in the total antigen amount due to consumption by B time points to detect any decrease in Tfh signaling strength
cells or other reasons. Even though IC cycling was not considered during GC contraction.
in mechanisms other than M4, it is expected that the fraction of However, in assumptions A1 and A4, only a subtle decrease in
ICs on the FDC surface will remain constant in other Tfh signals was seen that was not statistically significant. In
mechanisms in the presence of IC cycling with a constant rate addition, a decrease in Tfh signals is also seen in the case of
constant. Thus, measuring the distribution and localization of antigen limitation models depending on the assumptions
antigen on the FDC surface at different stages of the GC reaction (Figures S5E, S7E). Therefore, it should be noted that the
can be used as a test for the existence of changes in IC cycling rate measurement of Tfh signal acquisition might not always be
constants. A decrease in the fraction of ICs on the FDC surface conclusive. A decrease in Tfh signals combined with an
during the GC reaction would suggest an increased IC increased or constant pMHC density would support M5, but a
internalization while a constant fraction of ICs on the surface decrease in pMHC density or the absence of a significant
would indicate a lack of modulation of the IC cycling decrease in Tfh signals do not necessarily exclude M5.
rate constant.
Quantifying Average Divisions
Decreased Tfh Signals A decrease in the average number of divisions is observed in
In mechanism M5, due to reduced Tfh signaling, a decrease in many mechanisms including antigen or Tfh help limitation, and
Tfh signals acquired by GC B cells was observed over time reduced B cell division capacity (Figures 6F, S5-S7F). Due to
(Figures 6E, S5-S7E). Expression of Myc is proportional to the this, mechanisms proposed in this study cannot be distinguished
strength of Tfh signaling (71). Therefore, c-Myc levels might act easily by measuring the average number of divisions over time.
Frontiers in Immunology | www.frontiersin.org 11 July 2022 | Volume 13 | Article 922318Arulraj et al. Mechanisms of GC Shutdown
However, a decrease in the average number of divisions potential to give rise to GC-derived B cell lymphomas. Thus, a
combined with an absence of changes that indicate the better understanding of GC shutdown has a wide range of
existence of other mechanisms as shown in Figures 6, S5-S7 applications from enhancing antibody responses to blocking
suggest the presence of mechanisms that affect the B cell division the progression of B cell lymphomas and ectopic GCs. In this
capacity directly, as in M7 (Figures 6F, S5-S7F). Previously, a study, we tested potential mechanisms of GC shutdown in-silico,
transgenic strategy with tTA-H2B-mCh (transactivator (tTA) to identify the most promising target mechanisms that are self-
protein and histone H2B-mCherry fusion protein) was used to sufficient to contract GCs. To facilitate experimental analysis of
monitor the number of GC B cell divisions (73). these mechanisms, we suggest potential experimental setups
based on the in-silico predictions.
Fraction of Cells With Differentiation Markers In all of the mechanisms identified, from antigen limitation to
When the GC shutdown is based on increased exit of cells due to reduced B cell division capacity, GC shutdown was ultimately
differentiation, an increase over time in the fraction of Tfh caused by a decrease in either the number of B cell divisions or
selected cells with differentiation markers can be expected reduced recycling to the DZ or both. Gitlin et al., demonstrated
when quantified around the peak of the GC reaction that GC B cell divisions are proportional to antigen uptake and
(Figures 6G, S5-S7G). Precursors of memory and plasma cells pMHC presentation to Tfh cells (73). But, the exact relationship
have been shown to specifically express markers CCR6 (7) and between pMHC presentation and number of divisions was only
BLIMP-1 (74), respectively. A combination of markers including approximated in computer simulations based on data about the
CXCR4, CD86, CD69, CD23 and CD21/35 have been shown to ratio of DZ and LZ B cells (47), as the mechanistic details linking
distinguish potential output cells from recycling B cells in a antigen capture and number of divisions are only partly
heterogenous c-Myc+ GC B cell population (72). Quantifying the understood. Tfh cells induce Myc transcription factor in GC B
fraction of cells with these markers can be considered as a test for cells in direct proportion to the amount of antigen captured (71).
increased terminal differentiation and exit mechanism. No But as the Myc expression is transiently downregulated,
experimentally observed increase in the fraction of output cells subsequent activation of CyclinD3 is important (75), that
after the GC volume peak would exclude this mechanism M6 to controls the number of cell divisions in a dose-dependent way
contribute to GC shutdown. (76). Post-transcriptional regulation of Myc transcripts by
epigenetic modulators may also affect the B cell division
Implications on GC Output capacity by controlling the stability of Myc transcripts (77). A
In general, GC shutdown decreases the total output production better understanding of factors that control GC B cell divisions
and extent of affinity maturation. We tested whether any of the and factors inducing cell cycle re-entry would be highly beneficial
shutdown mechanism accelerated affinity maturation or for a mechanistic understanding of GC shutdown. In view of M7,
produced more output cells within a restricted period of time. whether the ability of GC B cells to proliferate decreases after a
Changes in quantity and quality of output were largely long period of stay in the GC due to exhaustion or limited energy
dependent on the assumptions considered (Figure S8) and supply also needs to be investigated. GC shutdown due to
were also sensitive to the strength of shutdown stimulus reduced B cell division capacity optimizes the immune power
(not shown). and would be a rather efficient way of limiting the duration of the
To combine the effects of changes in quality and quantity, GC response, thus, also limiting potential dysregulations.
efficiency of GC reaction was estimated by a quantity termed Furthermore, outcome of the shutdown mechanisms was
immune power (IP) that mimics an ELISA test (53, 54). sensitive to the set of assumptions considered for the
Mechanisms M6 and M7 (increased terminal differentiation determinants of Tfh signal intensity and the number of B cell
and decreased B cell division capacity) led to an increased GC divisions. Although there is considerable evidence for the
efficiency suggesting that these mechanisms of shutdown would dependence of productive B-Tfh cell interactions on pMHC
be beneficial in accelerating output production and antibody presentation (5), the extent of dependence is unclear. It has been
responses under most assumptions (Figure 7). On the other suggested that altering the pMHC presentation does not alter the
hand, mechanism M5 (Tfh signal changes) consistently had a competitive fitness and certain extent of permissiveness is observed
suppressive effect. For antigen limiting mechanisms M1-M4, an in the selection process that allows the low affinity B cells to persist
increase in GC efficiency was seen only under assumption in the GCs (58, 59). An unproven hypothesis reconciling those
A1 (Figure 7). observations is that Tfh signaling adapts its intensity in dependence
of experienced levels of pMHC presentation (11). As the four sets of
assumptions considered (A1-A4) appear consistent with present
DISCUSSION experimental observations, the most realistic among these could not
be determined. This suggests a need for future studies in clarifying
Although GC shutdown is an important determinant of the these assumptions under different experimental settings.
quality and quantity of antibody responses, mechanisms of GC Different mechanisms altering antigen availability or
shutdown are poorly understood. Premature GC shutdown can accessibility were identified as self-sufficient mechanisms of GC
impair the protection against invading pathogens or reduce the shutdown. Ability of antigen consumption by B cells to cause GC
efficacy of vaccinations and lack of GC shutdown has the shutdown varied depending on the amount of antigen captured
Frontiers in Immunology | www.frontiersin.org 12 July 2022 | Volume 13 | Article 922318Arulraj et al. Mechanisms of GC Shutdown
A B
C D
FIGURE 7 | Fold change in efficiency (IP) of GC reaction under different mechanisms of shutdown. Panels (A–D) represent assumptions A1-A4, respectively. IP was
calculated using equation 13 at day 21 of the GC simulation and fold change was calculated with respect to the IP of the corresponding control simulation. Error bars
represent standard deviation of 50 simulations. Positive and negative values represent an increase and decrease, respectively, compared to the control simulation.
Parameter values used in different mechanism: M1: 1 unit of Ag consumption per FDC-B cell interaction, M2: N=300, M3: FDC contraction rate = 0.166 µm per hour,
M4: Kext =150, 200, 80 and 250 in assumptions A1-A4, M5: KT = 600, M6: k = 0.003, M7: KK = 5. GC, Germinal center; Tfh, T follicular helper cell; Ag, Antigen; Ab,
Antibody; FDC, Follicular dendritic cell; IP, Immune Power.
by B cells relative to the total antigen amount on FDCs. results support the possibility that antigen limitation might be a
Therefore, consumption of antigen by GC B cells has a great major factor involved in GC shutdown in the case of
potential to terminate GCs at least under antigen limiting immunization with non-replicating agents. Therefore, testing
conditions, without the need to exhaust the total antigen for the signs of antigen limitation could be considered as a first
amount on FDCs. Further, we suggested numerous ways in step in the analysis of GC shutdown mechanisms. Decreased
which changes in antigen accessibility might occur despite the antigen uptake of GC B cells in any of the antigen limiting
presence of sufficient antigen in the FDC network. In-silico mechanisms is expected to be reflected in the density of pMHC
simulations suggested the potential of antibody feedback in presentation, and a time course analysis of pMHC density at
terminating GCs. Antibody feedback as a mechanism of GC different stages of GC reaction might help identify the presence
shutdown is an attractive option because it self-regulates the of antigen limitation. Differentiating the effects of antigen
necessity of continuation of the GC response by monitoring limitation due to antigen consumption of B cells versus antigen
success of the GC reaction right in the GC area. Dynamic masking by soluble antibodies could be technically challenging
changes in FDC network by the contraction of FDCs (2) was and needs to be addressed in the future.
capable of contracting GCs and might be tested by the Similar to the slow decrease in antigen by B cell consumption,
measurement of FDC network size per B cell. We speculated natural decay of antigen or clearance from the surface of FDCs
that the FDC-IC cycling rate constants is modulated during GC might also play a role in GC shutdown. The rate of decrease
reaction and this mechanism could terminate GCs. Modulation might vary depending on the nature of antigen and might
of IC cycling rate constant could be tested by the measurement of contribute to the differences in GC lifetime observed with
the fraction of FDC-ICs displayed on the FDC surface. These different antigens (15–17). Apart from B cells, other cell types
Frontiers in Immunology | www.frontiersin.org 13 July 2022 | Volume 13 | Article 922318You can also read