International Markets 360 Well-being Study - 2021 Global Report - Global Index & Impacted Groups - Cigna Singapore ...

Page created by Tiffany Mueller
 
CONTINUE READING
International Markets 360 Well-being Study - 2021 Global Report - Global Index & Impacted Groups - Cigna Singapore ...
International Markets
                      360 Well-being Study
                      2021 Global Report
                      - Global Index & Impacted Groups -
IM Insight & Kantar
June 2021
International Markets 360 Well-being Study - 2021 Global Report - Global Index & Impacted Groups - Cigna Singapore ...
Contents

1.   Introduction
2.   Executive Summary & Major Themes
3.   Health & Well-Being Index
4.   Specific Impacted Populations
5.   Appendix

2
International Markets 360 Well-being Study - 2021 Global Report - Global Index & Impacted Groups - Cigna Singapore ...
Foreword

The 360 Well-being Study is uniquely positioned to understand how Covid-19 has affected people. It is the
longest longitudinal study of its kind, assessing a complete view of Whole Health across every generation
across the globe. This is a powerful tool because the impact of Covid -19 has been so varied from generation
to generation, and country to country. With the 360 Well-being Study, we are able to pinpoint similarities and
differences in how different generations were affected by the pandemic and glean findings that may support
Health & Well-being going forward.

In addition to the annual surveys, we also took quarterly ‘pulse’ surveys that chart how the world responded
to the disease in real time. These pulses are a proxy for the journey that the world took in understanding the
implications of the disease and point to a surprising resilience and optimism as we find our way out.

With both the annual surveys and quarterly pulse data, the 360 Well-being Study examines Covid-19 in
context and by viewing it through a longer lens is able to understand short-term responses to the pandemic
and see how this event has transformed our attitudes to Health & Well-being moving forward.

3
International Markets 360 Well-being Study - 2021 Global Report - Global Index & Impacted Groups - Cigna Singapore ...
2021 expanded our understanding of health and explored new behaviors under the 'new normal', while
expanding geographical coverage.
                        Target Age & Market Reach                                                       Thought-leadership
                                                                                                                                                                 Globally
                                                                                                                                                                 Mobile
                                                                                                                                                                    +
                                                                                                                                                                 Virtual
                                                                                                                                                                 Health
                                                                                                                                                                    +
                                                                                                                                     Heart      Healthcare        New
                                                                                                                                     Health     Affordability   Priorities

                                                                                                                                       +             +              +
                                                                                                                    Accessibility                                WFH &
                                                                                                                                     Health
                                                                                                          Digital        &                         NCD          Employer
                                                                                                                    Affordability     Tech                       Support

                                                                                                            +            +             +
                                                                                                                                     Stress &
                                                                                                                                                     +              +
                                                                                                        Workplace   Workplace                                    Whole
                                                                                                                                    Workplace   Loneliness
                                                                                                        Wellness    Wellness        Wellness                     Health
2015 (aged 25+^): China, Thailand, UK, South Korea, New Zealand, Hong Kong                                  +            +             +             +
                                                                                                                                                 Stress &
                                                                                                                                                                    +
2016 (aged 25+^): + Taiwan, Indonesia, India, Turkey, Spain                           Ad Hoc   Ad Hoc     Age          Age           Aging &                     Stress &
                                                                                                                                                 Workplace
2017 (aged 25+^): + Singapore, UAE                                                    Topics   Topics     Trap         Trap         Readiness    Wellness       Resilience
2018 (aged 25+^): + US, Canada (removed i n 2021), Mexico (removed i n 2019-            +        +          +            +             +             +              +
2020), Brazil (removed i n 2019-2020), Australia, France (removed i n 2021),
                                                                                      Index    Index     Index        Index          Index        Index          Index
Germany (removed i n 2020 & a dded ba ck in 2021), Saudi Arabia, South Africa
(removed i n 2020), Nigeria (removed i n 2020)
2019 (aged 25+^): + Benelux (removed i n 2020 & a dded ba ck in 2021+)                2015     2016      2017         2018           2019         2020           2021
2020 (aged 18+#): + Kenya
2021 (aged 18+): + Japan
    ^ except UK and Turkey where 18 years old and above were covered
4   # general population in Spain was covered; only working population in 2015-2019
    + Luxembourg was not covered in 2021
International Markets 360 Well-being Study - 2021 Global Report - Global Index & Impacted Groups - Cigna Singapore ...
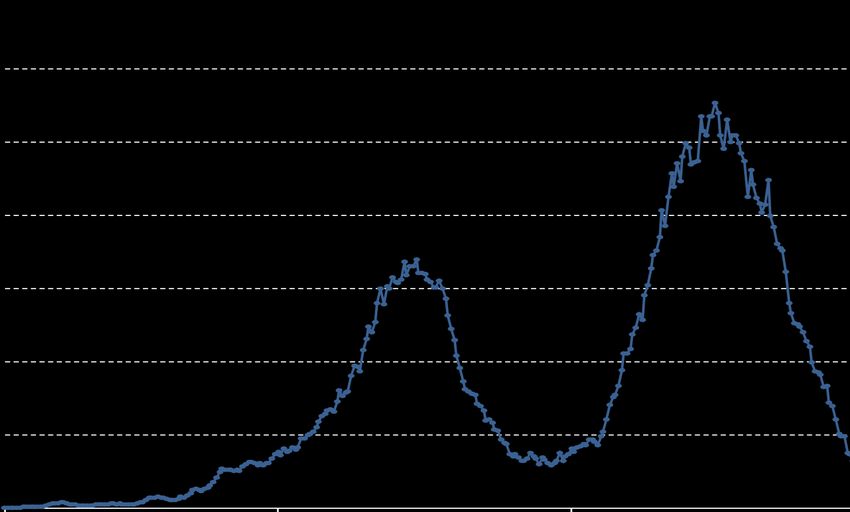
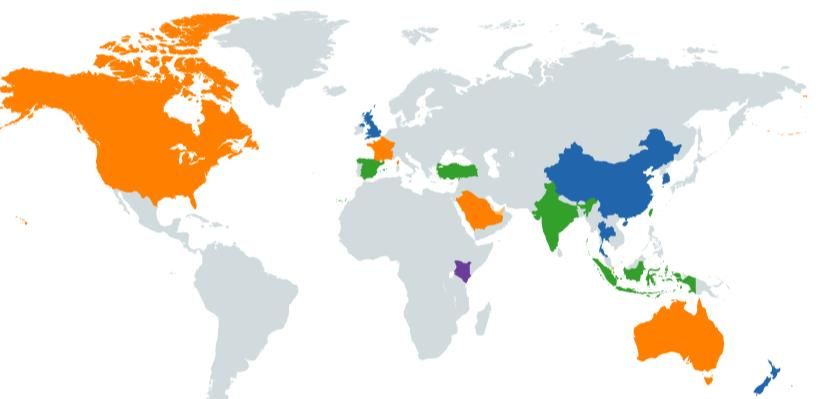
Study Coverage - 2021 Flagship Study

                    Market coverage & age target: 21 markets, aged 18 or above

             US CA MX BR UK ^ ES # FR DE BE NL TR^ KSA AE KE NG ZA CN HK TW KR JP TH IN ID SG AU NZ
 Sample
             1503                        1200   1004           404    203    203   1003   503   1002   501   1001   1004 1201     1203   1004   1200 1000      500   1001    400   1003
   size

2021
2020 Pulse
  Impact

2020
2019
2018
2017
2016
2015
                                                                                                                    Highlight in b lu e/gray = Markets covered in that respective year

                Talked to 18,043 people;                                             Online questionnaire from                                       20 minute
                Boosted on Globally Mobile in                                        25 Mar – 17 Apr, 2021                                           survey
                US and Europe

        ^ except UK and Turkey where 18 years old and above were covered in 2015-2019
5       # general population in Spain was covered; only working population in 2015-2019
International Markets 360 Well-being Study - 2021 Global Report - Global Index & Impacted Groups - Cigna Singapore ...
Executive Summary
International Markets 360 Well-being Study - 2021 Global Report - Global Index & Impacted Groups - Cigna Singapore ...
Covid-19 has been an inflection point for the world, forcing us to adapt in ways never imagined, but there may
be a light at the end of the tunnel…

One year after the beginning of the global Covid-19 pandemic, the world’s health and well-being is still in a state of turmoil. The
most recent results of the Cigna 360 Health & Well-being Index (March-April 2021), reveals the overall index and the five sub-
indices that represent various elements of well-being are all significantly below pre-pandemic levels.

In 2020, the impact of the Covid-19 pandemic on health and well-being was immediate. Cigna’s early pulse surveys showed a hit
to well-being as early as April 2020 with Financial and Social indices falling as markets reacted to the shock of the spread of
Covid-19 and social distancing measures were adopted (to varying degrees) around the world.

By June 2020, the overall well-being index had fallen by 1.2 points* as the world realized the pandemic would be a presence for
some time to come and we struggled to cope with what that meant.

But the impact has not been uniform and the 360 Well-being Study and is Pulse waves are uniquely positioned to shine a light
on how the pandemic has impacted different populations in different ways.

    * Pulse 8 Markets
7
International Markets 360 Well-being Study - 2021 Global Report - Global Index & Impacted Groups - Cigna Singapore ...
Covid-19 has been an inflection point for the world, forcing us to adapt in ways never imagined, but there may
be a light at the end of the tunnel…

The sense of isolation and disconnection caused by repeated lockdowns, social distancing and working from home affected
many of us in very specific ways.

For example, the stronger Social well-being^ showed by Generation Z and Millennials (those aged 18-35) suggests they were
able to maintain social connections with friends, perhaps because of their greater digital maturity, while older generations (those
aged 50+) generally missed face-to-face connections with friends and coworkers, and this impacted their health and well-being.

Parents with young children appeared to find solace in the family unit (Family well-being has enhanced from last year), creating
stronger connections and perhaps a renewed sense of purpose during these troubled times (despite the extra stress they were
experiencing).

Parents whose children had already ‘left the nest’ and those without children reflected their increased loneliness in lower
resilience and well-being scores.

Women also bore a greater burden of the negative impact the pandemic brought to health and well-being scores, with many of
the metrics# used to measure this, scoring lower among women.

    * Pulse 8 Markets
8   ^ including ‘having time for myself’, ‘spending sufficient time with friends’, ‘feeling part of a bigger group or community’
    # including Physical, Social and Financial well-being
International Markets 360 Well-being Study - 2021 Global Report - Global Index & Impacted Groups - Cigna Singapore ...
Covid-19 has been an inflection point for the world, forcing us to adapt in ways never imagined, but there may
be a light at the end of the tunnel…

Although the experience of Covid-19 has forced us to adapt and overcome challenges, it has also provided unexpected
opportunities.

Work from home caused isolation, but it also freed people from their daily commutes and helped some with work-life balance.
It also facilitated a new focus on mental health and well-being, with more people than ever changing their attitudes towards
seeking help and support in this regard.

Doing things remotely is more accepted, and this has witnessed an increase in the use of virtual health consultations.

And as we write this in June 2021, are we seeing the bounce back we have been waiting for? Our 360 Well-being Index bounced
back 1.2 points*, a significant rebound from December last year (although still below pre-pandemic levels).

It remains to be seen if this is a false dawn, but we will continue to take the world’s pulse, and better understand humanity ’s
journey through the pandemic and uncover the resilience and determination the world has shown in the face of adversity.

9   * Pulse 8 Markets
International Markets 360 Well-being Study - 2021 Global Report - Global Index & Impacted Groups - Cigna Singapore ...
Major Themes:
Global Index and Impacted Groups
Summary                              Covid-19 has most affected the finances of those entering (Gen Z) and preparing to
                                     leaving the workforce (pre-retirees).

                                           One of the first effects of Covid-19 was financial instability. As entire industries dwindled into non-
Financial ability to meet                  existence (airlines, hospitality, F&B), the thought on everyone’s minds has probably been ‘am I next?’.
expenses of my / my family’s               Financial well-being was one of the first casualties, dropping 1 point between January and April 2020*,
hobbies or vacations                       and the rest of the year witnessed a steady decline hitting a drop of 2.8 points by December 2020.
%

                 30                  35    Those most impacted by this have been Gen Z (aged 18-24), who are entering the workforce, and the
 25       19               24   20         pre-retirees (aged 50-64), who are close to retiring from the workforce. Gen Z are facing physical
                                           obstacles - for instance, an inability to interview face-to-face or finish their studies on time - that are
 All     Aged Aged Aged Aged Aged
                                           delaying their ability to find financial stability. Pre-retirees find themselves with more job instability and
         18-24 25-34 35-49 50-64 65/+      fewer opportunities just when they are looking to put the finishing touches on their retirement nest egg,
                                           which in turn creates a sense of financial insecurity in the midst of economic volatility.
I have job stability
%                                          Pre-retirees may also be hampered in their job prospects as digital natives have more relevant skills, as
 60       61     64        59   56   63    remote working becomes more acceptable.

                                           Unexpectedly, Financial well-being has seen a significant uptick (2.8 points) between December 2020
                                           and March/April 2021, returning to its level as at January 2020. There are many potential factors at play
 All     Aged Aged Aged Aged Aged          here - sustained government financial support, reduction in household spending, bullish stock markets,
         18-24 25-34 35-49 50-64 65/+      or merely vaccine optimism?

       * Pulse 8 Markets
11
Health & Well-being
Index 2021

12
Headlines                             Health and Well-being measures are still significantly down after a year of pandemic.
                                      Compared to January last year, all indices show the impact of Covid-19, especially the
                                      Social index, reflecting the unique response required to combat the virus.
GLOBAL

                                                                                                                vs. 2020
                                                                                                               21 markets
          69.1                                                            68.5
     70                                                                          67.9
                                         67.5                                              Work                   -0.6         -0.4
                                                                          66.1   65.5
          64.9                           65.1
                                                                                           Family                 -0.6         -0.1
                                                                          63.1
Index

                                          63.0                                   61.6
        61.2                                                                               Social                 -1.5         -0.9
                                         62.0                            62.2
          60.6
          57.9
                                                                                 61.3      360 INDEX -0.9                      -0.4
                                         59.0                             58.8   58.2      Physical               -0.6         -0.2

                                         54.8                             54.8
                                                                                 54.1      Financial              -0.7         -0.2
          53.2
     50
       2018                              2019                             2020   2021

        Base: All respondents – 2018/2019/2020/2021 (14467/13200/17148/18043)                     Higher/Lower at 95%
13                                                                                                significance vs. last year
Headlines                            But when comparing data collected during the pandemic, we see a different and perhaps
                                     slightly more positive story emerge.
                                     Benchmarked against responses collected in December last year, we see a directional
GLOBAL
(8 MARKETS IN PULSE                  upswing in all Health and Well-being indices and a significant improvement in the
/ ALL MARKETS IN                     Physical and Financial index. Is the world seeing a light at the end of the tunnel or is this
FLAGSHIPS)
                                     another false dawn?
                                                                                                                                    vs. 2020-Dec vs. 2020-Jan
                                                                                                                                      Pulse Wave 5   Flagship

                         69.0
 70.068.5                                67.9             68.2            68.3             67.9        67.9      Work                      -           -0.6
         66.1            66.9                             65.9
                                         65.1                             65.4             65.1        65.5
                                                                                                                 Family                 +0.4           -0.6
         63.1                                             61.8
Index

                          62.4           61.4                             61.4             61.3        61.6
                                                                                                                 Social                 +0.3           -1.5
        62.2            62.5                             61.6                                                    360 INDEX +0.4                        -0.9
          58.8
                                         61.3                             61.5            60.9        61.3
                         59.3
                                         58.0             58.0            58.3                         58.2      Physical               +0.8           -0.6
                                                                                           57.4

         54.8            54.8                             54.6            54.5                                   Financial              +1.1           -0.7
                                         54.1                                                          54.1
                                                                                           53.0
 50.0
 (FS) 2020-Jan        2020-Apr         2020-Jun        2020-Aug         2020-Oct        2020-Dec    (FS) 2021-
                        (W1)             (W2)            (W3)             (W4)            (W5)       Mar/Apr

        19 markets                                 8 Pulse markets                                  21 markets

        Base: All respondents – 2020/2020 Pulse W1-W5/2021 (17148/1221/2287/2320/2265/2253/18043)                       Higher/Lower at 95%
15                                                                                                                      significance vs. last year
Health &                                 Financial well-being and Social well-being were the first casualties of the pandemic.
Well-being                               Both stayed in the doldrums for much of the pandemic and have only recently shown
Index                                    signs of improvement (Q1 this year).

PULSE 8
MARKETS
                                                                                                                                                                            vs. 2020-Dec vs. 2020-Jan
                                                                                                                                                                              Pulse Wave 5   Flagship

                         69.0
 70.068.7                                    67.9                68.2                 68.3                67.9                68.5
                                                                                                                                                     Work                       +0.6           -0.2
     66.3                66.9                                    65.9                                                         66.2
                                              65.1                                    65.4                65.1
                                                                                                                                                     Family                     +1.1           -0.1
        63.2                                                      61.8                                                        61.8
Index

                           62.4               61.4                                    61.4                61.3                                       Social                     +0.5           -1.4
        62.5            62.5                                     61.6                                                        62.1                    360 INDEX +1.2                            -0.4
                                             61.3                                    61.5                60.9
         58.7             59.3
                                                                                      58.3                                    58.6
                                              58.0                58.0                                    57.4                                       Physical                   +1.2           -0.1
        55.8                                                                                                                  55.8
                         54.8                                    54.6                 54.5                                                           Financial                  +2.8             -
                                              54.1
                                                                                                          53.0
 50.0
 (FS) 2020-Jan        2020-Apr             2020-Jun           2020-Aug             2020-Oct            2020-Dec            (FS) 2021-
                        (W1)                 (W2)               (W3)                 (W4)                (W5)               Mar/Apr
                      ‘The virus won’t   ‘How dare you tell ‘If I wear a mask, will ‘If we do this short ‘This virus will never ‘It’s been wearing a mask and
                      affect me’         me what to do!’    the virus go away?’ lockdown, will the go away. We’re stuck working from home – I can
                                                                                    virus go away’       with it forever’       accept the new normal’

        Base: All respondents – 2020/2020 Pulse W1-W5/2021 (8983/1221/2287/2320/2265/2253/8915)                                                                 Higher/Lower at 95%
17      Quotes are Kantar’s modification on Scott Berinato’s analogy on five stages of grief                                                                    significance vs. last year
Health &                                 Other measures such as Work, Family and Physical remained resilient at the onset of the
Well-being                               pandemic but when the longevity of the situation became evident, all fell.
Index                                    They climbed back slightly as WFH, schooling from home, spending more time with
                                         family and other new behaviors became more habitualized.
PULSE 8                                  But they dropped again in Dec last year as time and the perceived slow pace of vaccine
MARKETS                                  implementation dragged on. But well-being indices have staged a budding bounce
                                         back at the end of the first-quarter this year.
                                                                                                                                                                         vs. 2020-Dec Pulse vs. 2020-Jan
                                                                                                                                                                                   Wave 5     Flagship
                         69.0
 70.068.7                                    67.9                68.2                 68.3                67.9                68.5
                                                                                                                                                     Work                      +0.6             -0.2
     66.3                66.9                                    65.9                                                         66.2
                                              65.1                                    65.4                65.1
                                                                                                                                                     Family                    +1.1             -0.1
        63.2                                                      61.8                                                        61.8
Index

                           62.4               61.4                                    61.4                61.3                                       Social                    +0.5             -1.4
        62.5            62.5                                     61.6                                                        62.1                    360 INDEX +1.2                             -0.4
                                             61.3                                    61.5                60.9
         58.7             59.3
                                                                                      58.3                                    58.6
                                              58.0                58.0                                    57.4                                       Physical                  +1.2             -0.1
        55.8                                                                                                                  55.8
                         54.8                                    54.6                 54.5                                                           Financial                 +2.8                -
                                              54.1
                                                                                                          53.0
 50.0
 (FS) 2020-Jan        2020-Apr             2020-Jun           2020-Aug             2020-Oct            2020-Dec            (FS) 2021-
                        (W1)                 (W2)               (W3)                 (W4)                (W5)               Mar/Apr
                      ‘The virus won’t   ‘How dare you tell ‘If I wear a mask, will ‘If we do this short ‘This virus will never ‘It’s been wearing a mask and
                      affect me’         me what to do!’    the virus go away?’ lockdown, will the go away. We’re stuck working from home – I can
                                                                                    virus go away’       with it forever’       accept the new normal’

        Base: All respondents – 2020/2020 Pulse W1-W5/2021 (8983/1221/2287/2320/2265/2253/8915)                                                           Higher/Lower at 95%
18      Quotes are Kantar’s modification on Scott Berinato’s analogy on five stages of grief                                                              significance vs. last year
Headlines                   Has the world been experiencing the five stages of grief over the last year?
                            We are experiencing a major trauma and many indicators point to a global and shared
                            response to that, denial, anger, bargaining, depression and acceptance.

 Scott Berinato (Harvard Business Review, March 2020) theorized the pandemic was causing populations to undergo a form of massgrief for the life
 we used to have. The five stages of grief according to the Kübler-Ross model are: denial, anger, bargaining, depression and acceptance. Pulse data
 collected during 2020 seems to support this model, and perhaps gives us optimism going forward:

 Flagship / Pulse Date   360 Well-being Index    Change in Index*     S tage of Grief       Modified from Berinato’s Analogy
 January 2020            62.5                                         Pre-pandemic
 April 2020              62.5                    -                    Shock & Denial        ‘The virus won’t affect me’
 June 2020               61.3                    -1.2                 Anger                 ‘How dare you tell me what to do? What do you mean I
                                                                                            have to wear a mask?’
 August 2020             61.6                    +0.3                 Bargaining            ‘If I wear a mask, will the virus go away?’
 October 2020            61.5                    -0.1                 Bargaining            ‘If we do this short lockdown, will the virus go away?’
 December 2020           60.9                    -0.6                 Depression            ‘This virus will never go away. We’re stuck with it forever.’
 March 2021              62.1                    +1.2                 Acceptance            ‘It’s been wearing a mask and working from home – I can
                                                                                            accept the new normal.’

     * Pulse 8 markets
19
Headlines                  What could be next?

 Although each of the countries surveyed responded differently to the pandemic, the pulses show that by and large the world went through
 similar shifts at similar times - as we all learned simultaneously about Covid-19 and its effects, prevention and cause. In a single year, the
 world went from ignorance of viruses to understanding how different vaccines work. This sense of shock and eventual understanding is
 captured well by the study - and while it may be a form of grief for a lifestyle that may have disappeared, it may also simply be a proxy for
 how people process an unfathomable event.

 This model also allows us to raise a few questions:

 If we are now in the acceptance phase, does this mean that we have already adapted to the new normal? Or instead are we confident that
 the vaccines will bring about a return to the ‘old normal’? Under the Kübler-Ross model, the stages are not necessarily linear - we can
 repeat stages or they can appear out of order. As new waves of Covid-19 continue to occur, will we be repeating this cycle of grief?

 Instead of acceptance, are vaccines the magic bullet that will take us out of this cycle? Vaccine uptake has been particularly high in
 countries more affected by Covid-19 (USA, UK) than others who controlled the spread better (Australia, Hong Kong, Singapore) - does
 accepting the new normal mean that some accept vaccines and others accept social distancing? Does this mean that 360 Well- being will
 diverge based on the country’s success rate in either containment or vaccination?

20
Health & Well-                          Although the drop in well-being scores has been felt across the board, not all
     being Index                             demographic groups have been impacted equally. Our data highlights some groups are
                                             more impacted than others Females, 18–24-year-olds, experiencing restricted access to
     GLOBAL                                  university or the job market, 50-64-year-olds struggling to improve their nest egg, non-
     - By demographic                        workers (particularly the unemployed), and those working with older kids or without kids
                                             all show lower well-being scores.

  vs.
 2020     -0.9             -0.6             -1.0            -1.0             -0.5             -0.7             -1.9            -0.5        -0.6         -1.2                  -       -0.9         -1.1
80
                        Gap b/n gender from 2018 – 2021:                                                                                           Unemployed:
                        0.7  1.3  1.8                                                                                                             51.7 (-2.0)
                                                                                                                                                                        66.2
                        62.2                                               64.1                                              62.2        62.9
          61.3                           60.4             60.7                             60.9                                                                                     61.5
                                                                                                            58.7                                                                                 59.1
60                                                                                                                                                   56.8

40
          Total           Male           Female            18-24            25-34           35-49            50-64            65/+       Working   Non-Working         Working      Working    Working w/o
                                                                                                                                                                     w/kids
Health & Well-                          Although at a global level, Health and Well-being indices remain below pre-Covid-19
  being Index                             levels, the story at the country level is more complex with some markets showing signs of
                                          improving Health and Well-being indices.
  GLOBAL                                  Anecdotally, we know that some countries are doing better at containment, better at
  - By market vs. 2020                    vaccination or struggling with both.
                                          Let’s take a look at individual countries in the context of their specific challenges.

^Data collection for India: 25 Mar – 7 Apr (before COVID spike)

Gap      +4.0 +1.6^ +0.4 +0.8                      -2.6      +0.4       +1.1       -0.4 +0.2            NA      -1.7     -2.5     NA         -1.4     -1.3    -2.4       -1.0   -0.8       +0.4     NA
80
           75.1                                                                                   Global average:                                                                                  2021
                     73.2
        71.1       71.6                                                                              61.3 ( -0.9)                                                                                  2020
                               66.2       65.9    66.3
                             65.8       65.0        63.8
                                                           62.9
                                                               63.3      62.8       62.5      62.2      62.1   62.8      62.7
                                                                       61.6     63.0       62.0                  61.1     60.2     60.1    61.259.8 60.5
                                                                                                                                                       59.2 60.4
                                                                                                                                                               58.0    57.8
 60                                                                                                                                                                      56.8 56.755.9
                                                                                                                                                                                            54.0
                                                                                                                                                                                         53.6       53.2

                                                                                                       NA                        NA                                                                NA
40
         Saudi      India      UAE     Chinese Indonesia       USA      Spain     Thailand Australia Germany    New        UK    Benelux    Kenya   Singapore Turkey     Hong   Taiwan     Korea   Japan
         Arabia                        mainland                                                                Zealand                                                   Kong

        Base: All respondents in respective markets
  22                                                                                                                                          NA: not surveyed in 2020
        Highlight in green/red = significantly higher/lower than last year at 99% significance level
Health & Well-being Index
- Individual dimensions
Health &                                  The Social index has been especially hit hard since pre-pandemic with drops in spending
Well-being                                time with friends, spending the right amount of time online and in having many friends
Index                                     we can talk openly with.
                                          On the bright side, there has been bounce back vs. December 2020 in spending time
                                          with friends and feeling a part of the broader community.
SOCIAL
       Social Index -1.5

                                                    Excellent / Very Good (%)                            2019                    2020-Jan/Feb                   2020-Dec               2021

Spending sufficient time in-person with my friends                                                         24                         28                               20               23

Having time for myself, e.g. time for hobbies                                                              29                         37                               35               36

Feeling I am part of a broader group or
                                                                                                          NA                          26                               22               25
community other than my family^
Spending 'just the right' amount of time on
                                                                                                          NA                          32                               29               30
smartphone / tablet to keep myself connected^

I have many friends who I can talk openly with (%)                                                         24                         22                               18               19

     B1K. How well do you think you are performing in the following regarding your social health and well-being?
                                                                                                                   ^ new statement    Higher/Lower at 95% significance vs. last year
26   B2K. Do you have one or more close friends to whom you talk openly?
     Base: All respondents (excluding NA) – 2019/2020-Jan/Feb/2020-Dec/2021 (11625/10012/2205/17471)               in 2020            Higher/Lower at 95% significance vs. Dec, 2020
Health &                                      The impact on Social well-being is felt across the board but is pronounced among those
     Well-being                                    previously identified impacted groups; women, those aged 50-64 (pre-retirees), those
     Index                                         that are not working (especially the unemployed) and those working without kids or with
                                                   older kids.
     SOCIAL

80

                                                                       64.5                                                                                                                                      65.5
          61.6          62.4                            63.1                                                          62.7            62.6                                            63.1               62.1
                                       60.8                                            60.6                                                                                                                                  60.8       59.7
                                                                                                      58.7                                            58.7
60                                                                                                                                                                   54.6

40
          Total           Male          Female           18-24          25-34           35-49           50-64            65+          Working      Non-Working Unemployed Working Male               Working      Working      Working Working w/o
                                                                                                                                                                                                     Female     w/kids under w/kids 18+ yo kids
                                                                                                                                                                                                                    18 yo
                                                              Higher/Lower at 95% significance vs. last year                          Higher/Lower at 95% significance vs. total

          B1K. How well do you think you are performing in the following regarding your social health and well -being?
     27   Base: All respondents – 2020/2021 (17148/18043); Male (8695/9064); Female (8440/8968); 18-24 (1947/2068); 25-34 (4578/4641); 35-49 (6240/6440); 50-64 (3655/3833); 65+ (728/1061);
          Working (12974/13379) – Male (7091/7230), Female (5878/6143), with kids
Health &                                  Among females, well-being across all the attributes that comprise our index are
Well-being                                impacted. And post millennials are perhaps being affected more so because of their
Index                                     lower engagement with socializing online.
                                          Retirees seem to be more cushioned in terms of their social well-being.
SOCIAL

                                                Excellent / Very Good (%)                   Total            Male            Female             18-24        25-34           35-49   50-64   65/+
Spending sufficient time in-person with my
                                                                                               23               24                23                31           32           21      14      20
friends

Having time for myself, e.g. time for hobbies                                                  36               37                36                42           40           32      33      51

Feeling I am part of a broader group or
                                                                                               25               26                24                29           33           24      16      23
community other than my family^
Spending 'just the right' amount of time on
                                                                                               30               32                29                28           35           29      28      34
smartphone / tablet to keep myself connected^

I have many friends who I can talk openly with                                                 19                21               17                20           24           19      15      13

                                                                                                                                  ^ new statement        Higher/Lower at
                                                                                                                                  in 2020                95% significance
     B1K. How well do you think you are performing in the following regarding your social health and well-being?                                         compared to total
28   Base: All respondents (excluding NA) (17471); Male (8777); Female (8684); 18-24 (2013); 25-34 (4561); 35-49 (6311); 50-64 (3655); 65/+ (931)
Health &                                     And looking at the Social index among working profiles, we find that having work tends
Well-being                                   to have a more positive impact on Social well-being (especially among men, even if
Index                                        having time for hobbies suffers).
                                             And despite the popular perception that parents with younger children are suffering
                                             hardships related to online schooling, their Social well-being is more positive than others,
SOCIAL                                       suggesting spending time with younger children has brought benefits.
                                                                                                                                                                                    Working     Working
                                                                                                              Non-                 U n-              Working         Working                              Working
                           Excellent / Very Good (%)                   Total             Working                                                                                    w/kids      w/kids
                                                                                                             Working             employed             Ma le          Fe male                              w/o kids
                                                                                                                                                                                    < 18 yo     18+ yo
Spending sufficient time in-person with
                                                                          23                  25                   19                  13                 26           25                  31     18        20
my friends
Having time for myself, e.g. time for
                                                                          36                  36                  38                   31                 36           36                  38     34        33
hobbies
Feeling I am part of a broader group or
                                                                          25                  27                   19                  14                 28           26                  35     20        20
community other than my family^
Spending 'just the right' amount of time
on smartphone / tablet to keep myself                                     30                  32                  26                   21                 33           30                  39     29        24
connected^

I have many friends who I can talk
                                                                          19                  21                   14                  13                 22           19                  26     18         16
openly with

                                                                                                                                                   ^ new statement     Higher/Lower at
                                                                                                                                                   in 2020             95% significance
                                                                                                                                                                       compared to total
     B1K. How well do you think you are performing in the following regarding your social health and well -being?
29   Base: All respondents (excluding NA) (17471); Working (13114) – Male (7093), Female (6015), with kids
Health &                            At an overall level, sufficient sleep decline has driven the lower performance of the
                                    Physical well-being index.
Well-being
                                    Conversely, one of the few upsides of the pandemic has been an improved ability to
Index                               manage diet and engage in regular exercise, thereby minimizing the overall
                                    decline. Moreover, compared to December 2020, there seems to be a nascent bounce
PHYSICAL                            back across most Physical well-being measures.

       Physical Index -0.6

                                 Excellent / Very Good (%)                      2019                    2020-Jan/Feb                             2020-Dec             2021

Getting sufficient sleep at night                                                 33                             34                                    30              30

Having good sleep quality                                                          31                            32                                    28              31

Being at a healthy weight                                                         28                             29                                    26              29

Eating a balanced diet                                                            28                             28                                    25              29

Exercising on a regular basis                                                     26                             25                                    25              28

                                                                                                                     Higher/Lower at 95% significance vs. last year
                                                                                                                     Higher/Lower at 95% significance vs. Dec, 2020

     A1K. How well do you think you are performing in the following regarding your physical health and well-being?             ^ new statement
31   Base: All respondents – 2019/2020-Jan/Feb/2020-Dec/2021 (13200/17148/2253/18043)                                          in 2020
Health &                                   Compared to pre-pandemic levels, Physical well-being has deteriorated and again, is felt
     Well-being                                 most keenly among those more impacted groups; women, those aged 50-64 (pre-
     Index                                      retirees) and those working without kids.

     PHYSICAL

80

                                                                   61.2                                                                                                                              62.4
                       59.5                         58.8                                                                      59.4                                        60.4
60        58.2                       56.8                                         57.3                         58.2                                                                      58.2                     57.4
                                                                                                55.5                                         54.7                                                                              56.0
                                                                                                                                                            51.8

40
          Total          Male         Female          18-24         25-34          35-49          50-64           65+         Working     Non-Working Unemployed Working Male            Working     Working      Working Working w/o
                                                                                                                                                                                         Female    w/kids under w/kids 18+ yo kids
                                                                                                                                                                                                       18 yo

                                                                                                                             Higher/Lower at 95% significance vs. last year                    Higher/Lower at 95% significance vs. total

          A1K. How well do you think you are performing in the following regarding your physical health and well-being?
     32   Base: All respondents – 2020/2021 (17148/18043); Male (8695/9064); Female (8440/8968); 18-24 (1947/2068); 25-34 (4578/4641); 35-49 (6240/6440); 50-64 (3655/3833); 65+ (728/1061);
Health &                             But again, women’s well-being is shouldering a heavier burden and pre-retirees are
Well-being                           reporting lower scores vs. the total and vs. pre-pandemic levels. Gen X (aged 35-49)
Index                                claim lower levels of well-being vs. the total but are on par with pre-pandemic numbers.
                                     Although on par with last year, Millennials (aged 25-34) claim better well-being numbers
                                     than the total.
PHYSICAL

               Excellent / Very Good (%)                Total              Male             Female               18-24             25-34              35-49          50-64   65/+

Getting sufficient sleep at night                         30                 32                 29                  31                36                 28           26      32

Having good sleep quality                                  31                33                 29                 33                 37                 29           25      30

Being at a healthy weight                                 29                  31                27                 35                 37                 28           21      24

Eating a balanced diet                                    29                 30                 27                 28                 33                 27           24      35

Exercising on a regular basis                             28                  31                25                 27                 33                 27           24      27

                                                                                                                                                 Higher/Lower at
                                                                                                                                                 95% significance
     A1K. How well do you think you are performing in the following regarding your physical health and well-being?               ^ new statement compared to total
33                                                                                                                               in 2020
     Base: All respondents (18043); Male (9064); Female (8968); 18-24 (2068); 25-34 (4641); 35-49 (6440); 50-64 (3833); 65/+ (1061)
Health & Well-                            As seen in the Social well-being scores, working seems to provide a form of
being Index                               shield against weakening Physical well-being in the face of Covid-19, even
                                          improving women’s reported scores on this index.
PHYSICAL                                  There also seems to be a dividend of having younger children in Physical well-
                                          being.

                                                                                                                                                                          Working        Working
                                                                                         Non-                 U n-               Working              Working                                      Working
       Excellent / Very Good (%)                 Total             Working                                                                                                w/kids         w/kids
                                                                                        Working            e mployed              Ma le               Female                                       w/o kids
Health &                                  Declines in Family well-being scores vs. pre-pandemic are more pronounced among
     Well-being                                women but as opposed to other well-being indices, are fairly consistent with the total.
     Index                                     Pre-retirees again experience a greater drop in Family well-being scores than others.
                                               Also, the presence of younger children has a positive impact on the Family well- being
                                               index.
     FAMILY

80
                                                                                                                                                                                                    70.8
                                                                   67.8                                        66.4           66.3                                        66.6           65.9                   66.5
          65.5         65.7          65.3           64.3                          65.3
                                                                                                63.2                                         63.1
                                                                                                                                                            58.7                                                           60.4
60

40
          Total          Male         Female          18-24         25-34          35-49          50-64          65/+         Working     Non-Working Unemployed Working Male            Working     Working      Working Working w/o
                                                                                                                                                                                         Female    w/kids under w/kids 18+ yo kids
                                                                                                                                                                                                       18 yo

                                                                              Higher/Lower at 95% significance vs. last year                      Higher/Lower at 95% significance vs. total
          C2K. How well do you think you are performing in the following regarding your family health and well-being?
     35   Base: All respondents – 2020/2021 (17148/18043); Male (8695/9064); Female (8440/8968); 18-24 (1947/2068); 25-34 (4578/4641); 35-49 (6240/6440); 50-64 (3655/3833); 65+ (728/1061);
Health &                              The overall decline in the Family well-being index is driven by concern around the
Well-being                            amount of time one can spend with the family and concern around children's education.
Index                                 This is somewhat mitigated by better performance around taking care or parents' and
                                      spouse's well-being, feelings around such, returning to pre-pandemic levels.
FAMILY

       Family Index -0.6

                                                                              Excellent / Very Good (%)                  2019               2020-Jan/Feb                   2020-Dec     2021
 Amount of time I can spend with my family                                                                                   42                       43                           40    41
 Quality of time I can spend with my family^                                                                                 NA                        41                          40   42
 Being able to take care of my parents' health and well-being                                                                35                       34                           32   36
 Being able to take care of my spouse/ partner’s health and well-being                                                       45                       43                           44   45
 Being able to take care of my child/ children’s health and well-being                                                       49                       48                           47   48
 My child/ children’s education                                                                                              45                       48                           46   47
 Having a close-knit family where we emotionally support each other^                                                         NA                       44                           42   44

                                                                                                                 ^ new
     C2K. How well do you think you are performing in the following regarding your family health and well-being? statemen         Higher/Lower at 95% significance vs. last year
36   Base: All respondents (excluding NA) – 2019/2020-Jan/Feb/2020-Dec/2021 (9365/11856/1647/11725)                               Higher/Lower at 95% significance vs. Dec, 2020
                                                                                                                 t in 2020
Health &                                  Women’s well-being scores in the Family index are closer to men than other indices. Pre-
Well-being                                retirees claim the lowest scores in this index with lower scores across all measures vs pre-
Index                                     pandemic.
                                          Millennials aged 25-34 are the most optimistic (although still at pre-Covid-19 levels) and
                                          Gen Zs are less engaged with many of the attributes in this index.
FAMILY

                                                                            Excellent / Very Good (%)            Total        Male          Female           18-24    25-34        35-49   50- 64   65/+

 Amount of time I can spend with my family                                                                          41           41                42          41       47            41    37       39

 Quality of time I can spend with my family^                                                                        42           41                42          40       46            41    38       44

 Being able to take care of my parents' health and well-being                                                       36           37                34          36       42            34    29       36

 Being able to take care of my spouse/ partner’s health and well-being                                              45           46                43          41       49            44    41       52

 Being able to take care of my child/ children’s health and well-being                                              48           47                49          41       55            50    41       41

 My child/ children’s education                                                                                     47           46                48          40       52            47    42       44

 Having a close-knit family where we emotionally support each other^                                                44           44                44          39       49            44    40       47

                                                                                                                                                    ^ new statement   Higher/Lower at
     C2K. How well do you think you are performing in the following regarding your family health and well-being?
37                                                                                                                                                  in 2020           95% significance
     Base: All respondents (excluding NA) (11725); Male (6158); Female (5563); 18-24 (947); 25-34 (3192); 35-49 (4824); 50-64 (2358); 65/+ (404)
                                                                                                                                                                      compared to total
Health &                                  Although seemingly counter-intuitive, working and higher levels of Family well-
Well-being                                being are congruent in a Covid-19 world where lockdowns are a part of parcel of
Index                                     a professional life. Men and women's reported well-being in the Family index
                                          shows lower levels of disparity than other indices and again, we see a clear
                                          benefit in the Family well-being index of having younger children.
FAMILY
                                                                                                                                                                               Working       Working
                                                                                                         Non-               U n-              Working          Working                                 Working
                             Excellent / Very Good (%)               Total           Working                                                                                   w/kids        w/kids
                                                                                                        Working           employed             Ma le           Fe male                                 w/o kids
Health &                           Clearly, the impact of the pandemic is still being felt in the Financial well-being index, still
Well-being                         lagging behind January 2020 – general financial situation, ability to pay for mortgage/
                                   housing and ability to pay for self/ family’s education.
Index
                                   But, there has been a strong rebound vs. December 2020 a rally perhaps influenced by
                                   the cumulative effect of government subsidies, roll out of vaccination programmes and a
FINANCE                            general feeling of things getting better since December 2020.

     Financial Index -0.7
                                                                                     Excellent / Very Good (%)         2019         2020-Jan/Feb 2020-Dec                    2021
Current financial situation                                                                                             24                     23                       19   22
Financial ability to meet expenses of my / my family’s hobbies or holidays/vacations^                                  NA                      26                       22   25
Having sufficient money for retirement                                                                                  20                     19                       15   19
Financial ability to pay for mortgage/ housing                                                                          29                     29                       28   26
Financial ability to pay for self/ family’s education                                                                   29                     28                       25   26
Financial ability to meet my/ my family’s medical needs                                                                 25                     25                       19   25
Financial security in case of emergencies / if I am unable to work                                                      20                     23                       20   22
Maintaining current standard of living                                                                                  26                     26                       22   28
Impact of economic environment on my financial situation and planning                                                   19                     19                       15   20

     D2K. How well do you think you are performing in the following?                                 ^ new statement   Higher/Lower at 95% significance vs. last year
39   Base: All respondents (excluding NA) – 2019/2020-Jan/Feb/2020-Dec/2021 (11084/14262/1747/14496) in 2020           Higher/Lower at 95% significance vs. Dec, 2020
Health &                                   But, as with other indices, the impact across the population has not been even.
Well-being                                 Females and pre-retirees are again reporting lower well-being scores (both vs. last year
Index                                      and vs. the total sample).
                                           And yet again, the presence of younger children is associated with better performance
                                           even in the Financial well-being index.
FINANCE

                                                                                                           60.1                                                                                59.5
                 55.4                                         56.5                                                       55.8                                        56.7           54.9
     54.1                       52.8                                         53.7           51.9                                                                                                           54.0        51.7
                                               50.7                                                                                     49.0
                                                                                                                                                      39.3

     Total          Male         Female          18-24         25-34          35-49          50-64          65/+         Working     Non-Working Unemployed          Working        Working     Working      Working Working w/o
                                                                                                                                                                      Male          Female    w/kids under w/kids 18+ yo kids
                                                                                                                                                                                                  18 yo

                                                                        Higher/Lower at 95% significance vs. last year                     Higher/Lower at 95% significance vs. total

     D2K. How well do you think you are performing in the following?
40   Base: All respondents – 2020/2021 (17148/18043); Male (8695/9064); Female (8440/8968); 18-24 (1947/2068); 25-34 (4578/4641); 35-49 (6240/6440); 50-64 (3655/3833); 65+ (728/1061);
Health &                                  Women are feeling more financially insecure than men across all attributes that comprise
Well-being                                this index (anecdotally we know that women are more likely to be engaged in casual/ part
Index                                     time work). Anxiety is also seen among Gen Z as they see their prospects of joining the
                                          work force diminish vs. last year. A similar phenomenon is evident among pre-retirees as
                                          they focus on the health of their nest egg.
FINANCE                                   Retirees report better Financial well-being scores than others but still on par with last year.

                                                                 Excellent / Very Good (%)                 Total          Male          Female            18-24     25-34 35-49 50-64         65+
 Current financial situation                                                                                  22             24              20              18       27            21   18   31
 Financial ability to meet expenses of my / my family’s hobbies
                                                                                                              25             27              23              19       30            24   20   35
 or holidays/vacations^
 Having sufficient money for retirement                                                                       19             21              17              13       23            18   16   31
 Financial ability to pay for mortgage/ housing                                                               26             28              25              20       30            26   23   39
 Financial ability to pay for self/ family’s education                                                        26             28              24              23       31            26   21   29
 Financial ability to meet my/ my family’s medical needs                                                      25             27              23              19       30            24   21   34
 Financial security in case of emergencies / if I am unable to
                                                                                                              22             24              21              19       28            21   17   33
 work
 Maintaining current standard of living                                                                       28             30              26              25       34            26   23   38
 Impact of economic environment on my financial situation and
                                                                                                              20             22              18              18       26            19   14   23
 planning
                                                                                                                                                                    Higher/Lower at
     D2K. How well do you think you are performing in the following?                                                                              ^ new statement
41                                                                                                                                                                  95% significance
     Base: All respondents (excluding NA) (14496); Male (7404); Female (7084); 18-24 (1709); 25-34 (4141); 35-49 (5640); 50-64 (2611); 65/+ (395) in 2020
                                                                                                                                                                    compared to total
Health &                                 Working empowers women in Financial well-being and even though there is still a
Well-being                               disparity with men in terms of the Financial well-being, the gap is less than other indices
Index                                    (apart from Family and of course, Work).
                                         And the advantage of having younger kids is evident across all attributes in the Financial
                                         well-being index.
FINANCE
                                                                                                                                                                              Working       Working
                                                                                                           Non-              U n-             Working          Working                                Working
                                Excellent / Very Good (%)                  Total         Working                                                                              w/kids        w/kids
                                                                                                          Working          employed            Ma le           Female                                 w/o kids
                                                                                                                                                                              < 18 yo       18+ yo
 Current financial situation                                                 22               25               15                 6                26              23             31          20         19
 Financial ability to meet expenses of my / my
                                                                             25               27               18                 8                29              26             33          24         21
 family’s hobbies or holidays/vacations^
 Having sufficient money for retirement                                      19               21               14                 5                22              19             27          17         14
 Financial ability to pay for mortgage/ housing                              26               29               19                 7                30              27             34          24        22
 Financial ability to pay for self/ family’s
                                                                             26               29               16                 7                30              28             35          24        20
 education
 Financial ability to meet my/ my family’s
                                                                             25               28               18                 8                29              26             35          24        20
 medical needs
 Financial security in case of emergencies / if I
                                                                             22               24               16                 6                26              23             30          19         19
 am unable to work
 Maintaining current standard of living                                      28               31               21                 8                32              29             37          26        24
 Impact of economic environment on my
                                                                             20               22               13                 6                24              20             29          17         16
 financial situation and planning
                                                                                                                                                                        Higher/Lower at
     D2K. How well do you think you are performing in the following?                                                                             ^ new statement
42                                                                                                                                                                      95% significance
     Base: All respondents (excluding NA) (14496); Working (11403) – Male (6281), Female (5118), with kids
Health &                                 Work well-being remains significantly below pre-pandemic levels and like Social, has not
Well-being                               even rallied vs. December last year.
Index                                    Workload, relationships with colleagues, job stability, career development and satisfaction
                                         with salary and benefits are all below January 2020 levels.
WORK

         Work Index              -0.6
                   Strongly Agree / Agree ( #(Strongly) Disagree / Neither) (%)                               2019              2020-Jan/Feb                  2020-Dec             2021
     I have a reasonable workload/ working hours                                                                62                      63                            64            60
     I maintain a good relationship with my supervisor                                                          67                      68                            69            68
     I maintain good relationships with my coworkers                                                            76                      77                            79            74
     I have job stability                                                                                        61                     63                            63            60
     I have good career development                                                                             48                      49                            49            46
     I have good work-life balance                                                                              60                      61                            62            60
     I have work-related stress#                                                                                50                      48                            46            49
     I have a satisfactory salary package / work benefits                                                       NA                      43                            43            42
     I have opportunity to learn and grow                                                                       53                      55                            56            55

                                                                                                              ^ new statement     Higher/Lower at 95% significance vs. last year
43     E1K. How much do you agree on the following in regards to your work health and well-being?
                                                                                                              in 2020             Higher/Lower at 95% significance vs. Dec, 2020
       Base: All Working respondents (excluding NA) – 2019/2020-Jan/Feb/2020-Dec/2021 (9810/12424/1755/12750)
Health &                                   The decline in Workplace well-being is largely a reflection of those mid to end career
     Well-being                                 cohorts (Gen X and pre-retirees).
     Index                                      Again, the gender levelling impact of work is seen as working women and men report
                                                similar levels of Work well-being (but in different ways).
                                                Again, well-being scores for those with younger kids are above the total (but similar to
     WORK                                       last year’s scores.)

80
                                                                            68.7                 69.5                                                             70.0                  70.1
           67.9                  67.9                 67.7                                                             67.3                 66.3                                                         67.5
                                                                                                                                                                                                                            65.0

60

40
            Total                 Male               Female                 18-24                25-34                 35-49                50-64                  65/+             Working      Working Working w/o
                                                                                                                                                                                  w/kids under w/kids 18+ yo kids
                                                                                                                                                                                      18 yo
                                                                                                                             Higher/Lower at 95% significance vs. last year                    Higher/Lower at 95% significance vs. total

          E1K. How much do you agree on the following in regards to your work health and well-being?
     44   Base: All respondents – 2020/2021 (17148/18043); Male (8695/9064); Female (8440/8968); 18-24 (1947/2068); 25-34 (4578/4641); 35-49 (6240/6440); 50-64 (3655/3833); 65+ (728/1061);
Health &                                 Pre-retirees show the most anxiety in terms of their Work well-being with lower scores against
                                         most measures vs. the total sample.
Well-being                               Millennials show the best Work related well-being numbers, perhaps because they have already
Index                                    established a career and are well able to manage the WFH need to embrace technology.
                                         Although men and women in general have similar scores in Work well-being, women do report
WORK                                     lower levels of career development, satisfaction with package/ benefits, and greater work -related
                                         stress.
     Strongly Agree / Agree ( #(Strongly) Disagree / Neither) (%)                             Total           Male          Female          18-24        25-34          35-49      50-64   65/+
     I have a reasonable workload/ working hours                                                 60              60                61          63           64                59    58      67
     I maintain a good relationship with my supervisor                                           68              68                68          71            72               66    64      71
     I maintain good relationships with my coworkers                                             74              74                74          75            76               73    73      77
     I have job stability                                                                        60              60                61          61           64                59    56      63
     I have good career development                                                              46              47                45          53           54                46    35      37
     I have good work-life balance                                                               60              59                60          57            63               58    58      70
     I have work-related stress#                                                                 49              50                48          42           43                48    59      74
     I have a satisfactory salary package / work benefits                                        42              43                41          40           47                41    36      43
     I have opportunity to learn and grow                                                        55              55                55          68           64                53    43      49
                                                                                                                       # caution   on reading results:
                                                                                                 A lower % in ‘neither or (strongly) disagree’ with ‘work-related stress’’
                                                                                                              means more agree that they experienced it

       E1K. How much do you agree on the following in regards to your work health and well-being?                                                         Higher/Lower at
                                                                                                                          ^ new statement                 95% significance
45     Base: All Working respondents (excluding NA) (12750); Male (6878); Female (5866); 18 -24 (865); 25-34 (3768);
                                                                                                                          in 2020                         compared to total
Health &                                   Work well-being scores are consistently higher among those respondents that work in an
Well-being                                 MNC (along with higher levels of claimed work-related stress).
Index                                      And again, the presence of younger children is associated with higher reported scores
                                           than the total.
WORK

                                                                                                                                       Working            Working
                                                                                                                                                                        Working
     Strongly Agree / Agree ( #(Strongly) Disagree / Neither) (%)                              Total     Domestic     MNC              w/kids             w/kids
                                                                                                                                                                        w/o kids
Specific
     Impacted
     Populations

47
Impacted                        Covid-19 has affected women more than men
Groups

                                                                                                                                               Women vs Men are
                                                                                                                                               more likely to:
                                                                                                                                               Deal with mental health
 Women have fared worse than men across Physical, Social and Financial well-being scores. They are more generally stressed than men
 with higher levels of unmanageable stress (14% vs 11%), but are no more resilient. However, at work and with their family, women have         challenges themselves
 similar levels of well-being to men.                                                                                                          by employing ‘healthy’
                                                                                                                                               options, e.g. exercising
 It is in Physical well-being that women have had a more negative outlook (2.7 points lower than men), with worse results across all                     34         37
                                                                                                                                               %
 indicators. Getting a good night’s sleep is a major factor in mitigating stress - and only 29% of women get sufficient sleep or good sleep
 at night.

 Although in general Work well-being is equal between men and women, women state that they have fewer career development
 opportunities (45%) and less satisfactory salary and work benefits (41%). Coupled with general economic instability during 2020, women                  Men      Women
 reported a significantly (2.6 points) lower Financial well-being rating than men - perhaps leading to heightened stress. That said, working
 women showed a healthier Financial well-being score than women in general.
                                                                                                                                                   Discuss any mental
 Women also showed a marked preference for self-help solutions for mental health, with female pre-retirees even preferring unhealthy               health issues they have
 self-help solutions such as alcohol over seeing a therapist.                                                                                      with friends / family

 Has the division of labor been a factor in increasing women’s stress levels? It seems that having young children at home during Covid-19       %
                                                                                                                                                         25         28
 has generally been a boon for well-being, but women are more concerned about being able to care for their parents and their spouses.
 Have women found themselves to be primary caregivers to all generations in their family and community, taking on the burden and
 stress of others as they faced the pandemic?

                                                                                                                                                         Men      Women

48
Impacted                    Online connections make Gen Z (aged 18-24) feel more distant from families and close
Groups                      communities

 At this stage in their lives, Gen Z should be expecting to graduate from university and start their careers.
 Instead, it seems these plans might have to be put on hold to Covid-19. They reported 3.4 points below the
 total for Financial well-being – for some, college loans and hiring freezes have probably made it more
 difficult to find a way out of their current financial burdens.
                                                                                                                   Social Well-Being Index
 With schools closed and many companies working from home, Gen Z has been unable to create strong
 bonds with their communities, and this is reflected perhaps in their relatively lower resilience when
 compared to the Millennials (39% vs 44% with high resilience) whose longer years in the workforce have            61.6 63.1 64.5 60.6 58.7 62.7
 enabled them to develop a stronger sense of community. Even at home, a below-average number (39%)
 report having a close-knit family with emotional support, even though 58% report sustained family support.
 Does Gen Z feel stuck at home, a burden on their families with no income to contribute? Is the support they
 receive from their families mostly financial?                                                                      All   Aged Aged Aged Aged Aged
                                                                                                                          18-24 25-34 35-49 50-64 65/+
 Meanwhile, Gen Z seems to rely more on their friendship groups for emotional support, with a higher-than-
 average sense of Social well-being. As digital natives, social distancing has perhaps not impacted their social
 circles as much as older generations who prefer face-to-face meetings. 31% of Gen Z felt they spent
 sufficient time in-person with friends, compared to the average of 23% and pre-retirees (aged 50-64) 14% -
 but tellingly, a lower-than-average number (28%) feel they are spending the ‘right’ amount of time online to
 keep connected: are they spending too much time online, perhaps?

49
Impacted                  Millennials’ (aged 25-34) optimism outperforms other age groups
Groups

 Millennials (aged 25-34) have outperformed other age groups across all indicators:
 resilience, social, physical, family, finance and work. They were also early adopters of virtual
 health (55%), and one of the cohorts most willing to seek help for mental health issues. In         Prefer to Work From Home
 some indicators, they have bucked the overall downward trend altogether.                            %

 Mostly digital natives and in the early stages of their established careers, they were                  41    44    47
                                                                                                                           38
                                                                                                                                       46
                                                                                                                                 36
 comfortable working remotely (with the highest preference for working from home) and
 socializing remotely (greatest proportion claiming to have friends with whom they can have
 open conversations with). They were alone in feeling more financially secure during 2020 -
 perhaps a combination of fewer financial burdens (mortgages, education, families) and                   All   Aged Aged Aged Aged Aged
                                                                                                               18-24 25-34 35-49 50-64 65/+
 optimism for the future of their careers (‘this is just one year out of many’ / ‘I can always get
 another job’) with an overwhelming number (72%/76%) having good work relationships
 (with supervisors/ coworkers) and (64%) having opportunities to learn and grow.

50
Impacted                 Gen X (aged 35-49) are stuck in the middle
Groups

 Gen X (aged 35-49) share some attributes with Millennials (aged 25-34) and pre-retirees
 (aged 50-64) - and this is borne out in their generally lower well-being scores, without the
 optimism of Millennials or the doom and gloom of pre-retirees.
                                                                                                     Health & Well-Being Index

 Anecdotally, most of them speak digital as a second language - they are competent but are           61.3 60.7 64.1 60.9 58.7 62.2
 not natives. They reported to be more comfortable with remote work than pre-retirees
 (Work well-being 67.3 points vs 66.3 points), and with online connections too (Social well-
 being 60.6 points vs 58.7 points). In essence, Gen X seem to have learned to cope, living
 with one foot on each side of the digital/ physical divide.                                          All   Aged Aged Aged Aged Aged
                                                                                                            18-24 25-34 35-49 50-64 65/+

 They are also the generation with children of all ages - those with younger children
 benefiting from the added resilience and well-being this brings, those with older ones with
 the additional stress of looking after young adults in crisis. Financially, they hover around the
 global average for impact, an echo of their in-between status.

51
Impacted                        Pre-retirees (aged 50-64) are in crisis, both at work and at home
Groups

 Pre-retirees have a lot of concerns. On every front, their sense of well-being has deteriorated through 2020. At a stage of
 their lives when they are thinking about retirement, the past year has shaken many of them, potentially affecting their
 savings, their ability to look after their families and their earning power. A generation that has already experienced 4 majo r
 economic recessions at major turning points in their working lives (1997 Asian financial crisis, 2002 dot -com bubble, 2007
 banking crisis, 2010 subprime mortgage crisis), the economic impact of Covid-19 is another crisis as they enter what should
 be the most financially rewarding decade of their careers. Perhaps the accumulation of stress through these crises has also          High Resilience
 left them the least resilient of all age groups (35% high resilience vs. 39% average), at the lowest ebb in terms of their fa mily   %
 and community connections.                                                                                                                           44
                                                                                                                                          39    39          38          39
                                                                                                                                                                  35
 This is a group also more likely to have children in Gen Z, whose lives could have been stalled by Covid -19, unable to finish
 college or start their first jobs. Perhaps this added concern is reflected in their feelings of being unable to take care of their
 families (lower than average family well-being) and their families’ education and medical financial needs.
                                                                                                                                          All   Aged Aged Aged Aged Aged
 Their own social needs are also not being met - born before the digital age, pre-retirees perhaps misses face-to-face                          18-24 25-34 35-49 50-64 65/+
 contact most of all (9 points below average on spending sufficient in -person time with friends) and the increased isolation
 this entails (9 points below average on feeling they are part of a broader group).

 This discomfort with an online lifestyle and remote working is perhaps felt most keenly by this age group, who are the only
 demographic whose relationships with supervisors and coworkers have been impacted. However at the same time, their
 decades of experience might have given them tools to cope better with work stress - and this is reflected in their lower-
 than-average stress ratings (75% vs 83% average) with a full 25% reporting no stress at all, as work stress is one of the
 highest predictors of overall stress across all age groups.

52
Impacted                       Boomers/ Retirees (aged 65 or above) have renewed energy as focus returns to them
Groups

 Boomers/ Retirees are sitting pretty high on well-being, outperforming all other age groups except for Millennials.
 They feel socially secure (Social well-being +1.1 points), financially secure (Financial well-being +5.9 points), secure in
 their families (Family well-being +0.9 points) and those that work feel satisfaction in the workplace (Work well -being
 +2.1 points). Even on a physical level, they perform on par with the global average. They are also one of the
 demographics most likely to have adult children, and yet do not seem to feel the negative effects of that as keenly as        Having time for myself
 pre-retirees - perhaps their children are already Millennials and their optimism carries through or there is less of a        %
 need to take care of them.                                                                                                                                      51
                                                                                                                                         42    40
                                                                                                                                   36                      33
 One potential factor for their sense of well-being might be the focus that Covid-19 has brought on their demographic                                32
 - with all governments globally, acting to protect their generation from the disease, they have experienced an
 unparalleled outpouring of support - which is reflected in the uptick of resilience they feel, in particular through the
 support of their communities. However, other factors may also be at play: people in this age bracket have fewer                   All   Aged Aged Aged Aged Aged
 financial and work concerns, giving them more time to focus on themselves (51% vs 36% average). In fact, despite the                    18-24 25-34 35-49 50-64 65/+
 greater support shown by their communities, fewer people than average in this age bracket felt they were part of a
 broader group (-2% points), and they suffered from having fewer friends to talk openly with ( -6% points), because of
 social distancing?

 With more time on their hands and perhaps with more pressing health needs, Boomers are also more open to new
 ideas: more (37%) have used virtual health than pre-retirees (32%) (34% took up virtual health services during the
 pandemic to fill prescriptions); and more on average (+4% points) felt they spent an adequate amount of time online
 to keep connected.

53
Thank You
Appendix
Fieldwork Period

     No.        Ma rket     Fieldwork date (start)   Fieldwork date (end)
      1         China             31-Mar                   12-Apr
      2      Singapore            26-Mar                   12-Apr
      3           UAE              1-Apr                   16-Apr
      4          S pain           31-Mar                   13-Apr
      5     S outh Korea          31-Mar                   13-Apr
      6     Sa udi Arabia          1-Apr                   17-Apr
      7      Hong Kong            30-Mar                   15-Apr
      8          USA              26-Mar                   16-Apr
      9        Australia          26-Mar                    9-Apr
     10         Kenya             26-Mar                   14-Apr
      11    New Zealand           25-Mar                   15-Apr
     12        Thailand           30-Mar                   13-Apr
     13           UK              26-Mar                    9-Apr
     14          India            25-Mar                    9-Apr
     15         Taiwan            30-Mar                   14-Apr
     16         Turkey             1-Apr                   13-Apr
     17       Indonesia           31-Mar                    9-Apr
     18         Ja pan            30-Mar                   13-Apr
     19        Be lgium            7-Apr                   16-Apr
     20     Netherlands            7-Apr                   13-Apr
     21       Ge rmany            31-Mar                   13-Apr

56
Profile       The more impacted group identified – those working without kids – actually span
              across different ages from 18 to 49 years old.

                                                         Working   Working
                                    Non-        U n-                         Working
          %      Total   Working                         w/kids    w/kids
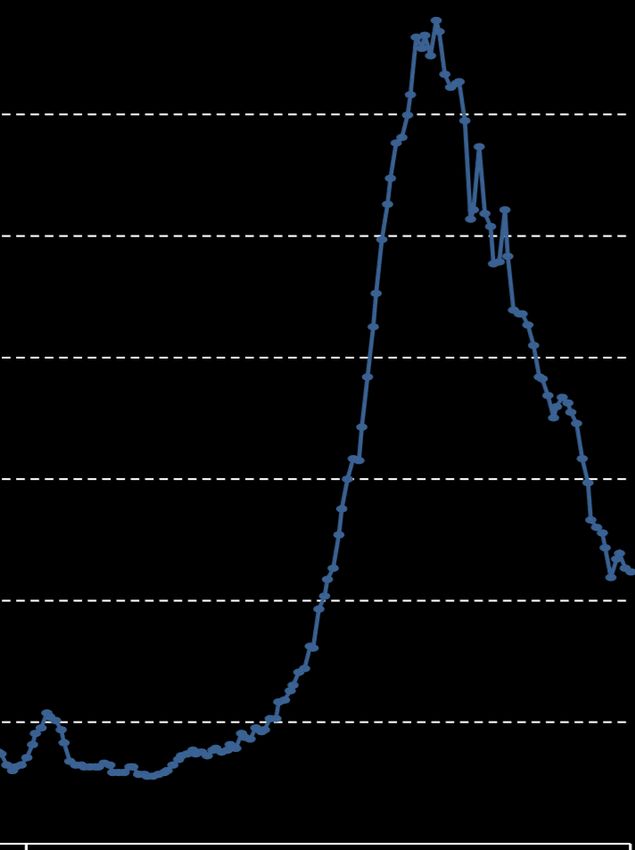
                                   Working   e mployed                       w/o kids
Saudi Arabia Key Timeline 2020
                       25 Feb
                                                                        MID SEVERITY                      HIGH SEVERITY             MID SEVERITY                                                                       11 Dec
                                                                                                                                                                                      England adds Saudi Arabia to safe travel
Advise against travel to Italy,        02 Mar                                                                                                                                                                     corridor list
                        Japan          First COVID case
                                       confirmed                        04 Apr                                                                                                                                            10 Dec
                       27 Feb                                           Lockdown and 24-hour                                                                                               Announce approval of Pfizer BioNTech
        Suspend tourist visa           Stop exports of
                                                                        curfew imposed in
                                       coronavirus detection and                                                                                                                                                        16 Dec
      Halt entry for Umrah in                                           Jeddah neighborhoods
                                       prevention products                                                                                                                            Receive first COVID-19 vaccine shipment
                       Mecca
                                                                        09 Apr
                                       03 Mar                           Saudi Arabia and Russia                                                                                                                           17 Dec
                      26 Feb
                                       Limit entry for GCC              end their oil-price war                                 24 Aug               13 Sep                                  Vaccination campaign starts; Health
     Suspend attendance at             citizens
                  workplace                                             with output cut                                         Reopen land          Reopen borders,                                   minister receives vaccine
   Suspend flights, bus, taxi,         04 Mar                           agreement                                               borders for          resume air                                                              20 Dec
                         train         Suspend Umrah for                                                  21 Jun                families of          travels                              All international flights cancelled due to
                                                                        09 Apr
   Impose curfew in Jeddah             nationals                                                                                citizens                                                       concerns of new strain of COVID-19
                                                                        Preparing to end the              Curfew fully lifted                        27 Sep
                       29 Feb          06 Mar                           war in Yemen                      28 Jun                30 Aug               Jordan reopens                                                    24 Dec
 Call on citizens to postpone          Require citizens to declare                                        1.5 million tests     5 million tests      trade gateway                   Trump’s administration plans to authorize
                                                                        25 Apr
               Lebanon travel          past Iran visits                                                   recorded              recorded             with Syria                        nearly $500m arms sale to Saudi Arabia
                                                                        Curfew partially lifted
                                                                        except Mecca
Jan                Feb                  Mar                  Apr              May                   Jun                 Jul     Aug                 Sep                     Oct                     Nov                 Dec

                                      08 Mar           21 Mar                 11 May                                                                          18 Oct                  11 Nov
                            Shut land borders          Suspend domestic       Triple VAT, halt                                                                Allow                   Several injured in a bomb attack at a
                         Suspends all schools          flights, public        handout payments                                                                citizens,               Remembrance Day ceremony attended by
                      Postpones Saudi games            transport              to cope with record                                                             residents to            foreign diplomats in Jeddah
            Imposes quarantine on Al-Qatif city                               low oil prices                                                                  pray in
                                                       24 Mar                                                                                                                         20 Nov
                                            8 Mar                                                                                                             Grand
                                                       Curfew for 21 days     14 May                                                                                                  G20 Riyadh summit taking place
        Initiates a price war on oil with Russia,                                                                                                             Mosque in
                                                       First coronavirus      Around half a
      facilitating a 65% quarterly fall in oil price                                                                                                          Mecca                   24 Nov
                                                       death                  million tests                                                                                           Declare cease-fire in Yemen
                                        15 Mar         25 Mar                 recorded
                   Suspend international flights                                                                                                                                      29 Nov
                                                       Lockdown in            28 May
                Closes malls, restaurants, cafes                                                                                                                                      Ranked sixth safest country in COVID-19
                                                       Riyadh, Mecca,         Declare re-opening                                                                                      risk assessment
                                       17 Mar          Medina                 except Mecca
                   Suspend prayers at mosques
                 = COVID mid severity       = high severity     = low severity                                                                2020 Flagship: from 10 Jan – 24 Feb, 2020
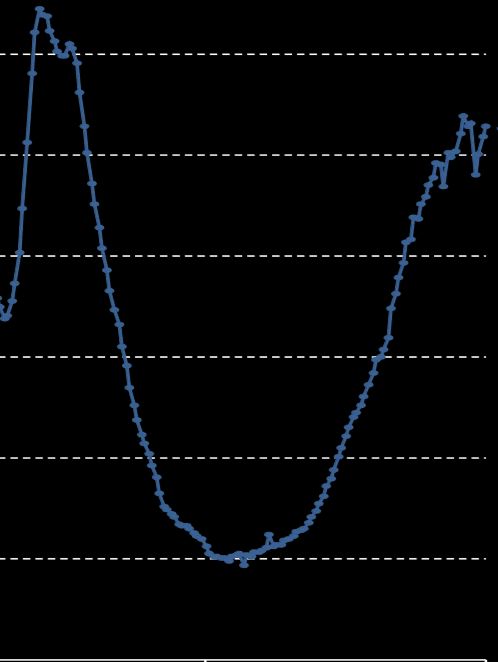
      58       Note: Chart in the background: number of daily confirmed COVID-19 cases
Saudi Arabia Key Timeline 2021                                                                                                                           An obvious outlier, KSA's relatively better
                                                                    MID                                                                                    performance in well-being indices in 2021
                                         03 Mar
                                                                     05 Apr
                                                                     Grant Umrah permits during Ramadan for vaccinated
                                                                                                                                                           is probably a reflection of a combination of
                                                                                                                                                           better economic indicators vs. last year
   07 Jan                                Over 1 million vaccine
   Launch “Health Passport”                                          people
                                         doses administered
   for vaccine recipients                                            05 Apr                                                                                and the fact that at the time of the survey,
                                         07 Mar
   08 Jan                                Reopen gym, cinemas,
                                                                     Over 5 million vaccine doses administered                                             cases of Covid-19 had largely been
                                                                                                                                                           brought under control.
   King Salman receives first            gaming venues, indoor       12 Apr
   dose                                  dining                      Postpone second vaccine dose due to scarcity of global
                                                                     supplies
                                         11 Mar
                                         Expand vaccine              16 Apr
   19 Jan                                campaign to larger          First Ramadan Friday prayer in Mecca observed
   Approve AstraZeneca,                  segment in the
   Moderna vaccines                                                  18 Apr
                                         population
                                                                     Over 7 million vaccines administered
                                         Over 100 vaccine centers                                                                                          xxx
   21 Jan
   Reschedule vaccinations               have opened; vaccines to    19 Apr                                                                                 Health        & Well-being Index
   amid Pfizer delay                     be provided in              Ministry warns of reimposing quarantines
                                         pharmacies                                                                                                          Gap

 Jan               Feb                   Mar               Apr              May                Jun                Jul                  Aug                  Sep                     Oct              Nov          Dec

                                04 Feb          21 Mar                              03 May                       09 May
  New rules, penalties for restaurants          SII informs delay of                Jordan re-opened             Hajj pilgrimage provided                                                   Physical       71.8
and cafes; events, weddings canceled            further supplies of                                              with quarantine compliance
            and cinemas, gyms closed            AstraZeneca COVID-19
                                                                                    06 May
                                                                                    Over 10 million vaccine
                                                                                                                                                                                            Social         75.8
                                                                                                                 10 May
                                                vaccine
                            15 Feb                                                  doses administered           Non-oil economy grows in
                                                                                                                 Q1, first time since pandemic
                                                                                                                                                                                            Family         79.7
              Shut down 12 mosques              24 Mar                              07 May
                             26 Feb             Saudi Arabia's Crown                Vaccinations made            10 May                                                                     Finance        68.6
 King Salman and US President Biden             Prince meets with China’s           mandatory for all workers    Iran confirmed publicly for
   discuss strengthening partnership            State Councilor and                                              the first time that it is in talks                                         Work           76.6
                   during phone call            Foreign Minister Wang Yi                                         with its regional rival Saudi
                                                29 Mar                                                           Arabia
                                                Allow vaccinated people
                                                to attend football match
                                                                                                                 17 May (expected)                                2020 2021
                                                                                                                 Resume international flights
                 = COVID mid severity       = high severity     = low severity                                                                        2021 Flagship: from 25 Mar – 17 Apr, 2021
       59      Note: Chart in the background: number of daily confirmed COVID-19 cases
You can also read