Insulated nest boxes provide thermal refuges for wildlife in urban bushland during summer heatwaves
←
→
Page content transcription
If your browser does not render page correctly, please read the page content below
Journal of Urban Ecology, 2021, 1–8

                                                                              https://doi.org/10.1093/jue/juab032
                                                                              Short Notes

Insulated nest boxes provide thermal refuges for
wildlife in urban bushland during summer heatwaves

                                                                                                                                                         Downloaded from https://academic.oup.com/jue/article/7/1/juab032/6422774 by guest on 16 November 2021
Reannan Honey, Chris McLean, Brad R. Murray and Jonathan K. Webb                                                                            *
School of Life Sciences, University of Technology Sydney, Broadway, NSW 2007, Australia
*Corresponding author: E-mail: jonathan.webb@uts.edu.au

Submitted: 24 May 2021; Received (in revised form): 29 September 2021. Accepted: 1 October 2021

Abstract
In urban bushland, the installation of nest boxes is widely used to compensate for the loss of natural tree hollows. However,
current nest box designs may not provide thermal refuges for wildlife during summer heatwaves, particularly if internal
temperatures exceed the upper critical temperatures of wildlife. We investigated whether the addition of roofing insulation
to nest boxes deployed for sugar gliders (Petaurus breviceps) and squirrel gliders (Petaurus norfolcensis) in urban bushland
would reduce internal nest box temperatures during summer heatwaves. We measured temperatures of 44 insulated and
47 uninsulated nest boxes during one of the hottest summers on record (2018–2019) in the Lake Macquarie region of NSW,
Australia, a period during which several prolonged heatwaves occurred. Over the 90-day study, maximum temperatures
were, on average, 3.1 C lower in insulated boxes than in uninsulated boxes. The addition of insulation significantly lowered
nest box temperatures regardless of aspect (north or south facing) or day of measurement. Temperatures exceeded the up-
per critical temperature (35.1 C) of gliders more frequently in uninsulated nest boxes (28% of days) than in insulated nest
boxes (8% days). Although the addition of insulation to nest boxes lowered their internal temperatures, during heatwaves
spanning 23 days, nest box temperatures exceeded the upper critical temperatures of gliders on 58% and 23% of days in
uninsulated and insulated nest boxes respectively. These findings underscore the importance of retaining natural hollows
in urban bushland to provide thermally suitable refuges for wildlife during extreme heat events.

Key words: heatwaves, tree hollow, thermal neutral zone, arboreal gliders, marsupial

Introduction
Tree hollows are considered to be keystone structures, and their              mammals have been reported using nest boxes in Australian ur-
loss is recognized as a major threat to biodiversity worldwide                ban areas (Harper et al. 2005b; Macak 2020).
(Tews et al. 2004). In urban forest fragments, tree hollows are of-               Despite the utility of nest boxes, current designs may fail to
ten a scarce resource due to the historical harvesting of trees for           provide suitable thermal conditions for nocturnal hollow-de-
firewood, the felling of large trees for public safety and the loss           pendent species, particularly during the summer months
of natural processes that create hollows such as fire (Harper et              (Griffiths et al. 2017, 2018; Rowland et al. 2017). Nest boxes often
al. 2005a; Isaac et al. 2014). In Australia, natural hollows can              have thinner walls than natural hollows, and consequently, air
take decades to centuries to form, as there are no hollow-                    temperatures are often higher and are more variable, inside
creating vertebrates (Gibbons and Lindenmayer 2002). In re-                   nest boxes than in natural hollows (Isaac et al. 2008; Maziarz et
sponse to this lack of hollows, local councils and community                  al. 2017). Studies in Australia and Spain have reported the mor-
groups have deployed nest boxes in urban bushland remnants                    tality of bats roosting inside nest boxes during summer, sug-
in an effort to conserve hollow-dependent species (Harper et al.              gesting that nest boxes might act as death traps for nocturnal
2005b; Macak 2020). To date, a wide diversity of birds and                    wildlife (Flaquer et al. 2014; Griffiths 2021). Recent studies have

C The Author(s) 2021. Published by Oxford University Press.
V
This is an Open Access article distributed under the terms of the Creative Commons Attribution License (https://creativecommons.org/licenses/by/4.0/),
which permits unrestricted reuse, distribution, and reproduction in any medium, provided the original work is properly cited.

                                                                                                                                                1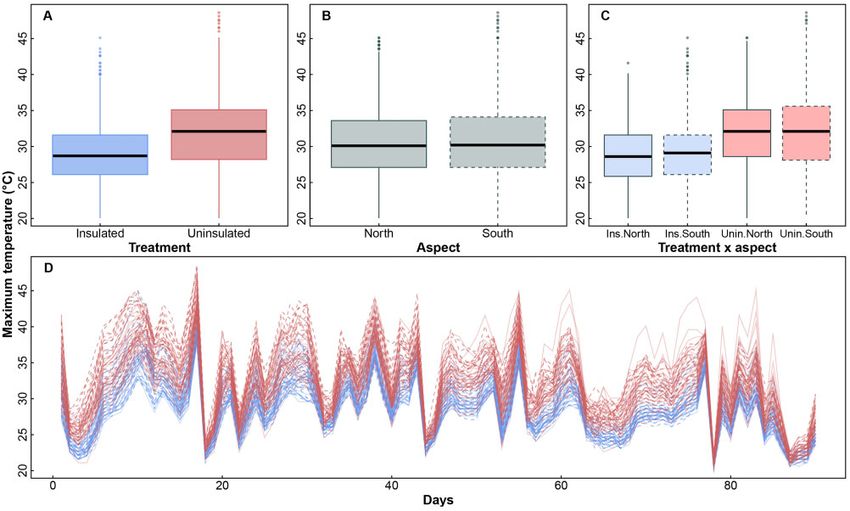
2   | Journal of Urban Ecology, 2021, Vol. 7, No. 1

called for improved nest box designs to buffer animals from
                                                                                     Methods
thermal extremes during the summer months (Rowland et al.
2017; Rueegger et al. 2020; Goldingay and Thomas 2021). To                           Study sites
date, several studies have explored the effects of painting and
                                                                                     We carried out our study at five urban bushland remnants near
insulation on nest box temperatures. In one study, white
                                                                                     Lake Macquarie, New South Wales, eastern Australia (Fig. 1).
painted boxes tracked ambient temperatures during summer
                                                                                     These sites host populations of sugar gliders (Petaurus breviceps),
and were several degrees cooler than green painted boxes
                                                                                     squirrel gliders (Petaurus norfolcensis) and feather-tail gliders
(Griffiths et al. 2017). In another study, the addition of polysty-
                                                                                     (Acrobates pygmaeus) (Smith and Murray 2003), all of which are
rene insulation to the roof and west wall of boxes reduced inter-
                                                                                     hollow-dependent species that use nest boxes (Goldingay et al.
nal temperatures by 0.9–1.7 C relative to controls (Larson et al.
                                                                                     2007, 2015). Study sites were spaced 1.5–15 km apart and were lo-
2018). However, as far as we are aware, no studies have explored
                                                                                     cated in remnant native forests with patch sizes ranging from 35
whether modifying nest box designs (via addition of insulation,
                                                                                     to 165 ha (Fig. 1). Vegetation at the sites consisted of dry sclero-
painting, or both) can reduce internal temperatures during sum-
                                                                                     phyll forest dominated by Angophora costata and Eucalyptus hae-
mer heatwaves. Heatwaves, which are defined as three or more

                                                                                                                                                            Downloaded from https://academic.oup.com/jue/article/7/1/juab032/6422774 by guest on 16 November 2021
                                                                                     mastoma with an understorey of Banksia, Casuarina and Lomandra
days where temperatures exceed the calendar day 90th percen-
                                                                                     species. The average annual rainfall for the region is 1030 mm
tile (Perkins and Alexander 2013), are of interest because they
                                                                                     while the mean minimum and maximum temperatures range
can have major impacts on human health (Williams et al. 2018)
                                                                                     from 2.6 C in July and 31.2 C in January (Bureau of Meteorology
and can contribute to mortality events in wildlife (Gordon et al.
                                                                                     2019b). Over the period of 20 December 2018–19 March 2019, air
1988; O’Shea et al. 2016). Because heatwaves are predicted to in-
                                                                                     temperatures at the nearest weather station (Newcastle
crease in intensity and duration in future (Perkins-Kirkpatrick
                                                                                     University 061390) ranged from 13.2 to 40.6 C and the total rain-
and Lewis 2020) and may be exacerbated by the urban heat is-
                                                                                     fall for the 3-month period was 220 mm. We identified days dur-
land effect (Rizvi et al. 2019), nest boxes will need to provide
                                                                                     ing which heatwaves occurred using temperature data for the
wildlife with thermal refuges during extended periods of high
                                                                                     closest weather station (Newcastle University), and the 90th per-
ambient temperatures.
                                                                                     centiles for daily maximum temperatures from the closest
    In this study, we performed a replicated field experiment to
                                                                                     weather station with long-term records of temperature data
investigate whether the addition of roofing insulation could
                                                                                     (Newcastle Nobbys Signal Station AWS 061055). As there were
lower temperatures inside nest boxes that we placed on trees in
                                                                                     missing data for Newcastle University, we calculated mean daily
urban bushland remnants during summer. Specifically, we in-
                                                                                     maximum temperatures from Cooranbong and Newcastle
vestigated how nest box orientation and insulation affected
                                                                                     University to identify heat wave days for the study region. For
nest box temperature regimes. Our study coincided with one of
                                                                                     Lake Macquarie, we identified three prolonged heatwaves span-
the hottest summers on record in Australia, during which sev-
                                                                                     ning 23 days (durations of 11, 5 and 7 days), which occurred from
eral heatwaves occurred in southeast NSW (Bureau of
                                                                                     26 December 2018 to 5 January 2019, 15–19 January 2019 and 25–
Meteorology 2019a). At our study sites, these heatwaves
                                                                                     31 January 2019. These dates were similar to those published by
spanned 23 days, providing us with a unique opportunity to ex-
                                                                                     the Bureau of Meteorology ‘Special climate statement 68—wide-
plore whether insulated boxes provided thermally suitable refu-
                                                                                     spread heatwaves during December 2018 and January 2019’
ges for wildlife during heatwaves.
                                                                                     (Bureau of Meteorology 2019a). Maximum daily temperatures
                                                                                     during the heatwaves ranged from 30.0 to 40.6 C.

Figure 1: Locations of the five study sites in urban bushland patches near Lake Macquarie, NSW, Australia. Data courtesy of Openstreetmap.org.
Insulated nest boxes provide thermal refuges | 3
Nest box installation Statistical analyses
We constructed 100 nest boxes from 19-mm marine plywood to We fitted a linear model using generalized least squares in R (R
suit squirrel and sugar gliders (internal dimensions 400 mm Core Team 2019) to determine whether the addition of insula-
175 mm 175 mm, 40 mm entry hole, Nest Boxes Australia) and tion affected maximum temperatures in nest boxes. The model
painted them green (Walpamur, pine green). We installed the specified the fixed factors insulation (insulated or uninsulated),
lid on each box with a metal hinge to facilitate visual inspec- aspect (north or south) and day (each of the 90 days of measure-
tions. We covered half of the nest boxes (n ¼ 50) with 4-mm alu- ment) and included all two-way interactions and the three-way
minium insulation (Bradford Polyair Performa, Fig. 2). This interaction. To account for repeated measurements on the
insulation has two external reflective layers of aluminium foil same nest boxes over time, we used the nlme package (Pinheiro
coated in anti-glare, with an internal foam structure that et al. 2019) and the function corAR1 to specify a temporal auto-
reduces heat transfer. We stapled the insulation to the outside correlation structure of order one in the model (Mangiafico
of each nest box so that it covered the sides and the roof. We 2016).
did not affix insulation to the bottom of the boxes so that the 7- To determine whether nest boxes could provide thermal ref-
Downloaded from https://academic.oup.com/jue/article/7/1/juab032/6422774 by guest on 16 November 2021
mm drainage holes could remain open to allow water egress. uges for gliders during summer, we calculated the number of
Between 5 and 19 December 2018, we installed 100 nest boxes hours per day that nest box temperatures exceeded the upper
onto 100 different trees across five urban bushland sites in Lake critical temperature of the thermal neutral zone (TNZ) of
Macquarie, NSW (Fig. 2). At each site, we attached 10 insulated gliders. The TNZ is the optimal range of ambient temperatures
and 10 uninsulated green nest boxes on trees with a minimum within which mammals use minimal energy for thermoregula-
diameter at breast height of 35 cm (mean ¼ 54.5 cm), and which tion (Lovegrove et al. 1991). For the glider species that use nest
did not have any visible hollows. Boxes were attached at a mean boxes in the study area, the TNZ ranges from 27.0 to 31.0 C for
height of 4.6 m above ground (range 3.9–5.1 m). We attached each sugar gliders (Fleming 1980) and 34.0 to 35.1 C for feather-tail
box to a 600-mm-long wooden backing piece (18-mm thick) and gliders (Fleming 1985). When ambient temperatures exceed
screwed this into the tree using 120-mm-long metal wood 34.0 C, sugar gliders use evaporative cooling, by licking their
screws. Half of the nest boxes had a northerly aspect, while the forelimbs, to avoid overheating. As temperatures increase fur-
other half had a southerly aspect. Boxes were randomly distrib- ther, they extend salivation across their abdomen, tail, scrotal
uted throughout sites (depending on where suitable trees were region and hind limbs and may also using panting and vasodila-
located) and were spaced >15 m from the closest nest box. tion (Robinson and Morrison 1957; Fleming 1980; Holloway and
Geiser 2001a). Given this information, we opted to use 35.1 C as
the upper critical temperature. We assumed that animals would
experience heat stress and water loss if exposed to tempera-
Nest box temperatures tures above 35.1 C for long periods (Dawson 1969).
In each nest box, we suspended a temperature logger We carried out two analyses, as follows. First, we used a
(Thermochron iButton model DS1922L, Maxim Integrated two-factor Analysis of Variance (ANOVA), with insulation treat-
Products, San Jose, CA, USA; operating range 10 to þ65 C, pre- ment and aspect as factors, and number of days where temper-
cision 60.5 C) from a fishing line so that it hung near the centre atures exceeded 35.1 C as the dependent variable. We analysed
of the box. Data loggers recorded temperatures every 30 min the entire data (90 days), and the subset of days during the three
from 20 December 2018 to 19 March 2019 (90 days of data). Some heatwaves (Bureau of Meteorology 2019a). Data were log-
data loggers failed, so we obtained thermal data from 44 insu- transformed prior to analysis to meet the assumptions of nor-
lated nest boxes (22 north-facing, 22 south-facing) and 47 unin- mality. Log-transformed data met assumptions of homogeneity
sulated boxes (23 north-facing, 24 south-facing). After the of variances (Levene’s tests, all P > 0.05) and data for insulated
placement of data loggers within boxes, we covered the entry boxes were normally distributed (Kolmogorov–Smirnov test,
hole of each box with aluminium fly mesh to prevent the in- P ¼ 0.20). Data for uninsulated boxes showed departures from
gress of animals into the boxes as the presence of endotherms normality (Kolmogorov–Smirnov test, P ¼ 0.04), but given that
within the boxes would have altered air temperature measure- ANOVA is robust to departures from normality we elected to
ments (Rowland et al. 2017). use log-transformed data. Next, we used a repeated-measure
ANOVA to determine whether insulation treatment affected the
number of hours per day during which nest box temperatures
exceeded 35.1 C during the 23 heat wave days. In this analysis,
day was the repeated measure (within-subject effect), hours per
day >35.1 C was the dependent variable and treatment (insula-
tion, aspect) was the between-subjects effects. Because the as-
sumption of sphericity was violated (epsilon ¼ 0.2), we used the
Greenhouse–Geisser correction for determining the significance
of F-tests.
Results
Throughout the study maximum daily air temperatures ranged
from 22.5 to 40.6 C. the maximum temperatures inside insu-
lated nest boxes were significantly lower than in the uninsu-
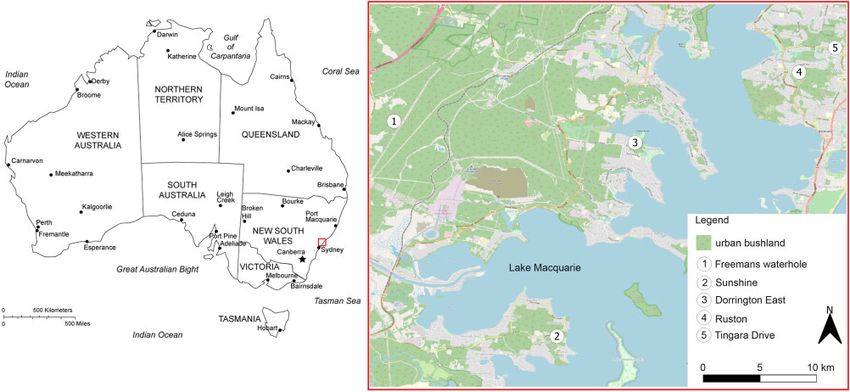
lated boxes (v2 ¼ 404.75, d.f. ¼ 1, P < 0.001; Fig. 3A). There were
Figure 2: Photographs of nest boxes installed on trees without insulation (A) and no significant effect of aspect on nest box temperatures (v2 ¼
with 4-mm reflective aluminium insulation (B). 1.58, d.f. ¼ 1, P ¼ 0.21; Fig. 3B) and no significant interaction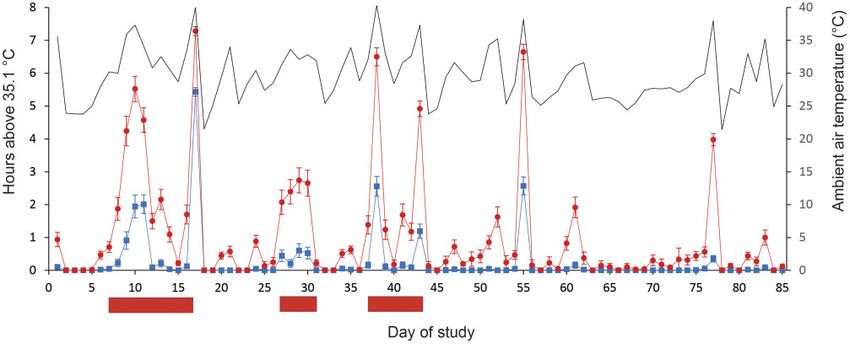
4   | Journal of Urban Ecology, 2021, Vol. 7, No. 1

                                                                                                                                                                     Downloaded from https://academic.oup.com/jue/article/7/1/juab032/6422774 by guest on 16 November 2021
Figure 3: Maximum temperatures inside nest boxes as a function of insulation (A), aspect (B), insulation and aspect (C), and day of study (D). Day 1 refers to 20
December 2018. In (D), blue lines show data from insulated nest boxes and red lines show data from uninsulated boxes.

between insulation and aspect (v2 < 0.001, d.f. ¼ 1, P ¼ 0.99;
Fig. 3C). In addition, there was no significant interaction be-
tween insulation and day (v2 ¼ 2.80, d.f. ¼ 1, P ¼ 0.09; Fig. 3D).
Thus, the significant effect of insulation in lowering nest box
temperatures was consistent regardless of aspect or the day of
measurement. Furthermore, the three-way interaction (insula-
tion  aspect  day) was also not significant (v2 ¼ 2.98, d.f. ¼ 1,
P ¼ 0.08), meaning that the effect of insulation on maximum
temperatures did not depend on how aspect and day interact.
    There were a significant effect of day on nest box tempera-
tures (v2 ¼ 327.28, d.f. ¼ 1, P < 0.001; Fig. 3D), which reflects daily
variation in temperatures, and a significant interaction between
aspect and day (v2 ¼ 11.98, d.f. ¼ 1, P < 0.001; Fig. 3D), reflecting
the changing position of the sun over time. On average, maxi-
mum temperatures inside nest boxes were positively correlated
with maximum daily air temperatures; that is, maximum daily
air temperature explained 90.4% and 85.2% of the variation in
average maximum temperatures recorded inside insulated and
uninsulated nest boxes, respectively (Fig. 4). Over the 90-day
study, internal temperatures exceeded 35.1 C on more days in                        Figure 4: Relationship between maximum daily air temperature and average
uninsulated (mean ¼ 24.2 days, range 4–55 days) than in insu-                        daily maximum temperatures recorded inside insulated nest boxes (solid blue
lated nest boxes (mean ¼ 6.8 days, range 1–33 days; F1,88 ¼ 83.0,                    symbols) and uninsulated nest boxes (open red symbols). Light blue line indi-
P ¼ 0.0001). There were no effect of aspect (F1,88 ¼ 0.52, P ¼ 0.47)                 cates 1:1 match between air temperature and nest box temperature.

and no interaction between aspect and treatment (F1,88 ¼ 0.14,
P ¼ 0.71). This pattern also occurred during heatwaves, when in-
ternal temperatures exceeded 35.1 C on more days in uninsu-                         uninsulated boxes (mean ¼ 2.5 h, range 0–9.5 h per day) than in
lated boxes (mean ¼ 13.4 days, range 3–22 days) than in                              insulated boxes (mean ¼ 0.7 h, range 0–8 h per day). This differ-
uninsulated boxes (mean ¼ 5.2 days, range 1–19 days; insulation                      ence was significant (repeated-measures ANOVA, between-sub-
F1,88 ¼ 50.328, P ¼ 0.0001; aspect F1,88 ¼ 2.38, P ¼ 0.13; aspect  in-              ject effects, insulation: F1,88 ¼ 43.79, P < 0.001; aspect F1,88 ¼ 0.21,
sulation: F1,88 ¼ 0.89, P ¼ 0.35).                                                   P ¼ 0.65; insulation  aspect F1,88 ¼ 0.10, P ¼ 0.76). The repeated-
    During heatwaves, the number of hours per day where tem-                         measures ANOVA also showed a significant within-subject ef-
peratures exceeded 35.1 C inside nest boxes was higher in                           fect of day of study on the number of hours above 35.1 C (F4.2,369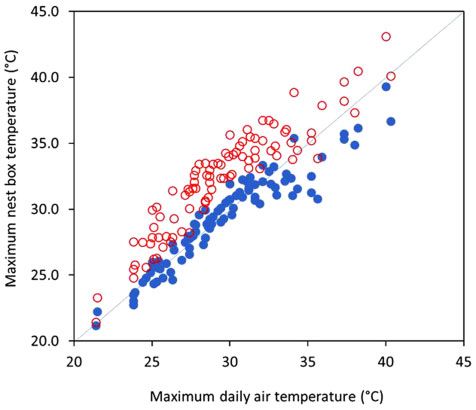
Insulated nest boxes provide thermal refuges          |     5

                                                                                                                                                                    Downloaded from https://academic.oup.com/jue/article/7/1/juab032/6422774 by guest on 16 November 2021
Figure 5: Number of hours during which nest box temperatures exceeded the upper thermal critical temperature (35.1 C) of gliders during the summer of 2018–2019.
Day 1 refers to 20 December 2018. Figure shows temperatures within insulated boxes (blue symbols) and uninsulated boxes (red symbols), while the solid black line
shows ambient temperatures recorded at Cooranbong weather station. Error bars denote standard errors. Solid red bars below the x-axis depict periods when heat-
waves occurred. Temperature data courtesy of the Australian Bureau of Meteorology. http://www.bom.gov.au/climate/data/ (15 October 2019, date last accessed).

Table 1: Temperatures recorded inside insulated and uninsulated nest boxes with northerly and southerly aspects

Treatment                                    Minimum ( C)                 Mean ( C)                    Maximum ( C)                  Average maximum ( C)

Insulated, northerly aspect                       10.0                          24.1                           41.6                                28.8
Insulated, southerly aspect                       11.1                          24.1                           43.8                                29.0
Standard, northerly aspect                        10.1                          24.9                           45.1                                31.9
Standard, southerly aspect                        10.1                          24.9                           48.6                                32.1
Air temperature                                   11.3                     not applicable                      40.3                                29.3

Ambient temperature data are from Cooranbong Weather Station (0614212), courtesy of the Bureau of Meteorology. http://www.bom.gov.au/climate/data/ (15 October
2019, date last accessed)

¼ 202.5, P < 0.001). There was also a significant day  insulation                  were lower than maximum daily air temperatures (Fig. 4). That
effect (F4.2,369 ¼ 23.41, P < 0.001), indicating that the effectiveness             is, the buffering effects of insulation were greatest during hotter
of insulation varied across days (Fig. 5). The other within-                        conditions. Interestingly, we found that aspect did not influence
subjects interaction effects (day  aspect and day  insulation                     temperatures inside nest boxes (Fig. 3), though we only com-
 aspect) were not significant.                                                     pared north-facing and south-facing boxes. Other studies have
                                                                                    reported that orientation can affect nest box temperatures
                                                                                    (Ardia et al. 2006; Butler et al. 2009). In two North American
Discussion                                                                          studies, orientation affected temperatures during spring, when
Heatwaves are increasing in intensity and duration across the                       boxes with south or easterly orientations were warmer than
globe (Perkins-Kirkpatrick and Lewis 2020) and pose a threat to                     those with north or west facing orientations. In summer, orien-
human populations (Nitschke et al. 2011) and wildlife                               tation did not affect temperatures. This latter result accords
(Ratnayake et al. 2019). In Australia, loss of tree hollows has led                 with the results of this study and previous studies that have
to the widespread use of nest boxes as a conservation tool                          found no effect of aspect on nest box temperatures during sum-
(Lindenmayer et al. 2016, 2017; Macak 2020). However, high tem-                     mer (Goldingay 2015; Rowland et al. 2017). During summer, the
peratures within nest boxes during summer heatwaves could                           sun’s path is directly overhead, so canopy cover above nest
render them unsuitable for use by target wildlife (Griffiths et al.                 boxes can have a stronger effect on temperature than box orien-
2017; Rowland et al. 2017). To address this problem, we affixed                     tation (Griffiths et al. 2017).
roofing insulation to glider nest boxes and recorded their inter-                        Although the addition of insulation reduced nest box inter-
nal temperatures during the 2018–2019 summer that was char-                         nal temperatures, the thermal suitability of boxes will depend
acterized by prolonged heatwaves (Bureau of Meteorology                             on internal box temperatures relative to the animal’s TNZ (Isaac
2019a). Over the 90-day study, maximum temperatures were on                         et al. 2008). During the heatwaves recorded in this study, tem-
average 3.1 C lower inside insulated nesting boxes than in unin-                   peratures inside uninsulated boxes exceeded the TNZ of gliders
sulated nest boxes (Table 1, Fig. 3). In both insulated and unin-                   for an average of 2.5 h per day versus 0.7 h per day in insulated
sulated nest boxes, maximum temperatures were positively                            boxes. Thus, gliders could probably use some insulated nest
correlated with maximum air temperatures (Fig. 4). However,                         boxes but not uninsulated nest boxes, during heatwaves. When
when maximum daily air temperatures exceeded 34 C, the av-                         ambient temperatures exceed upper critical temperatures,
erage maximum temperatures recorded inside insulated boxes                          gliders use behaviours such as licking their paws and waving
6 | Journal of Urban Ecology, 2021, Vol. 7, No. 1
them in the air to increase evaporative cooling (Holloway and could be placed on nest boxes (e.g. metal spikes to prevent cats
Geiser 2001b). While laboratory studies have shown that gliders sitting on boxes) or trees (Bailey and Bonter 2017). To counter
can function in ambient temperatures of up to 39 C (Holloway the above problems, it would be worth exploring whether plac-
and Geiser 2001a), prolonged exposure to temperatures above ing insulation inside nest boxes (e.g. sandwiched between two
the TNZ would likely lead to physiological impairment from wa- layers of wood) can buffer internal temperatures from thermal
ter loss, particularly as free standing water is often absent dur- extremes. If so, then one could paint insulated boxes to match
ing heatwaves (Turner 2020). For example, a study on the backgrounds, substantially reducing the problems associated
physiological responses of the common ringtail possum with high visibility. Alternatively, 3-D printing could be used to
Pseudocheirus peregrinus to a simulated heatwave suggested that produce more thermally suitable boxes. Recently, researchers
exposure to 39 C for 17 h would lead to physiological impair- from Charles Sturt University produced 3-D-printed plastic
ment from water loss (Turner 2020). Given that one of the heat- boxes with double walls that incorporated an air space between
waves reported here stretched over 11 days (Fig. 5), we think the walls, with timber inserts fitted inside the box. In a labora-
that it is highly unlikely that gliders could use uninsulated nest tory trial, internal temperatures within a box of this design
boxes given that the risks of hyperthermia would be high were 7.3 C lower than ambient when air temperatures were
Downloaded from https://academic.oup.com/jue/article/7/1/juab032/6422774 by guest on 16 November 2021
(Turner 2020). 31 C in a test room (Callan 2020). Clearly, this sort of design war-
How do the results of our study compare to previous studies rants further field testing.
that have used reflective paints or insulation to reduce nest box
temperatures? In one study, researchers compared tempera-
tures of nest boxes that were unpainted, painted white, or were
insulated with aluminium foil batts or 3-cm-thick white poly-
Conclusion
styrene. In that study, temperatures inside polystyrene insu- Nest boxes are widely used to conserve hollow-dependent
lated boxes were 0.9–1.7 C lower than those of uninsulated fauna in urban bushland, but current designs may not provide
boxes (Larson et al. 2018). By contrast, the roofing insulation thermal refuges for wildlife during summer heatwaves. We
that we used in our study reduced maximum temperatures by showed that the addition of insulation to nest boxes partially
3.1 C, much lower than was achieved with polystyrene. This solved this problem, as maximum temperatures were 3.1 C
could reflect methodological differences between the two stud- lower in insulated boxes than in uninsulated boxes. Future
ies, differences in the effectiveness of the insulation materials studies should aim to develop nest boxes that are more ther-
used or the nest box design or differences in canopy cover or so- mally suitable for a diversity of hollow-dependent wildlife,
lar radiation loads, which can affect internal temperatures while community-led revegetation programmes could help to
(Griffiths et al. 2017). In another study, internal temperatures of ensure that there is sufficient recruitment of natural hollows in
boxes painted with white reflective paints were 4.3 C lower urban bushland in the future.
than those inside green painted boxes. At the first sight, white
reflective paint appears to be better for cooling nest boxes than
roofing insulation. However, closer inspection of the data Acknowledgements
showed that maximum temperatures inside white painted
boxes were virtually identical to maximum air temperatures We thank Lake Macquarie City Council for granting access
(Griffiths et al. 2017). By contrast, in our study, when maximum to public bushland and Robbie Economos for providing lo-
air temperatures exceeded 34 C, maximum temperatures inside gistical support and reviewing a draft of the manuscript. We
roofing insulated boxes were lower than air temperatures thank all of the volunteers who assisted us with fieldwork,
(Fig. 4). That is, our results suggest that reflective foil batts may especially Jess McGregor. We thank two anonymous
provide better cooling during heatwaves than reflective paints. reviewers for providing critical comments and suggestions
Future studies, measuring temperatures of nest boxes with dif- that helped to improve the manuscript and Angelica
ferent modifications, and mounted side by side in the field, Varhammar for assistance in producing Fig. 1. This research
would help to clarify the best way of achieving an insulated and was carried out under a NSW National Parks and Wildlife
thermally suitable nest box for wildlife. Service scientific licence (SL101905) and the approval of the
Our study showed that stapling foil batt insulation to the ex- UTS Animal Care and Ethics Committee (ETH17-1361).
terior of nest boxes can result in lower internal temperatures.
However, this is not a long-term practical solution, for two rea-
sons. First, the insulation may not last long in the field, as ani-
mals might chew it off. Second, applying foil insulation to the Data availability
exterior of nest boxes will make them more conspicuous The dataset used for all analyses in this manuscript is avail-
(Griffiths et al. 2017) and, thus, potentially more prone to preda- able online from the data repository Figshare, doi:10.6084/
tion or vandalism (Henze 1977; Stebbings and Walsh 1991).
m9.figshare.15071121.v1
White reflective surfaces are much more visible in the land-
scape and could make it easier for predators to find nest boxes,
potentially increasing predation rates. In Australia, little is
known about predation on fauna using nest boxes, but a recent Funding
camera trap study found that feral cats (Felis catus) were
The research was funded by a Lake Macquarie City Council
ambushing Leadbeater’s possums (Gymnobelideus leadbeateri)
Environmental Research Grant (2016-2017/02).
from atop of the nest boxes (McComb et al. 2019). To minimize
the risk of predation, predator deterrents or exclusion devices Conflict of interest statement. None declared.Insulated nest boxes provide thermal refuges | 7
References , , and (2005b) ‘The Use of Nest Boxes in Urban
Natural Vegetation Remnants by Vertebrate Fauna’, Wildlife
Ardia, D. R., Pérez, J. H., and Clotfelter, E. D. (2006) ‘Nest Box
Research, 32: 509–16.
Orientation Affects Internal Temperature and Nest Site
Henze, O. (1977) ‘Vogelnistkästen in Augenhöhe?’, Anzeiger für
Selection by Tree Swallows’, Journal of Field Ornithology, 77:
Schädlingskunde Pflanzenschutz Umweltschutz, 50: 106.
339–44.
Holloway, J. C., and Geiser, F. (2001a) ‘Effects of Helium/Oxygen
Bailey, R. L., and Bonter, D. N. (2017) ‘Predator Guards on Nest
and Temperature on Aerobic Metabolism in the Marsupial
Boxes Improve Nesting Success of Birds’, Wildlife Society
Sugar Glider, Petaurus breviceps’, Physiological and Biochemical
Bulletin, 41: 434–41.
Zoology, 74: 219–225.
Bureau of Meteorology (2019a) Special Climate Statement
, and (2001b) ‘Seasonal Changes in the
68—Widespread Heatwaves during December 2018 and January
Thermoenergetics of the Marsupial Sugar Glider, Petaurus bre-
2019. Melbourne, Australia: Bureau of Meteorology.
viceps’, Journal of Comparative Physiology. B, Biochemical, Systemic,
—— (2019b) Station 061214 Cooranbong. Climate Data. http://www.
and Environmental Physiology, 171: 643–650.
bom.gov.au/climate/data/ (15 October 2019, date last
Isaac, B. et al. (2014) ‘Urban to Forest Gradients: Suitability for
Downloaded from https://academic.oup.com/jue/article/7/1/juab032/6422774 by guest on 16 November 2021
accessed).
Hollow Bearing Trees and Implications for Obligate Hollow
Butler, M. W., Whitman, B. A., and Dufty, A. M. (2009) ‘Nest Box
Nesters’, Austral Ecology, 39: 963–972.
Temperature and Hatching Success of American Kestrels
Isaac, J. L., Parsons, M., and Goodman, B. A. (2008) ‘How Hot Do
Varies with Nest Box Orientation’, The Wilson Journal of
Nest Boxes Get in the Tropics? A Study of Nest Boxes for
Ornithology, 121: 778–82.
the Endangered Mahogany Glider’, Wildlife Research, 35:
Callan, M. N. (2020). ‘Thinking Outside of the Box:
441–445.
Investigating Novel Alternatives to Timber Habitat Boxes for
Larson, E. R. et al. (2018) ‘Nest Box Design for a Changing
Arboreal Vertebrate Fauna’, Honours thesis, Charles Sturt
Climate: The Value of Improved Insulation’, Ecological
University.
Management & Restoration, 19: 39–48.
Dawson, T. (1969) ‘Temperature Regulation and Evaporative
Lindenmayer, D. et al. (2016) ‘Do Nest Boxes in Restored
Water Loss in the Brush-Tailed Possum Trichosurus vulpecula’,
Woodlands Promote the Conservation of Hollow-Dependent
Comparative Biochemistry and Physiology, 28: 401–7.
Fauna?’, Restoration Ecology, 24: 244–251.
Flaquer, C. et al. (2014) ‘Could Overheating Turn Bat Boxes into
Lindenmayer, D. B. et al. (2017) ‘The Anatomy of a Failed Offset’,
Death Traps?’, Barbastella, 7: 46–53.
Biological Conservation, 210: 286–292.
Fleming, M. R. (1980) ‘Thermoregulation and Torpor in the Sugar
Lovegrove, B., Heldmaier, G., and Ruf, T. (1991) ‘Perspectives of
Glider, Petaurus breviceps (Marsupialia, Petauridae)’, Australian
Endothermy Revisited: The Endothermic Temperature Range’,
Journal of Zoology, 28: 521–34.
Journal of Thermal Biology, 16: 185–197.
(1985) ‘The Thermal Physiology of the Feathertail Glider,
Macak, P. V. (2020) ‘Nest Boxes for Wildlife in Victoria: An
Acrobates pygmaeus (Marsupilia, Burramyidae)’, Australian
Overview of Nest Box Distribution and Use’, The Victorian
Journal of Zoology, 33: 667–81.
Naturalist, 137: 4–14.
Gibbons, P., and Lindenmayer, D. (2002) Tree Hollows and Wildlife
Maziarz, M., Broughton, R. K., and Wesołowski, T. (2017)
Conservation in Australia. CSIRO Publishing.
‘Microclimate in Tree Cavities and Nest-Boxes: Implications
Goldingay, R. L. (2015) ‘Temperature Variation in Nest Boxes in
for Hole-Nesting Birds’, Forest Ecology and Management, 389:
Eastern Australia’, Australian Mammalogy, 37: 225–33.
306–313.
, Grimson, M. J., and Smith, G. C. (2007) ‘Do Feathertail
Mangiafico, S.S. (2016) Summary and Analysis of Extension Program
Gliders Show a Preference for Nest Box Design?’, Wildlife
Evaluation in R, version 1.18.8. rcompanion.org/handbook/.
Research, 34: 484–90.
McComb, L. B. et al. (2019) ‘Feral Cat Predation on Leadbeater’s
et al. (2015) ‘Specific Nest Box Designs Can Improve Habitat
Possum (Gymnobelideus leadbeateri) and Observations of
Restoration for Cavity-Dependent Arboreal Mammals’,
Arboreal Hunting at Nest Boxes’, Australian Mammalogy, 41:
Restoration Ecology, 23: 482–90.
262–265.
, and Thomas, K. J. (2021) ‘Tolerance to High Temperature
Nitschke, M. et al. (2011) ‘Impact of Two Recent Extreme Heat
by Arboreal Mammals Using Nest Boxes in Southern
Episodes on Morbidity and Mortality in Adelaide, South
Australia’, Journal of Thermal Biology, 98: 102899.
Australia: A Case-Series Analysis’, Environmental Health, 10: 42.
Gordon, G., Brown, A. S., and Pulsford, T. (1988) ‘A Koala
10.1186/1476-069X-10-42.
(Phascolarctos cinereus Goldfuss) Population Crash during
O’Shea, T. J. et al. (2016) ‘Multiple Mortality Events in Bats: A
Drought and Heatwave Conditions in South-Western
Global Review’, Mammal Review, 46: 175–190.
Queensland’, Austral Ecology, 13: 451–61.
Perkins-Kirkpatrick, S. E., and Lewis, S. C. (2020) ‘Increasing
Griffiths, S. R. (2021) ‘Overheating Turns a Bat Box into a Death
Trends in Regional Heatwaves’, Nature Communications, 11: 3357.
Trap’, Pacific Conservation Biology,
Perkins, S. E., and Alexander, L. V. (2013) ‘On the Measurement of
et al. (2017) ‘Surface Reflectance Drives Nest Box
Heat Waves’, Journal of Climate, 26: 4500–4517.
Temperature Profiles and Thermal Suitability for Target
Pinheiro, J., Bates D., and R-core (2019) Nlme: Linear and Nonlinear
Wildlife’, PLoS One, 12: e0176951.
Mixed Effects Models. https://CRAN.R-project.org/package=nlme
et al. (2018) ‘Chainsaw-Carved Cavities Better Mimic the
Ratnayake, H. U. et al. (2019) ‘Forecasting Wildlife
Thermal Properties of Natural Tree Hollows than Nest Boxes
Die-Offs from Extreme Heat Events’, Animal Conservation, 22:
and Log Hollows’, Forests, 9: 235.
386–395.
Harper, M. J., McCarthy, M. A., and van der Ree, R. (2005a) ‘The
Rizvi, S. H., Alam, K., and Iqbal, M. J. (2019) ‘Spatio-Temporal
Abundance of Hollow-Bearing Trees in Urban Dry Sclerophyll
Variations in Urban Heat Island and Its Interaction with Heat
Forest and the Effect of Wind on Hollow Development’,
Wave’, Journal of Atmospheric and Solar-Terrestrial Physics, 185:
Biological Conservation, 122: 181–92.
50–57.8 | Journal of Urban Ecology, 2021, Vol. 7, No. 1
Robinson, K. W., and Morrison, P. R. (1957) ‘The Reaction to Hot and Gliders on the New South Wales Central Coast’, Wildlife
Atmospheres of Various Species of Australian Marsupial and Research, 30: 291–301.
Placental Mammals’, Journal of Cellular and Comparative Stebbings, R., and Walsh, S. (1991) Bat-Boxes: A Guide to the
Physiology, 49: 455–478. History, Function, Construction and Use in the Conservation of Bats.
Rowland, J. A., Briscoe, N. J., and Handasyde, K. A. (2017) London: Bat Conservation Trust.
‘Comparing the Thermal Suitability of Nest-Boxes and Tews, J. et al. (2004) ‘Animal Species Diversity Driven by Habitat
Tree-Hollows for the Conservation-Management of Arboreal Heterogeneity/Diversity: The Importance of Keystone
Marsupials’, Biological Conservation, 209: 341–348. Structures’, Journal of Biogeography, 31: 79–92.
Rueegger, N. et al. (2020) ‘Testing Multichambered Bat Box Turner, J. M. (2020) ‘Facultative Hyperthermia during a Heatwave
Designs in a Habitat-Offset Area in Eastern Australia: Delays Injurious Dehydration of an Arboreal Marsupial’, Journal
Influence of Material, Colour, Size and Box Host’, Pacific of Experimental Biology, 223: jeb219378.
Conservation Biology, 26: 13–21. Williams, S. et al. (2018) ‘Regional Morbidity and Mortality during
Smith, A. P., and Murray, M. (2003) ‘Habitat Requirements of the Heatwaves in South Australia’, International Journal of
Squirrel Glider (Petaurus norfolcensis) and Associated Possums Biometeorology, 62: 1911–1926.
Downloaded from https://academic.oup.com/jue/article/7/1/juab032/6422774 by guest on 16 November 2021You can also read