Indoor Temperatures in the 2018 Heat Wave in Quebec, Canada: Exploratory Study Using Ecobee Smart Thermostats
←
→
Page content transcription
If your browser does not render page correctly, please read the page content below
JMIR FORMATIVE RESEARCH                                                                                                                Oetomo et al

     Original Paper

     Indoor Temperatures in the 2018 Heat Wave in Quebec, Canada:
     Exploratory Study Using Ecobee Smart Thermostats

     Arlene Oetomo1, BSc; Niloofar Jalali1, PhD; Paula Dornhofer Paro Costa2, PhD; Plinio Pelegrini Morita1,3,4,5,6, PhD
     1
      School of Public Health Sciences, Faculty of Health, University of Waterloo, Waterloo, ON, Canada
     2
      Department of Computer Engineering and Automation, School of Electrical and Computer Engineering, University of Campinas, Campinas, Brazil
     3
      Institute of Health Policy, Management, and Evaluation, University of Toronto, Toronto, ON, Canada
     4
      Department of Systems Design Engineering, University of Waterloo, Waterloo, ON, Canada
     5
      Research Institute for Aging, University of Waterloo, Waterloo, ON, Canada
     6
      eHealth Innovation, Techna Institute, University Health Network, Toronto, ON, Canada

     Corresponding Author:
     Arlene Oetomo, BSc
     School of Public Health Sciences
     Faculty of Health
     University of Waterloo
     200 University Ave W
     Waterloo, ON, N2L3G1
     Canada
     Phone: 1 519 888 456 ext 41372
     Email: arlene.oetomo@uwaterloo.ca

     Abstract
     Background: Climate change, driven by human activity, is rapidly changing our environment and posing an increased risk to
     human health. Local governments must adapt their cities and prepare for increased periods of extreme heat and ensure that
     marginalized populations do not suffer detrimental health outcomes. Heat warnings traditionally rely on outdoor temperature
     data which may not reflect indoor temperatures experienced by individuals. Smart thermostats could be a novel and highly scalable
     data source for heat wave monitoring.
     Objective: The objective of this study was to explore whether smart thermostats can be used to measure indoor temperature
     during a heat wave and identify houses experiencing indoor temperatures above 26°C.
     Methods: We used secondary data—indoor temperature data recorded by ecobee smart thermostats during the Quebec heat
     waves of 2018 that claimed 66 lives, outdoor temperature data from Environment Canada weather stations, and indoor temperature
     data from 768 Quebec households. We performed descriptive statistical analyses to compare indoor temperatures differences
     between air conditioned and non–air conditioned houses in Montreal, Gatineau, and surrounding areas from June 1 to August 31,
     2018.
     Results: There were significant differences in indoor temperature between houses with and without air conditioning on both
     heat wave and non–heat wave days (P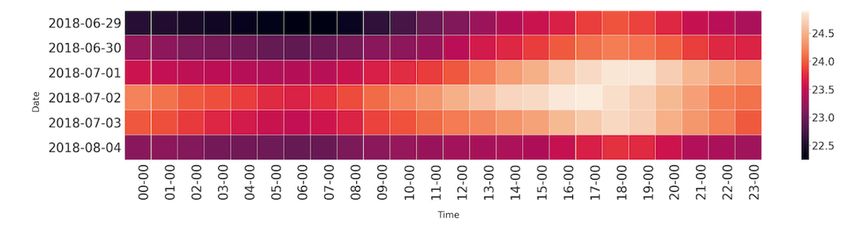
JMIR FORMATIVE RESEARCH                                                                                                            Oetomo et al

                                                                           Current heat alert and response systems rely upon outdoor
     Introduction                                                          meteorological data, yet individuals now spend most of their
     Background                                                            time indoors [25]. Indoor temperatures during heat waves can
                                                                           be significantly higher than outdoor temperatures [26]. There
     Our planet is getting warmer, and climate experts report that         are discrepancies between temperature data being used to make
     the frequency of extreme heat days has been                           decisions about heat waves and temperatures actually
     increasing—record-setting temperatures have been reported in          experienced indoors by individuals. Our understanding of indoor
     major cities around the world [1]. Driven by the output from          temperature trends is relatively limited because studies on indoor
     human activities (such as the greenhouse effect from gas              environments can be challenging, time-consuming, and
     emissions), the frequency and duration of extreme heat events         cost-prohibitive due to factors such as sensor costs, cost of study
     are only expected to increase [2].                                    deployment and duration, resources, and disturbances to home
     In the United States, heat waves kill more people than all other      life. Traditional studies on heat waves and urban heat islands
     weather-related events (earthquakes, tornadoes, hurricanes)           typically use satellite imagery data [27,28], local or airport
     annually [3]. Periods of extreme heat are dangerous because           weather stations [29], or emergency room visit, mortality, and
     heat stress occurs when the human body is unable to cool itself       ambulance call data [30] to set thresholds or examine outdoor
     [4]. Heat waves in Europe in 2003 and Russia in 2010 caused           heat exposure risk. Only a few studies have investigated indoor
     over 100,000 deaths combined [5]. In 2018, Quebec, Canada             temperature related to mortality and morbidity [31] or indoor
     experienced a severe heat wave that resulted in 66 deaths [6].        temperature exposure [32,33].

     Older adults, persons with disabilities, and persons with chronic     The advent of smart home technology (ie, indoor temperature
     conditions such as respiratory diseases and heart disease are         sensors) coupled with the Internet of Things (IoT) offers a
     more vulnerable during extreme heat days due to their impaired        unique opportunity to monitor residential indoor environments
     ability to regulate body temperature [7,8]. Individuals with low      across a large population. IoT sensors have been successfully
     sociodemographic status are at a higher risk for suffering the        used to monitor indoor health behaviors including sleep [34,35],
     detrimental and even deadly effects of a heat wave [9] because        gait [36], breathing, and heart rate [37]. Smart thermostat
     cooling methods may be cost-prohibitive [10] or they may live         adoption has been driven by government incentives, such as the
     in older buildings without air conditioning units. Those living       Ontario Government’s Green Ontario Fund, and a desire save
     in urban areas are at greater risk for extreme heat events. Urban     on heating and cooling costs [38,39].
     areas are often several degrees hotter than rural areas [11].         We searched Scopus and Google Scholar, with no language
     Densely populated urban areas experience heat domes, wherein          restrictions, for publications since database inception until
     the built environment absorbs and traps heat instead of reflecting    December 31, 2020, using the search string (“smart home
     it into the atmosphere [12-15]. Even at night, the temperatures       thermostat” OR “smart thermostat”) AND (“heatwave” OR
     remain high because building materials (such as concrete and          “heat wave”) OR (“public health”). We identified 2 studies
     asphalt) continue to radiate heat [16-19].                            [34,35] that used smart thermostats for public health
     To prevent heat-related deaths, many governments have adopted         surveillance, with focuses on healthy behaviors such as sleep,
     heat health action plans that include ensuring residents are          physical activity and sedentary behavior. One study [34]
     appropriately informed, providing resources such as cooling           validated the use of smart thermostats for measuring sleep,
     centers, and door-to-door checks by emergency services [17].          physical activity, and sedentary behavior and found results to
     Heat health action plans are localized and specific to each           be highly comparable with results captured through traditional
     municipality, tailored to local needs [2,18,20]. These action         survey methods used by the Public Health Agency of Canada.
     plans rely upon heat alert and response systems [21] or heat          The other study [35] found that using smart thermostats allowed
     health warning systems. Weather forecasts, based on outdoor           for insights into differences (which were significant) in time
     meteorological data, are used to predict weather conditions that      spent indoors during the weekend versus during weekdays. Both
     could be potentially hazardous to health [22].                        studies [34,35] demonstrated that smart thermostats and remote
                                                                           motion sensors can be used with minimal interference to
     There are no universal criteria used for issuing a heat wave          individual to monitor activity levels routine in real-world
     warning [23]. Environment and Climate Change Canada issues            settings (ie, in the home).
     heat warnings for each province. For example, in Quebec, a
     heat warning is issued when (1) the temperature is 30°C or            To the best of our knowledge, this is one of the first studies to
     higher, with a humidex value of 40 or higher for at least one         use smart home thermostat data to investigate the effects of heat
     hour, or (2) when the temperature is 40°C or higher [22]. Local       waves. As heat waves increase in frequency, intensity, and
     health departments also issue extreme heat alerts and often use       duration, the use of indoor cooling methods such as air
     different criteria. Santé Montréal [24], a local health department,   conditioning will increase. The use of smart thermostats to
     defines an extreme heat episode as either 3 consecutive days          capture indoor temperature data has several benefits, such as
     when the average maximum temperature reaches 33°C and the             minimal disturbance to study participants, and overcomes
     average minimum temperature does not drop below 20°C or               barriers associated with many environmental data collection
     when the temperature does not drop below 25°C for 2                   studies (ie, high overhead costs, equipment costs, small sample
     consecutive nights.                                                   sizes, short study durations). In many cases, temperature,
                                                                           motion, and humidity data are already being collected. This
                                                                           overlooked source of indoor temperature can be used to
     https://formative.jmir.org/2022/5/e34104                                                          JMIR Form Res 2022 | vol. 6 | iss. 5 | e34104 | p. 2
                                                                                                               (page number not for citation purposes)
XSL• FO
RenderX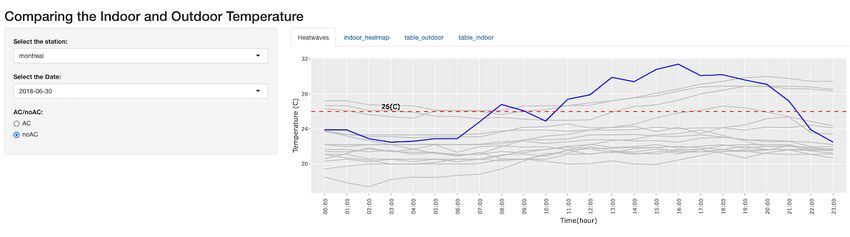
JMIR FORMATIVE RESEARCH                                                                                                          Oetomo et al

     strengthen public health response and climate mitigation efforts    for further study based on having a minimum of 30 houses with
     for decision-making during extreme heat events.                     data within their associated region and being within a region
                                                                         for which a heat wave had been declared (Multimedia Appendix
     Objective                                                           1). Montreal and Outaouais (Gatineau and surrounding areas)
     We aimed to compare indoor temperatures during heat wave            experienced a 6-day heat wave (from June 30 to July 5, 2018)
     and non–heat wave periods between air conditioned and non–air       [41].
     conditioned houses with ecobee smart thermostats and identify
     extreme indoor temperatures posing a health risk.                   Data Analysis
                                                                         We developed and used an app (RShiny) to visualize and
     Methods                                                             compare indoor and outdoor temperature trends.

     Data Collection                                                     We compared the indoor temperatures of non–air conditioned
                                                                         houses during heat wave and non–heat wave days. After
     We used smart home thermostat data (collected by ecobee and         combining all the daily records from each group, we used t
     made available to researchers through the Donate Your Data          values to examine temperature differences between air
     program [40]) and Environment and Climate Change Canada             conditioned and non–air conditioned houses.
     [41,42] data from in Quebec, Canada between June 1 and August
     31, 2018, which included a multiday heat wave event. Outdoor        A 1-tailed t test (with unknown variance) was performed to
     temperatures at weather stations were obtained from                 comparing the indoor temperatures of all houses in the same
     Environment and Climate using an amended Python3 script             region, with the assumption that they experienced the same
     [42,43]. Indoor temperature and occupancy data had been             outdoor temperature during extreme heat events and that the
     collected via the smart thermostat and remote motion sensors        indoor temperatures for non–air conditioned households was
     at 5-minute intervals.                                              consistent.

     Smart Thermostat Data Processing                                    Literature indicates that 26°C (72°F) is the threshold for a safe
                                                                         indoor temperature (ASHRAE 55 indoor temperature standard
     Thermostat metadata (number of sensors in a home, HVair
                                                                         [44]). Exposure to indoor temperatures greater than 26°C has
     conditioning mode setting, and household ID) and indoor
                                                                         been associated with increased premature mortality and
     temperature timeseries data were available from a total of 768
                                                                         emergency medical service calls [45]. We sought to determine
     households. The metadata file also contained information used
                                                                         whether above-threshold indoor temperatures were recorded
     to associate the house with the nearest weather station. We
                                                                         during the heat wave in regions of Quebec (Montreal and
     calculated the mean indoor temperature for each house each
                                                                         Gatineau) for which heat waves had been recorded on specific
     hour and each day.
                                                                         dates [41,46]. Remaining households were further filtered to
     For each day in the period from June 1 to August 31, houses         remove those not in areas where heat waves were officially
     were labeled as non–air conditioned if the cooling stage status     declared so that analysis contained only houses that experienced
     was 0 and cool was not recorded for HVair conditioning mode         the heat wave. Thus 47 non–air conditioned homes from
     in the metadata, and houses were labeled as air conditioned if      Montreal, Laval, Montérégie, and Outaouais health regions of
     the cooling stage status was 1, 2, 3, or 4 and HVair conditioning   Quebec remained after removing households that used air
     mode was cool at any point during the day. Data from days for       conditioning between June 1 and August 31, 2018 and houses
     which a given house was unoccupied were removed.                    with no occupancy on heat wave days (who may have turned
                                                                         off air conditioning while away). To examine which time of
     To determine whether non–air conditioned houses were more
                                                                         day the highest indoor temperatures occurred, we created a heat
     likely than air conditioned houses to have elevated indoor
                                                                         map of the non–air conditioned home temperatures for each
     temperatures, we focused on a subset of 82 non–air conditioned
                                                                         hour on each official heat wave day.
     households and 96 air conditioned households in the areas of
     greater Montreal and Outaouais. This was done after data
     cleaning, remove of incomplete data and filtering for occupancy
                                                                         Results
     (determined by activation of motion sensors).                       On certain days, some non–air conditioned homes recorded
     Mapping Indoor to Outdoor Data                                      indoor temperatures similar to, or even exceeding, the outdoor
                                                                         temperature on heat wave dates (Figure 1). These results
     Each house was assigned to the nearest Environment Canada
                                                                         demonstrate that using IoT devices such as the ecobee smart
     weather station using thermostat metadata. Houses with
                                                                         home thermostats are a logical means of monitoring indoor
     incomplete data were removed. Three weather stations—Ottawa
                                                                         residential temperatures, especially during extreme heat events.
     Gatineau, Montreal/St Hubert, Montreal Intl A—were selected

     https://formative.jmir.org/2022/5/e34104                                                        JMIR Form Res 2022 | vol. 6 | iss. 5 | e34104 | p. 3
                                                                                                             (page number not for citation purposes)
XSL• FO
RenderX
JMIR FORMATIVE RESEARCH Oetomo et al
Figure 1. Screenshot from the RShiny app, which shows a comparison of indoor (gray lines) and outdoor (blue line) temperatures for non–air conditioned
houses in the Montreal/St. Hubert weather station region on June 30, 2018.
stable, with mean temperatures 22.3°C and 22.4°C for non–heat
Indoor Temperature Differences Between Air wave and heat wave days, respectively.
Conditioned and Non–air conditioned Houses
For houses without air conditioning, there was a statistically
There is a significant difference of indoor temperature between
significant difference (PJMIR FORMATIVE RESEARCH Oetomo et al
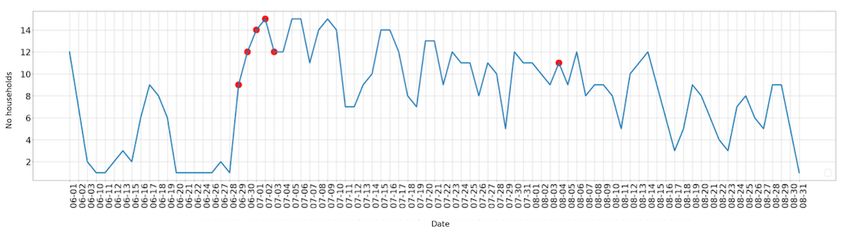
Figure 2. The number of households that experienced indoor temperatures equal to or greater than 26ºC for each date. Official heat wave days indicated
by a red dot.
Figure 3. The average duration (in hours) with indoor temperature equal to or greater than 26 ºC for houses without air conditioning. Official heat
wave days indicated by a red dot.
Figure 4. Average indoor temperatures for 47 households on heat wave days over time.
During the summer of 2018, there were numerous non–air
Discussion conditioned houses that experienced indoor temperatures greater
Principal Findings than the ASHRAE 55 standard of 26°C for extended periods of
time. This indoor temperature standard [47], which is used
There were high indoor temperatures for prolonged periods of widely in spaces such as office buildings, does not take into
time that may put people at risk; indoor temperatures may be account factors such as age or health. The threshold was
important to consider in policies and heat mitigation strategies. exceeded both on official heat wave days and on non–heat wave
In Quebec, current heat alert and response systems rely upon days. We also observed that the hottest time of the day indoors
outdoor meteorological data, which do not reflect actual indoor was between 4 PM and 7 PM, with increases in temperature
temperatures experienced by individuals. There were statically over the 5-day heat wave.
significant differences between air conditioned and non–air
conditioned houses: non–air conditioned homes experienced a We were specifically interested in indoor temperatures recorded
greater than 1°C difference in temperature between heat wave during the official heat wave from June 30 to July 5, 2018.
and non–heat wave days. Because there were only 6 official Unsurprisingly, the indoor temperatures of homes with air
heat wave dates during the summer of 2018, comparison dates conditioning remained relatively stable (mean 22.3°C or
were limited. We also found a statistically significant difference approximately 72°F) with no dramatic temperature spikes. Some
between indoor temperatures for non–air conditioned houses air conditioned homes did record higher indoor temperatures.
and air conditioned homes during a heat wave (PJMIR FORMATIVE RESEARCH Oetomo et al
threshold of 26°C (79°F) that is recommended by numerous values and low-carbon targets [54]. Leveraging smart
health policy documents [44,45,48]. Smart home technology thermostats instead of introducing new technology could mean
was able to capture continuous temperature data, which allowed less barriers to adoption and easier integration to support heat
the identification of houses that had experienced higher than health warning systems. The volume of data available is another
ideal indoor temperatures. This technology could allow local strength of this technology. Although we focused on a short
governments to develop hyperlocal, real-time heat alert and timeframe in a single province, there are still hundreds of
response systems to protect health [49]. datapoints available from location across Canada.
On official heat wave days, many homes recorded indoor There are currently several limitations to the use of ecobee data
temperatures reaching 26°C. Temperatures as high as 32.7°C to study indoor temperatures. The number of occupants is
were recorded over multiple hours in several households on unknown. In addition, the location of the residence is limited
heat wave days. This information is important considering that to the city level. This made grouping and matching homes with
spending more than a few hours indoors in a hot room can be outdoor weather stations a challenge. This limitation protects
hazardous to health [47]. Non–air conditioned homes anonymity and encourages voluntary enrollment in ecobee's
experienced indoor temperatures above 26°C for an average of Donate Your Data program [40]. We were unable to account
4 hours; there was an upward trend in duration as the heat wave for technology malfunctions, such as a dead battery in a remote
persisted. A second official heat wave event was declared on sensor, internet disconnection, or a power outage, that may have
August 4 in the Outaouais health region. In this region, homes resulted in missing data. The location of the smart thermostat
without air conditioning experienced indoor temperatures for is entered in a text field by the user during setup, thus, could be
more than 9 hours above 26°C. Prolonged periods with indoor inaccurate. Another limitation is that we do not know if other
temperatures above 26°C were also experienced by non–air cooling methods, such as a fan or window air conditioning unit,
conditioned dwellings on unofficial heat wave days (July 14, were used in the home. This could explain why some non–air
July 23, July 31 to August 3, August 7, August 11 to August conditioned dwellings experienced stable indoor temperatures.
15). In fact, houses in the Montreal and Outaouais areas Furthermore, smart thermostats are more likely to be in higher
consistently recorded indoor temperatures above 26°C socioeconomic status households, in detached homes that are
throughout the summer of 2018. While definitions of extreme owned by the resident [55].
heat vary by region, heat warnings are issued in Canada when
temperatures of 30°C or higher are expected for at least one
Implications
hour [50]. Consistent with the findings of previous literature A greater understanding of indoor temperature is necessary,
[51,52], our findings showed that higher indoor temperatures given the risks of high temperature to human health [44] and
were reached in the late afternoon, and the coolest temperatures the rise in extreme heat events over recent decades [56]. Many
typically occurred in the early morning. Our results emphasize factors can contribute to increased indoor temperatures,
that outdoor temperature is not always a good indicator of safe including the surrounding environment and building materials
indoor temperature; thus, there is a need to include indoor [57,58]. Canada has put in place some policies to address urban
temperature monitoring capacity in our public health units. heat, such as planning that include green urban areas with trees
and living roofs, encouraging the use of materials that reflect
We plan to explore indoor humidity data in the future. While heat into the atmosphere, and retrofitting old buildings with
the humidex is not widely used and critiqued by many, indoor smart, energy-efficient technologies [13].
humidity plays a role in human comfort especially during
extreme heat events [26,49,53]. These results also have implications for schools, hospitals, and
long-term care facilities looking to prepare for future decades
There is still relatively little known about indoor temperatures; of warmer temperatures [17,59,60]. We must consider and
the ability to study a large number of dwellings is both costly ensure safe indoor temperatures, particularly for at-risk
and time-consuming. This study is one of the first to use indoor populations [47,61-63]. Preparation for extreme challenges is
smart thermostat data to investigate extreme heat events in vital (ie, lockdowns due to a pandemic). During the COVID-19
Canada. pandemic, many public spaces traditionally used for cooling
Strengths and Limitations centers (ie, libraries and community centers) were closed, and
previous strategies (ie, visiting an indoor mall) were not feasible
Our ability to identify at-risk households has implications for
when public gathering was prohibited due to social distancing
the delivery of emergency services. While in this study, data
measures [64,65].
were not collected in real time, the technology can be used for
real-time alerts. For example, the data can be integrated directly Our study demonstrates the use of smart thermostat data for
with real-time temperature updates to ensure caregivers, heat wave monitoring. The adoption of smart home devices,
community care organizations, emergency medical response, such as smart thermostats, can be used for a greater purpose
paramedic, or hospital teams can reach at-risk populations. and have public health benefits. This technology can be used
These data can also be used to dispatch emergency medical to build on existing public health heat adaptation interventions
services to respond to calls and improve the safety of those and programs; for example, the strategic placement of sensors
aging in place or vulnerable individuals who may require across neighborhoods can help cities understand how heat affects
alternate care levels. Furthermore, smart thermostats can be their citizens. The use of secondary data overcomes some of
used to replace existing thermostats and bring energy and cost the challenges associated with a traditionally environmental
savings to home owners while meeting moral, pro-environment study. Further research is needed to understand better indoor
https://formative.jmir.org/2022/5/e34104 JMIR Form Res 2022 | vol. 6 | iss. 5 | e34104 | p. 6
(page number not for citation purposes)
XSL• FO
RenderXJMIR FORMATIVE RESEARCH Oetomo et al
temperatures in low-income housing or in institutions, such as less able to cope with extreme heat and more vulnerable to its
long-term care and hospitals, that house individuals who are effects.
Acknowledgments
We thank the University of Campinas team (Dr. Paula Dornhofer Paro Costa and Guilherme Abreu) for retrieving the Environment
and Climate Change Canada weather station data, ecobee Inc for their continued support and technology and use of the thermostat
data, and our colleagues at the Ubiquitous Health Technology Lab at the University of Waterloo for their support. We thank
Suzanne Osborne for feedback on the manuscript. This project was funded by the São Paulo Research Foundation (grant
20013/17-0), the National Science and Engineering Research Council, and the Ontario Centre of Innovation (VIP grant 33080).
Data Availability
Readers may contact the authors for more information on the RShiny app [66]. The code used for the app is available upon request
to the corresponding author. The ecobee data are available by reaching out to ecobee directly to become an affiliated researcher.
Conflicts of Interest
None declared.
Multimedia Appendix 1
Weather stations in Quebec 2018 and number of associated houses with ecobee smart thermostats.
[DOCX File , 26 KB-Multimedia Appendix 1]
References
1. Global warming of 1.5ºC. Intergovernmental Panel on Climate Change. 2018. URL: https://www.ipcc.ch/sr15/ [accessed
2021-03-11]
2. Kovats RS, Hajat S. Heat stress and public health: a critical review. Annu Rev Public Health 2008;29:41-55. [doi:
10.1146/annurev.publhealth.29.020907.090843] [Medline: 18031221]
3. Luber G, McGeehin M. Climate change and extreme heat events. Am J Prev Med 2008 Nov;35(5):429-435. [doi:
10.1016/j.amepre.2008.08.021] [Medline: 18929969]
4. Kenny GP, Jay O. Thermometry, calorimetry, and mean body temperature during heat stress. Compr Physiol 2013
Oct;3(4):1689-1719. [doi: 10.1002/cphy.c130011] [Medline: 24265242]
5. Campbell S, Remenyi TA, White CJ, Johnston FH. Heatwave and health impact research: a global review. Health Place
2018 Sep;53:210-218 [FREE Full text] [doi: 10.1016/j.healthplace.2018.08.017] [Medline: 30189362]
6. D’ulisse N. It’s hot today, eh? Montreal’s 2018 heat wave from urgences-santé’s perspective. Prehosp Disaster Med 2019
May 06;34(s1):s29-s29. [doi: 10.1017/s1049023x19000773]
7. McMichael AJ, Woodruff RE, Hales S. Climate change and human health: present and future risks. Lancet 2006 Mar
11;367(9513):859-869. [doi: 10.1016/S0140-6736(06)68079-3] [Medline: 16530580]
8. Meade RD, Akerman AP, Notley SR, McGinn R, Poirier P, Gosselin P, et al. Physiological factors characterizing
heat-vulnerable older adults: a narrative review. Environ Int 2020 Nov;144:105909 [FREE Full text] [doi:
10.1016/j.envint.2020.105909] [Medline: 32919284]
9. Ulrich F, Krüger M, Schwarz N, Grossmann K, Röder S, Schlink U. Heat stress in urban areas: Indoor and outdoor
temperatures in different urban structure types and subjectively reported well-being during a heat wave in the city of Leipzig.
Meteorologische Zeitschrift 2013 Jul 11;22(2):167-177. [doi: 10.1127/0941-2948/2013/0384]
10. Williams AA, Spengler JD, Catalano P, Allen JG, Cedeno-Laurent JG. Building vulnerability in a changing climate: indoor
temperature exposures and health outcomes in older adults living in public housing during an extreme heat event in
Cambridge, MA. Int J Environ Res Public Health 2019 Jul 04;16(13):2373-2388 [FREE Full text] [doi:
10.3390/ijerph16132373] [Medline: 31277359]
11. McMichael AJ. The urban environment and health in a world of increasing globalization: issues for developing countries.
Bull World Health Organ 2000;78(9):1117-1126 [FREE Full text] [Medline: 11019460]
12. Memon RA, Leung DYC, Chunho L. A review on the generation, determination and mitigation of urban heat island. J
Environ Sci (China) 2008;20(1):120-128. [doi: 10.1016/s1001-0742(08)60019-4] [Medline: 18572534]
13. Reducing urban heat islands to protect health in Canada. Health Canada. 2020. URL: https://www.canada.ca/en/services/
health/publications/healthy-living/reducing-urban-heat-islands-protect-health-canada.html [accessed 2021-03-23]
14. What is a heat dome? National Oceanic and Atmospheric Administration. URL: https://oceanservice.noaa.gov/facts/heat
-dome.html [accessed 2021-02-09]
https://formative.jmir.org/2022/5/e34104 JMIR Form Res 2022 | vol. 6 | iss. 5 | e34104 | p. 7
(page number not for citation purposes)
XSL• FO
RenderXJMIR FORMATIVE RESEARCH Oetomo et al
15. Mohajerani A, Bakaric J, Jeffrey-Bailey T. The urban heat island effect, its causes, and mitigation, with reference to the
thermal properties of asphalt concrete. J Environ Manage 2017 Jul 15;197:522-538. [doi: 10.1016/j.jenvman.2017.03.095]
[Medline: 28412623]
16. Laaidi K, Zeghnoun A, Dousset B, Bretin P, Vandentorren S, Giraudet E, et al. The impact of heat islands on mortality in
Paris during the August 2003 heat wave. Environ Health Perspect 2012 Mar;120(2):254-259 [FREE Full text] [doi:
10.1289/ehp.1103532] [Medline: 21885383]
17. McGregor G, Bessemoulin P, Ebi K, Menne B. Heatwaves and health: guidance on warning-system development. World
Meteorological Organization. 2015. URL: https://library.wmo.int/index.php?lvl=notice_display&id=17215#.YlB6IDfMI_V
[accessed 2022-04-08]
18. Hajat S, Sheridan SC, Allen MJ, Pascal M, Laaidi K, Yagouti A, et al. Heat-health warning systems: a comparison of the
predictive capacity of different approaches to identifying dangerously hot days. Am J Public Health 2010
Jun;100(6):1137-1144. [doi: 10.2105/AJPH.2009.169748] [Medline: 20395585]
19. Toloo GS, Fitzgerald G, Aitken P, Verrall K, Tong S. Are heat warning systems effective? Environ Health 2013 Apr
05;12:27 [FREE Full text] [doi: 10.1186/1476-069X-12-27] [Medline: 23561265]
20. Cities adapt to extreme heat. Institute for Catastrophic Loss Reduction. 2016. URL: https://www.iclr.org/wp-content/uploads/
PDFS/cities-adapt-to-extreme-heat.pdf [accessed 2020-07-30]
21. Heat alert and response systems to protect health: best practices guidebook. Government of Canada. 2012. URL: https:/
/tinyurl.com/w6zcnxun [accessed 2022-04-08]
22. Environment Climate Change Canada. Criteria for public weather alerts. Government of Canada. URL: https://www.
canada.ca/en/environment-climate-change/services/types-weather-forecasts-use/public/criteria-alerts.html#heat [accessed
2020-01-09]
23. Mayrhuber EA, Dückers MLA, Wallner P, Arnberger A, Allex B, Wiesböck L, et al. Vulnerability to heatwaves and
implications for public health interventions - a scoping review. Environ Res 2018 Oct;166:42-54. [doi:
10.1016/j.envres.2018.05.021] [Medline: 29859940]
24. Heat and extreme heat. Santé Montréal. URL: https://santemontreal.qc.ca/en/public/advice-and-prevention/
heat-and-extreme-heat/ [accessed 2021-01-09]
25. Mirzaei PA, Haghighat F, Nakhaie AA, Yagouti A, Giguère M, Keusseyan R, et al. Indoor thermal condition in urban heat
island – development of a predictive tool. Build Environ 2012 Nov;57:7-17. [doi: 10.1016/j.buildenv.2012.03.018]
26. Lee K, Lee D. The relationship between indoor and outdoor temperature in two types of residence. Energy Procedia 2015
Nov;78:2851-2856. [doi: 10.1016/j.egypro.2015.11.647]
27. Mirzaei PA. Recent challenges in modeling of urban heat island. Sustain Cities Soc 2015 Dec;19:200-206. [doi:
10.1016/j.scs.2015.04.001]
28. Buscail C, Upegui E, Viel JF. Mapping heatwave health risk at the community level for public health action. Int J Health
Geogr 2012 Sep 13;11:38 [FREE Full text] [doi: 10.1186/1476-072X-11-38] [Medline: 22974194]
29. Henderson S, Kosatsky T. A data-driven approach to setting trigger temperatures for heat health emergencies. Can J Public
Health 2012 May 1;103(3):227-230. [doi: 10.1007/BF03403818]
30. Huang C, Barnett AG, Xu Z, Chu C, Wang X, Turner LR, et al. Managing the health effects of temperature in response to
climate change: challenges ahead. Environ Health Perspect 2013 Apr;121(4):415-419 [FREE Full text] [doi:
10.1289/ehp.1206025] [Medline: 23407064]
31. O'Lenick CR, Baniassadi A, Michael R, Monaghan A, Boehnert J, Yu X, et al. A case-crossover analysis of indoor heat
exposure on mortality and hospitalizations among the elderly in Houston, Texas. Environ Health Perspect 2020
Dec;128(12):127007 [FREE Full text] [doi: 10.1289/EHP6340] [Medline: 33300819]
32. Vant-Hull B, Ramamurthy P, Havlik B. The Harlem Heat Project: a unique media-community collaboration to study indoor
heat waves. Bull Am Meteorol Soc 2018;99(12):2491-2506.
33. Hoeven FVD, Wandl A. Hotterdam: How space is making Rotterdam warmer, how this affects the health of its inhabitants,
and what can be done about it. BK Proj. 2018. URL: https://131.180.77.110/bkprojects/article/view/1972 [accessed
2019-11-08]
34. Sahu KS, Oetomo A, Morita PP. Enabling remote patient monitoring through the use of smart thermostat data in Canada:
exploratory study. JMIR Mhealth Uhealth 2020 Nov 20;8(11):e21016 [FREE Full text] [doi: 10.2196/21016] [Medline:
33216001]
35. Jalali N, Sahu KS, Oetomo A, Morita PP. Understanding user behavior through the use of unsupervised anomaly detection:
proof of concept using internet of things smart home thermostat data for improving public health surveillance. JMIR Mhealth
Uhealth 2020 Nov 13;8(11):e21209 [FREE Full text] [doi: 10.2196/21209] [Medline: 33185562]
36. Boroomand A, Shaker G, Morita P, Wong A, Boger J. Autonomous gait speed estimation using 24GHz FMCW radar
technology. 2018 Presented at: IEEE EMBS International Conference on Biomedical Health Informatics; March 4-7, 2018;
Las Vegas, USA p. 66-69. [doi: 10.1109/bhi.2018.8333371]
37. Alizadeh M, Shaker G, Almeida JCMD, Morita PP, Safavi-Naeini S. Remote monitoring of human vital signs using
mm-wave FMCW radar. IEEE Access 2019;7:54958-54968. [doi: 10.1109/access.2019.2912956]
https://formative.jmir.org/2022/5/e34104 JMIR Form Res 2022 | vol. 6 | iss. 5 | e34104 | p. 8
(page number not for citation purposes)
XSL• FO
RenderXJMIR FORMATIVE RESEARCH Oetomo et al
38. Lu J, Sookoor T, Srinivasan V. The smart thermostat: using occupancy sensors to save energy in homes. In: Proceedings
of the 8th ACM Conference on Embedded Networked Sensor Systems. SenSys'10. Association for Computing Machinery;
2010 Presented at: SenSys10: The 8th ACM Conference on Embedded Network Sensor Systems; November 3-5, 2010;
Zürich, Switzerland p. 211-224. [doi: 10.1145/1869983.1870005]
39. Eligible Ontario homeowners to get smart thermostats under new program. Canadian Press. 2017 Aug 30. URL: https:/
/toronto.citynews.ca/2017/08/30/eligible-ontario-homeowners-get-smart-thermostats-new-program/ [accessed 2021-02-05]
40. Donate your data. ecobee. 2021. URL: https://www.ecobee.com/donate-your-data/ [accessed 2021-02-24]
41. Poitras A. Extreme heat waves in Québec? Climate Data Canada. URL: https://climatedata.ca/Case-study/extreme-heat-
waves-in-quebec/ [accessed 2020-07-30]
42. Abreu G. Envcanlib. GitHub. 2020. URL: https://github.com/gui88Abreu/envcanlib [accessed 2021-01-30]
43. Tremblay M. Get Canadian weather observations. GitLab. 2018. URL: https://framagit.org/MiguelTremblay/get_canadian_
weather_observations/blob/master/README.md [accessed 2021-01-30]
44. Tham S, Thompson R, Landeg O, Murray KA, Waite T. Indoor temperature and health: a global systematic review. Public
Health 2020 Feb;179:9-17. [doi: 10.1016/j.puhe.2019.09.005] [Medline: 31707154]
45. BC energy step code: design guide. BC Housing. 2019 Jul. URL: https://www.bchousing.org/publications/BC-Energy-Step-
Code-Design-Guide-Supplement.pdf [accessed 2021-02-21]
46. Lebel G, Dubé M, Bustinza R. Surveillance des impacts des vagues de chaleur extrême sur la santé au Québec à l’été 2018.
Institut national de santé publique du Québec. 2019 Mar 12. URL: https://www.inspq.qc.ca/bise/surveillance-des-impacts
-des-vagues-de-chaleur-extreme-sur-la-sante-au-quebec-l-ete-2018 [accessed 2022-04-07]
47. Kenny GP, Flouris AD, Yagouti A, Notley SR. Towards establishing evidence-based guidelines on maximum indoor
temperatures during hot weather in temperate continental climates. Temperature (Austin) 2019;6(1):11-36 [FREE Full text]
[doi: 10.1080/23328940.2018.1456257] [Medline: 30906809]
48. Standard 55 - thermal environmental conditions for human occupancy. American Society of Heating, Refrigerating and
Air-Conditioning Engineers. 2017. URL: https://www.ashrae.org/technical-resources/bookstore/standard-55-thermal-
environmental-conditions-for-human-occupancy [accessed 2021-03-02]
49. Nguyen JL, Dockery DW. Daily indoor-to-outdoor temperature and humidity relationships: a sample across seasons and
diverse climatic regions. Int J Biometeorol 2016 Mar;60(2):221-229 [FREE Full text] [doi: 10.1007/s00484-015-1019-5]
[Medline: 26054827]
50. Preventing the effects of heat. Government of Quebec. 2020 Jun 22. URL: https://www.quebec.ca/en/health/advice- and
-prevention/health-and-environment/preventing-the-effects-of-oppressive-and-extreme-heat/ [accessed 2021-02-05]
51. Watkins R, Palmer J, Kolokotroni M. Increased temperature and intensification of the urban heat island: implications for
human comfort and urban design. Built Environ 2007;33(1):85-96 [FREE Full text]
52. Soltani A, Sharifi E. Daily variation of urban heat island effect and its correlations to urban greenery: a case study of
Adelaide. Front Archit Res 2017 Dec;6(4):529-538. [doi: 10.1016/j.foar.2017.08.001]
53. Quinn A, Shaman J. Health symptoms in relation to temperature, humidity, and self-reported perceptions of climate in New
York City residential environments. Int J Biometeorol 2017 Jul;61(7):1209-1220 [FREE Full text] [doi:
10.1007/s00484-016-1299-4] [Medline: 28108783]
54. Balta-Ozkan N, Amerighi O, Boteler B. A comparison of consumer perceptions towards smart homes in the UK, Germany
and Italy: reflections for policy and future research. Technol Anal Strateg Manag 2014 Nov 04;26(10):1176-1195. [doi:
10.1080/09537325.2014.975788]
55. Ameren illinois smart thermostat customer preference study. Opinion Dynamics. URL: https://ilsag.s3.amazonaws.com/
AIC_Thermostat_Customer_Preference_Study_Results_FINAL_2019-10-11.pdf [accessed 2022-04-07]
56. Horton R, Mankin J, Lesk C, Coffel E, Raymond C. A review of recent advances in research on extreme heat events. Curr
Clim Change Rep 2016 Aug 3;2(4):242-259. [doi: 10.1007/s40641-016-0042-x]
57. White-Newsome JL, Sánchez BN, Jolliet O, Zhang Z, Parker EA, Dvonch JT, et al. Climate change and health: indoor heat
exposure in vulnerable populations. Environ Res 2012 Jan;112:20-27 [FREE Full text] [doi: 10.1016/j.envres.2011.10.008]
[Medline: 22071034]
58. Mavrogianni A, Wilkinson P, Davies M, Biddulph P, Oikonomou E. Building characteristics as determinants of propensity
to high indoor summer temperatures in London dwellings. Build Environ 2012 Sep;55:117-130. [doi:
10.1016/j.buildenv.2011.12.003]
59. WHO guidance for climate resilient and environmentally sustainable health care facilities. World Health Organization.
2021. URL: https://www.who.int/publications-detail-redirect/9789240012226 [accessed 2022-04-08]
60. Salthammer T, Uhde E, Schripp T, Schieweck A, Morawska L, Mazaheri M, et al. Children's well-being at schools: impact
of climatic conditions and air pollution. Environ Int 2016 Sep;94:196-210. [doi: 10.1016/j.envint.2016.05.009] [Medline:
27258661]
61. Giridharan R, Lau S, Ganesan S, Givoni B. Urban design factors influencing heat island intensity in high-rise high-density
environments of Hong Kong. Build Environ 2007 Oct;42(10):3669-3684. [doi: 10.1016/j.buildenv.2006.09.011]
https://formative.jmir.org/2022/5/e34104 JMIR Form Res 2022 | vol. 6 | iss. 5 | e34104 | p. 9
(page number not for citation purposes)
XSL• FO
RenderXJMIR FORMATIVE RESEARCH Oetomo et al
62. Mavrogianni A, Davies M, Wilkinson P, Pathan A. London housing and climate change: impact on comfort and health -
preliminary results of a summer overheating study. Open House Int 2010 Jun 01;35(2):49-59. [doi:
10.1108/ohi-02-2010-b0007]
63. Mavrogianni A, Taylor J, Davies M, Thoua C, Kolm-Murray J. Urban social housing resilience to excess summer heat.
Build Res Inf 2015 Jan 15;43(3):316-333. [doi: 10.1080/09613218.2015.991515]
64. Martinez GS, Linares C, de'Donato F, Diaz J. Protect the vulnerable from extreme heat during the COVID-19 pandemic.
Environ Res 2020 Aug;187:109684 [FREE Full text] [doi: 10.1016/j.envres.2020.109684] [Medline: 32447085]
65. Salas RN, Shultz JM, Solomon CG. The climate crisis and covid-19 - a major threat to the pandemic response. N Engl J
Med 2020 Sep 10;383(11):e70. [doi: 10.1056/NEJMp2022011] [Medline: 32668132]
66. Jalali N. RShiny. Ubiquitous Health Technology Lab. URL: https://ubilab.shinyapps.io/heatwavef/ [accessed 2020-10-11]
Abbreviations
ASHRAE: American Society of Heating, Refrigerating and Air-Conditioning Engineers
IoT: Internet of Things
Edited by A Mavragani; submitted 06.10.21; peer-reviewed by Q Zhang, R Zhong; comments to author 16.12.21; revised version
received 09.02.22; accepted 10.03.22; published 12.05.22
Please cite as:
Oetomo A, Jalali N, Costa PDP, Morita PP
Indoor Temperatures in the 2018 Heat Wave in Quebec, Canada: Exploratory Study Using Ecobee Smart Thermostats
JMIR Form Res 2022;6(5):e34104
URL: https://formative.jmir.org/2022/5/e34104
doi: 10.2196/34104
PMID:
©Arlene Oetomo, Niloofar Jalali, Paula Dornhofer Paro Costa, Plinio Pelegrini Morita. Originally published in JMIR Formative
Research (https://formative.jmir.org), 12.05.2022. This is an open-access article distributed under the terms of the Creative
Commons Attribution License (https://creativecommons.org/licenses/by/4.0/), which permits unrestricted use, distribution, and
reproduction in any medium, provided the original work, first published in JMIR Formative Research, is properly cited. The
complete bibliographic information, a link to the original publication on https://formative.jmir.org, as well as this copyright and
license information must be included.
https://formative.jmir.org/2022/5/e34104 JMIR Form Res 2022 | vol. 6 | iss. 5 | e34104 | p. 10
(page number not for citation purposes)
XSL• FO
RenderXYou can also read