Indoor Air Quality in Buildings: A Comprehensive Review on the Factors Influencing Air Pollution in Residential and Commercial Structure - MDPI

Page created by Dave Nelson
 
CONTINUE READING
Indoor Air Quality in Buildings: A Comprehensive Review on the Factors Influencing Air Pollution in Residential and Commercial Structure - MDPI
International Journal of
               Environmental Research
               and Public Health

Review
Indoor Air Quality in Buildings: A Comprehensive Review on
the Factors Influencing Air Pollution in Residential and
Commercial Structure
Mehzabeen Mannan and Sami G. Al-Ghamdi *

                                          Division of Sustainable Development, College of Science and Engineering, Hamad Bin Khalifa University,
                                          Qatar Foundation, Doha, Qatar; mmannan@hbku.edu.qa
                                          * Correspondence: salghamdi@hbku.edu.qa; Tel.: +974-4454-2833; Fax: +974-4454-0281

                                          Abstract: Worldwide people tend to spend approximately 90% of their time in different indoor
                                          environments. Along with the penetration of outside air pollutants, contaminants are produced in
                                          indoor environments due to different activities such as heating, cooling, cooking, and emissions from
                                          building products and the materials used. As people spend most of their lives in indoor environments,
                                          this has a significant influence on human health and productivity. Despite the two decades of
                                          indoor air quality (IAQ) research from different perspectives, there is still a lack of comprehensive
                                          evaluation of peer-reviewed IAQ studies that specifically covers the relationship between the internal
                                          characteristics of different types of building environments with IAQ to help understand the progress
                                          and limitations of IAQ research worldwide. Therefore, this review of scientific studies presents a
                                          broad spectrum of pollutants identified in both residential and commercial indoor environments,
         
                                   highlighting the trends and gaps in IAQ research. Moreover, analysis of literature data enabled us
                                          to assess the different IAQs in buildings located in different countries/regions, thus reflecting the
Citation: Mannan, M.; Al-Ghamdi,
                                          current global scientific understanding of IAQ. This review has the potential to benefit building
S.G. Indoor Air Quality in Buildings:
A Comprehensive Review on the
                                          professionals by establishing indoor air regulations that account for all indoor contaminant sources
Factors Influencing Air Pollution in      to create healthy and sustainable building environments.
Residential and Commercial
Structure. Int. J. Environ. Res. Public   Keywords: indoor air pollution; residential indoor pollutants; office indoor pollutants; school indoor
Health 2021, 18, 3276. https://           pollutants; influencing factors indoor
doi.org/10.3390/ijerph18063276

Academic Editor: Yu-Pin Lin
                                          1. Introduction
Received: 14 February 2021
                                                Research on the urban population has confirmed that people spend more than 90% of
Accepted: 9 March 2021
                                          their daily lifespan in indoor environments. Apart from residential indoor environments,
Published: 22 March 2021
                                          people spend a large proportion of their time in offices, educational institutes, and other
                                          different commercial and industrial buildings. Specific research in North America has
Publisher’s Note: MDPI stays neutral
                                          shown that adults tend to spend 87% of their time in buildings, and the remainder of their
with regard to jurisdictional claims in
                                          time is spent in vehicles (6%) and outdoors (7%) [1]. As people spend a majority of their
published maps and institutional affil-
iations.
                                          time in indoor environments, exposure to indoor air pollutants has a significant impact on
                                          both human health and effectiveness in the workplace. However, research on air quality
                                          has mostly focused on the outdoors, whereas indoor air quality (IAQ) and its impacts have
                                          received considerably less attention until the last decade [2]. Recently, both scientists and
                                          the public have focused on risks associated with IAQ because research has established that
Copyright: © 2021 by the authors.
                                          indoor air is more contaminated than outdoor air [3]. Due to continuous changes in living
Licensee MDPI, Basel, Switzerland.
                                          style and the materials used in indoor environments, there have been significant changes
This article is an open access article
                                          in terms of the nature and complex compositions of indoor air pollutants, which opens up
distributed under the terms and
conditions of the Creative Commons
                                          avenues that need to be investigated in detail.
Attribution (CC BY) license (https://
creativecommons.org/licenses/by/
4.0/).

Int. J. Environ. Res. Public Health 2021, 18, 3276. https://doi.org/10.3390/ijerph18063276                    https://www.mdpi.com/journal/ijerph
Indoor Air Quality in Buildings: A Comprehensive Review on the Factors Influencing Air Pollution in Residential and Commercial Structure - MDPI
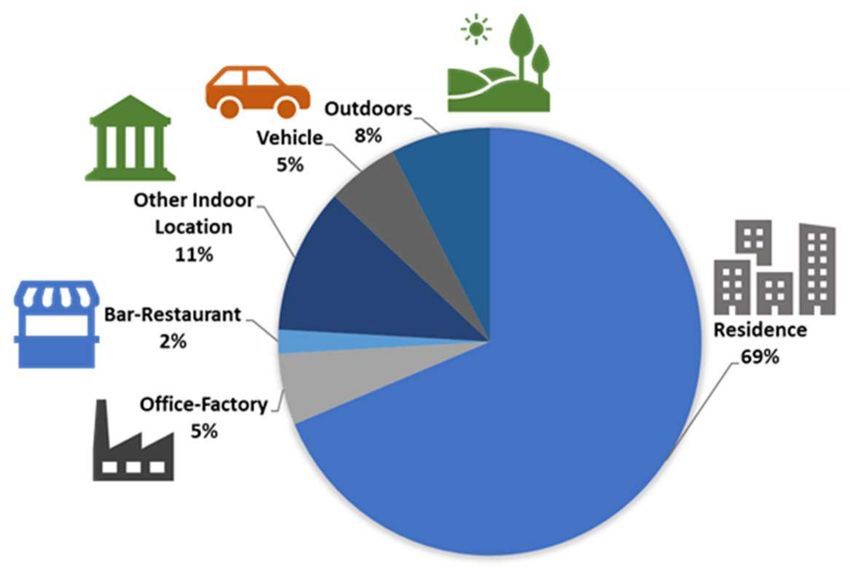
Int. J. Environ. Res. Public Health 2021, 18, 3276                                                                                       2 of 25

                                        1.1. Patterns of Time Spent Indoors
                                             Different life activities cause people to spend a majority of their time in different
                                        types of buildings, including residences, offices, schools, and restaurants (Figure 1). The
                                        air quality in indoor environments is a significant determinant of human health and
                                        wellbeing. Several studies have established links between positive human health impacts
                                        and improved indoor environments [4–6]. Low IAQ results in unwanted health conditions,
                                        including death in the worst-case scenarios. This highlights the importance of the IAQ of
                                        any indoor space where humans spend a majority of their time.

                                        Figure 1. Pie chart of the percentage of time spent in indoor and outdoor environments. Data were
                                        collected from the United States Environmental Protection Agency (US EPA) sponsored National
                                        Human Activity Pattern Database (NHAPS). The total number of participants was 9196, and approxi-
                                        mately 87% of the time spent in indoor environments was in residential buildings, office buildings,
                                        restaurants, and other indoor places, such as malls, stores, schools, churches, public building, salons,
                                        health clubs, parking garages, auto-repair shops, and laundromats [1].

                                             To better understand the factors affecting overall IAQ, the assessments of IAQ should
                                        be based on different types of buildings. Therefore, it is essential to understand the relation
                                        between IAQ and different residential and commercial buildings because building codes
                                        and regulations vary based on the type and end purpose of the building.

                                        1.2. Indoor Pollution Sources and Health Impacts
                                              The energy crisis of the 1970s introduced the importance of energy savings in buildings,
                                        which ultimately led to more airtight and insulated buildings worldwide [7]. For energy
                                        savings, reduced amounts of fresh air are circulated in air conditioning systems. Moreover,
                                        with the advent of improved living standards, more synthetic materials and chemicals are
                                        being used in buildings for indoor construction and decorating purposes. Additionally,
                                        pesticides, cleaning agents, air fresheners, and gases from cooking are other sources of
                                        indoor air pollution.
                                              Because inadequate ventilation, lack of air conditioning systems, human activities,
                                        and numerous materials, chemicals, and gases mainly influence indoor pollution, differ-
                                        ent organizations, such as the United States Environmental Protection Agency (US EPA)
                                        and World Health Organization (WHO) have recognized IAQ as a multi-disciplinary phe-
                                        nomenon and classified pollutants into several categories. According to the WHO, in
                                        the year 2000, over 1.5 million deaths were caused by indoor air pollution [8]. Moreover,
                                        indoor air pollution has been recognized as the third main reason for disability-adjusted
                                        life years worldwide [9]. Table 1 provides some pollutants in indoor environments and
                                        their health impacts.
Int. J. Environ. Res. Public Health 2021, 18, 3276                                                                                    3 of 25

                                         Table 1. Indoor air contaminants list and related health impacts.

           Contaminants                                   Sources                              Possible Consequences              Ref.
                                                             Biological Contaminants
              Allergens                   Furry pets, dust mites                        Asthma                                   [10,11]
                                          Presence of cats and dogs,
                                          contaminated humidifiers, storage of
             Endotoxins                                                                 Asthma, reduced lung function            [12,13]
                                          food waste, lower ventilation rate,
                                          increased amount of settled dust
                                          Unattended plumbing leaks, leaks in
                                                                                        Upper respiratory symptoms, cough,
       Dampness and mold                  building fabric, hidden food spills,                                                   [14,15]
                                                                                        wheeze, and asthma
                                          standing water
                                                              Chemical Contaminants
                                                                                        Premature mortality, lung cancer,
                                                                                        coronary artery disease, childhood
                Smoke                     Tobacco smoke                                                                          [16,17]
                                                                                        cough and wheeze, respiratory illness,
                                                                                        infant death syndrome
                                                                                        Combustion of solid fuels releases CO,
       Coal & biomass fuels                                                             N2 O, particulates, poly-cyclic
                                          Cooking and heating                                                                    [18,19]
       combustion product                                                               hydrocarbons, which increases risk of
                                                                                        lung cancer, childhood asthma
                                          Vehicle exhaust from attached garages,
     Carbon Monoxide (CO)                 gas stoves, furnaces, woodstoves,             Headache, nausea, fatigue                [20,21]
                                          fireplaces & cigarettes
                                          Combustion of fossil fuels e.g., gas or
     Nitrogen dioxide (N2 O)                                                            Increased risk of respiratory symptoms   [22,23]
                                          oil furnaces and stoves
                                          Contaminated soil, stored                     Irritation to eye, nose, and throat,
              Pesticides                                                                                                         [24,25]
                                          pesticide containers                          damage to central nervous system
                                         Off Gassing Emissions (Gases released from indoor materials)
                                          Wood-based products assembled using
                                                                                        Eye, nose, throat irritation, asthma,
     Formaldehyde (HCHO)                  urea-formaldehyde resins, cigarette                                                    [26,27]
                                                                                        bronchitis, and possible carcinogen
                                          smoke, paints, varnishes, floor finishes
                                          Cigarette smoke, recently dry-
  Volatile Organic Compounds
                                          cleaned cloths, room deodorizers,             Asthma, bronchial hyper-reactivity       [28–30]
             (VOC)
                                          paints, carpets
                                          Polyvinyl chloride for flooring, plastic      Bronchial obstruction, asthma, wheeze,
        Plastic Compounds                                                                                                         [31]
                                          wall material                                 cough, and phlegm
                                                                     Carcinogens
                Radon                     Natural decay of uranium                      Lung cancer, leukemia                    [26,32]
                                                                   Particulate Matter
        Ultra-fine particles              Cooking, combustion activities                Serious impact on heart and lungs        [7,26]

                                        1.3. Purpose of Study
                                              With the continuous growth of the population and economy, demand for high quality
                                        of life has introduced different new elements in indoor building environments. Addition-
                                        ally, different types of buildings are changing with time, which has an impact on IAQ and
                                        human health. Therefore, it is of utmost importance to analyze the IAQ in diverse end-use
                                        buildings to determine each possible indoor pollutant in specific kinds of buildings that
                                        are responsible for adverse health impacts. Despite the two decades of IAQ research from
                                        different perspectives, there is still a lack of organized evaluation of peer-reviewed IAQ
                                        studies that specifically cover both residential and commercial building environments.
                                        These would help to understand the factors influencing IAQ in different types of building
Int. J. Environ. Res. Public Health 2021, 18, 3276                                                                                     4 of 25

                                        environments along with the capacity to highlight the progress and limitations of IAQ
                                        research worldwide. A wider understanding of the relation between different building
                                        characteristics and air pollutant concentrations is required to enable possible sustainable
                                        solutions for better IAQ.
                                              To address this gap, we reviewed scientific studies that focused on both residential
                                        and commercial building IAQ in different parts of the world. Therefore, the trends and
                                        gaps in scientific research for both the residential and commercial sectors that focus on
                                        quantitative changes in air parameters due to IAQ have been identified in this review.
                                        Moreover, we reviewed the internationally recognized IAQ standards and the sampling
                                        techniques applied in peer-reviewed studies. The breadth of this review was undertaken
                                        to support and accelerate future research on the design of optimal building environments
                                        to provide the best possible IAQ benefits for future healthy indoor spaces.
                                              To achieve these objectives, this review includes scientific studies from different
                                        relevant scientific databases. The remainder of this review paper is structured under
                                        four major headings that discuss (1) international IAQ standards and assessment methods,
                                        (2) residential buildings and IAQ assessment, (3) commercial buildings and IAQ assessment,
                                        and (4) the conclusions and future scope.

                                        2. Methodology
                                              This review is formulated based on peer-reviewed journal articles from several
                                        renowned databases, such as ScienceDirect, Wiley Online Library, and Taylor & Fran-
                                        cis. We mostly focus on papers published in the last twenty years to realize the periodical
                                        progress in scientific research. A few journal papers from other databases are also reviewed
                                        here (such as ACS), as mentioned in Figure 2. As this review considers the IAQ of both
                                        residential and commercial buildings, the home spaces where people spend majority of
                                        their time, as well as IAQ in two different commercial buildings (offices and educational
                                        institutes), have been reviewed. Other types of commercial buildings, such as hospitals,
                                        malls, and restaurants, are beyond the scope of this review because the percentage of time
                                        spent in these spaces is insignificant as compared to that spent in offices and educational
                                        institutes. In this review, we attempt to describe the progressive trend of IAQ research
                                        around the world; therefore, peer-reviewed journals across the world were considered.
                                        Along with the journal papers, a few conference papers and government reports were also
                                        analyzed to enhance the quality of the review.
                                              A database search was completed using several combinations of keywords, e.g., IAQ,
                                        residential building, commercial building, office, school, indoor air pollution, educational
                                        institute, home, and IAQ standards. These keywords were searched in the journal title,
                                        abstract, and keywords for primary selection of peer-reviewed papers (phase 1 in Figure 2).
                                        A total of 1095 peer-reviewed journal articles and other papers, and reports were returned
                                        after the primary search from where 414 articles were selected after the careful screening
                                        of the article titles, keywords, and quick screening of the article’s outline. Screening in
                                        phase 1 has been done to eliminate those articles that are qualitative in nature and focus on
                                        IAQ for other types of commercial buildings such as hospitals, malls, restaurants which
                                        are beyond the scope of this review study. To search conference papers and reports, these
                                        keywords were searched only in the title. After the preliminary search, phase 2 included a
                                        three-stage literature filtration process. In the first step of the literature filter (filtration step
                                        1), elimination was performed after careful reading of the abstracts, based on the inclusion
                                        criteria. This phase resulted in 84 studies. Next, we screened the full texts of the remaining
                                        84 studies thoroughly, which resulted in 69 studies for further review. Finally, duplicate
                                        articles were eliminated, resulting in 61 papers for final review. The selected studies were
                                        classified into specific categories according to the aim of the review. Figure 2 shows the
                                        literature search overview with the selection criteria.
Int. J. Environ. Res. Public Health 2021, 18, 3276                                                                             5 of 25

                                                     Figure 2. Literature search criteria and steps.

                                        3. IAQ Standards & Assessment Methods
                                             The quality of indoor air is crucial because people spend a significant portion of their
                                        time in different indoor spaces and also because of the presence of numerous pollution
                                        sources in indoor spaces, such as traditional and newly developed building materials,
                                        finishing products, furniture, cooking systems, and cleaning agents. Therefore, several in-
                                        ternational organizations worldwide, such as the WHO, have set guidelines and threshold
                                        values to maintain an optimal IAQ (Table 2). Apart from the WHO, the most recognized
                                        organizations involved in IAQ regulations include the American Society of Heating, Re-
                                        frigerating, and Air-Conditioning Engineers (ASHRAE), US EPA, National Health and
                                        Medical Research Council in Australia, Health Canada, State Environment Protection
                                        Agency in China, Hong Kong Indoor Air Quality Objectives, Danish Society of Indoor
                                        Climate, Finnish Society of Indoor Air Quality and Climate, and Singapore Indoor Air
                                        Quality Guidelines [33].
Int. J. Environ. Res. Public Health 2021, 18, 3276                                                                                                                                               6 of 25

                                                              Table 2. Standards for indoor air quality (IAQ) by international organizations/Government.

    Parameters                  CAS                   WHO [34]         Singapore [35]      NIOSH [36]         Canada [37]         China [38]          UK [39]       Australia [40]    US EPA [41]
                                                 No safe level of
                                                                                                                                  90 ug/m3
  Benzene (C6 H6 )             71-43-2           exposure can be              -                  -                  -                                      -               -               -
                                                                                                                                  [1 h avg.]
                                                  recommended
                                                   100 mg/m3
                                                                                            5000 ppm                                                 15,000 ppm
                                                     (15 min)
 Carbon Di-oxide                                                         1000 ppm            (8 h avg)       ≤6300 mg/m3          1000 ppm          (15 min avg.)    30,000 ppm
                              124-38-9           35 mg/m3 (1 h)                                                                                                                        800 ppm
     (CO2 )                                                              (8 h avg.)        30,000 ppm        (≤3500 ppm)         (daily avg.)         5000 ppm      (15 min avg.)
                                                 10 mg/m3 (8 h)
                                                                                             (15 min)                                                (5 min avg.)
                                                 7 mg/m3 (24 h)
                                                     86 ppm
                                                  (15 min avg.)
                                                 51 ppm (30 min                                                ≤11 ppm                                                                  35 ppm
     Carbon                                                              10 mg/m3                                                                                        9 ppm
                                                       avg.)                                 35 ppm             (8 h avg)        5.0 mg/m3          11.6 mg/m3                           (1 h)
    mono-oxide                630-08-0                                    (9 ppm)                                                                                   (10,000 µg/m3 )
                                                     25 ppm                                 (8 h avg.)         ≤25 ppm           (daily avg.)        (8 h avg.)                         9 ppm
      (CO)                                                               (8 h avg.)                                                                                    (8 h avg.)
                                                    (1-h avg.)                                                 (1 h avg.)                                                                (8 h)
                                                     8.6 ppm
                                                    (8-h avg.)
                                                 mg/m3 (30 min)         0.1 ppm (120        0.016 ppm                                                  2 ppm
                                                                                                                                 0.12 mg/m3                          2500 µg/m3       920 µg/m3
  Formaldehyde                 50-00-0             0.2 mg/m3               µg/m3 )           0.1 ppm           120 µg/m3                           (15 min avg.)
                                                                                                                                  (1 h avg.)                        (15 min avg.)        (8 h)
                                                  (long term)             (8 h avg.)         (15 min)                                              (2500 µg/m3 )
                                                      0.01 mg/m3
   Naphthalene                 91-20-3                                        -                  -                  -                  -                   -               -               -
                                                     (annual avg.)
                                                 200 µg/m3 (1 h)                                              ≤100 µg/m3                          200 µg/m3 (1 h)
      Nitrogen                                                                                                                   0.10 mg/m3
                             10102-44-0             40 µg/m3                  -           1 ppm (15 min)     ≤480 µg/m3 (1                           40 µg/m3              -          0.053 ppm
      dioxide                                                                                                                    (daily avg.)
                                                  (annual avg.)                                                    h)                                 (1 year)
    Polycyclic                                       No threshold
     aromatic                  83-32-9                  can be                -                  -                  -                  -                   -               -               -
   hydrocarbons                                      determined
                                                      4.3 × 10⁻⁷
 Trichloroethylene             79-01-6                  µg/m3                 -                  -                  -                  -                   -               -               -
                                                      (unit risk)
Int. J. Environ. Res. Public Health 2021, 18, 3276                                                                                                                                      7 of 25

                                                                                                 Table 2. Cont.

    Parameters                  CAS                   WHO [34]       Singapore [35]    NIOSH [36]          Canada [37]     China [38]        UK [39]        Australia [40]    US EPA [41]
                                                      0.25mg/m3
 Tetrachloroethylene          127-18-4                                      -                -                    -             -                -                -                 -
                                                     (annual avg.)
                                                                        0.05 ppm
                                                                                                           ≤240 µg/m3      0.1 mg/m3                         0.1 ppm (1 h)   0.12 ppm (1 h)
       Ozone                 10028-15-6                    -            (8 h avg.)       0.1 ppm                                          100 µg/m3 (8 h)
                                                                                                              (1 h)         (1 h avg.)                      0.08 ppm (4 h)   0.08 ppm (8 h)
                                                                     (0.100 mg/m3 )
                                                                                                                                                                              0.5 ppm (3 h)
                                                                                                           ≤50 µg/m3                                        0.25 ppm (10
   Sulfur dioxide                                                                     2 ppm (8 h avg.)                     0.15 mg/m3                                        0.14 ppm (24 h)
                             7446-09-5                     -                -                             ≤1000 µg/m3                            -               min)
       (SO2 )                                                                         5 ppm (15 min)                       (daily avg.)                                         0.03 ppm
                                                                                                            (5 min)                                         0.2 ppm (1 h)
                                                                                                                                                                                 (1 year)
                                                                                                            30–80%—
    Relative
                                   -                       -
Int. J. Environ. Res. Public Health 2021, 18, 3276                                                                                     8 of 25

                                             Health problems due to IAQ, which are more commonly respiratory-related diseases
                                        and allergies, have increased the importance of IAQ measuring techniques and associated
                                        tools. Therefore, device types and monitoring systems of different indoor air pollutants
                                        were extensively reviewed. Table 3 shows a summarized list of identified indoor pollutants
                                        and devices used for pollutant detection.

                                                     Table 3. Common IAQ measurement techniques.

      Sampling Item                      Sampling Methods/Tools                   Sampling Duration/Cautions                  Ref.
                                 Q-Trak monitor (TSI Inc.):                  Sampling duration: 7 days, 10 min
                                                                                                                         [30,35,37,42,43]
                                 Nondispersive infrared analyzer             (min) average
  CO2 , RH, temperature          Integrated data loggers (Hobo HO-8)         Sampling in every 5 min                           [44]
                                 Indoor air quality meter (IAQ-CALC
                                                                             NA                                                [45]
                                 model 7545)
                                 Electrochemical sensor (Draeger Pac III)    Sampling duration: 7 days,
             CO                                                                                                                [46]
                                 FIM CO- Tester Tx for exhaled air           5 min average
                                 Passive samplers (Palmes tubes)
            NO2                  containing triethanolamine absorbent        NA                                              [47,48]
                                 and analyzed by a spectrophotometer
                                 Dust-Trak air monitor (Model 8520, TSI      Sampling rate: 1.7 L/min,
                                                                                                                               [49]
                                 Inc.), Light scattering                     1-min interval
                                 Pumped gravimetric method                   Sampling duration: 24 h                           [50]
                                 Model 2100 Mini- Partisol air sampler       37 mm diameter membrane (2 µm
                                 (Ruprecht & Patashnick Co.) coupled to      porosity) was used to collect                     [46]
            PM10                 a ChemPass model 3400                       particulate matters
                                 GRIMM environmental dust monitor,           Sampling rate: 1.2 L/min, for 2 weeks
                                                                                                                               [45]
                                 light scattering technology                 (suitable for PM2.5 and PM1 also)
                                 Minivol portable air sampler
                                                                             Filter conditioned in dry air for 48 h,
                                 (Airmetrics, PAS 201) with pall flex                                                          [51]
                                                                             sampling duration 5–7 h
                                 membrane filter (47 mm)
                                                                             Sampling rate: 1.8 L/min using a
                                                                             personal impactor, duration: 5 p.m. to
                                 PTFE filters (37-mm diameter,               8 a.m. on weekdays and 24 h on
                                                                                                                               [47]
                                 2-µm porosity)                              weekends. Passive samplers and PM
            PM2.5                                                            filters were stored in a freezer to keep
                                                                             them cool and avoid sunlight exposure
                                 Low volume sampling pump (model
                                                                             Every 5 min intervals                           [52,53]
                                 224-PCXR8) with PEM impactor
                                 Burkard single stage impactor (Burkard
                                                                             Sampling rate: 10 mL/min for 9 min,
     Airborne bacteria           Manufacturing Co. Ltd.) with an agar                                                          [49]
                                                                             incubated at 35 ◦ C in an oven for 2 days
                                 plate, followed by colony counting
                                                                             Sample should be refrigerated and
                                 SKC formaldehyde monitoring kit:            protected from sunlight and
                                                                                                                               [49]
                                 Colorimetric method                         immediately sent to the air laboratory
                                                                             for analysis within 1 h
                                 Sample collection: Portable pump
           HCHO
                                 (Flec-FL. 1001 or Sibata) with
                                                                             30 min ventilation of housing unit
                                 2,4-DNPH cartridge connected with
                                                                             followed by 5 h of sealing. Samples               [54]
                                 ozone scrubber. Analysis: two stage
                                                                             were taken after that, 30 min each.
                                 thermo desorption followed by gas
                                 chromatography/mass spectroscopy
Int. J. Environ. Res. Public Health 2021, 18, 3276                                                                            9 of 25

                                                                 Table 3. Cont.

      Sampling Item                      Sampling Methods/Tools                   Sampling Duration/Cautions         Ref.
                                 Radial diffusive samplers filled with
                                 2,4-dinitrophenylhydrazine
                                 (2,4-DNPH)-coated Florisil (Radiello®
                                                                           Sampling duration: 2 weeks               [47,48]
                                 code 165), analyzed by liquid
                                 chromatography with detection by
                                 UV absorption
           HCHO
                                 Diffusion sampler SKC UMEx100 based
                                 on chemosorbtion on 2,4-dintrophenyl
                                                                           Sampling duration: 1 week                 [42]
                                 htydrazine, analyzed by
                                 liquid chromatography
                                 Air pull through 2,4-dinitrohydrazine
                                 (DNPH) coated silica gel cartridge        Sampling rate: 0.2 L/min for 40 min      [51,55]
                                 (Supeleo LPDNPH S10)
                                 Mass flow controllers (Model No.
                                 FC4104CV-G, Autoflow lnc.) trapped
                                 by Nutech Cryogenic Concentrator
                                                                           Sampling rate: 0.011 L/min for 8-h        [49]
                                 (Model 3550A), analyzed by Hewlett
                                 Packard Gas Chromatography (GC)
                                 (Model HP6890) using TO-14 method
                                                                           Exposure period of three days to
                                 Diffusive samplers                                                                  [50]
                                                                           two weeks
                                 Radial diffusive sampling onto
                                 carbograph 4 adsorbents (Radiello®
                                                                           Sampling duration: 7 days                [46,47]
                                 code 145), analyzed by gas
                                 chromatography-mass spectrometry
                                 Passive sampling (diffusion principle)
                                                                           Middle of the room, height: 1.5 to 2 m    [56]
                                 with organic vapor monitors
                                 Thermal desorption tube, analyzed by
            VOC                  gas chromatograph/mass selective          Sampling rate: 0.07∼0.1 L/min            [44,55]
                                 detector (GC/MSD)
                                 Proton transfer reaction mass
                                                                           Sampling duration: Less than 5 min        [57]
                                 spectrometer (PTR-MS)
                                 Tenax-TA tubes, analyzed by
                                 gas-chromatography with flame
                                                                           Sampling rate: 20 mL/min for 40 min      [48,51]
                                 ionization detection (Varian, model
                                 3700) & modified thermal desorption
                                 Air pumped through a charcoal filter
                                                                           Sampling rate: 250 mL/min for 4 h         [42]
                                 (Anasorb 747)
                                 Air collected on adsorbent tubes and
                                 analyzed by gas chromatography-           Sampling rate: 100 mL/min for 100 min     [58]
                                 mass spectrometry
                                 Organic vapor sampler, adsorbed on
                                 activated charcoal column, analyzed by
                                                                           Sampling duration: 8 h                    [45]
                                 gas chromatography-
                                 mass spectrometry
                                 RCS sampler (Biotest air samplers)
             TBC                 following centrifugal                     Sampling rate: 40 L/min for 4 min         [51]
                                 impaction principle
Int. J. Environ. Res. Public Health 2021, 18, 3276                                                                            10 of 25

                                                                 Table 3. Cont.

      Sampling Item                      Sampling Methods/Tools                   Sampling Duration/Cautions           Ref.
                                 CR-393 alpha track diffusion radon
                                                                            Sampling duration: 3 months                [59]
                                 gas detectors
                                 Alpha Guard Professional
                                                                            Sampling duration: 1 week                  [43]
                                 Radon Monitor
              Rn                 Passive measurements of Radon
                                 volumic activity by accumulating alpha
                                                                            Sampling duration: 2 months                [46]
                                 radiation on 12 m cellulose nitrate film
                                 (Kodalpha dosimeter)
                                 Passive dosimeters (Kodalpha LR            Sampling duration: 2 months, only in
                                                                                                                       [47]
                                 115 detectors)                             heating season
                                 Gamma radiometer of the
          Gamma                  Geiger-Muller type (Saphymo                Sampling duration: 3–4 h                   [46]
                                 6150 AD6)
    Total Suspended
      Particulates &
                                 PVC filters (pore size 0.45 µm, diameter
  respirable suspended                                                      Sampling rate: 2.5 L/min                   [55]
                                 37 mm, SKC, USA)
   particulates (TSPs &
          RSPs)
                                 Airborne lead: mixed cellulose ester
                                 filter (pore size 0.8 µm, diameter
                                 37 mm), analyzed with a Varian
                                 GTA100 model graphite furnace
                                 mounted on a Varian SpectrAA-880
         Lead (Pb)                                                          Sampling rate: 4 L/min                     [55]
                                 model atomic absorption
                                 spectrophotometer based on NIOSH
                                 method 7105
                                 Surface lead: collected with wet tissues
                                 based on NIOSH method 9100
     Ammonia (NH3 )              Kitagawa precision gas detector tubes      NA                                         [42]
                                 Open-faced mixed cellulose ester filter
    Airborne asbestos                                                       Sampling rate: 2.5 L/min                   [55]
                                 (37 mm diameter and 0.8 µm pore size)
         Airborne                                                           Pore size 0.4 nm, sampling rate
                                 25 mm nucleopore filter                                                               [42]
      micro-organism                                                        2 L/min for 4 h
     Mold & bacteria             CAMNEA method                              Sampling rate: 4 h outside the window      [42]
     Bacterial aerosols          Swirling liquid impingers                  Sampling rate: 12.5 L/min                  [45]

                                        4. Residential Buildings and IAQ Assessment
                                             Realizing the potential risk of indoor air pollution, the Hong Kong government began
                                        establishing IAQ objectives in the last two decades. To fulfill this target, research has
                                        been performed to investigate the IAQ of local residential flats in Hong Kong [49]. Six
                                        housing were selected based on some pre-criteria, including three public rental houses
                                        and rest are private housing. Pre-criteria was developed to select those six homes, which
                                        includes housing type, highly populated location and finally housing not containing any
                                        newly purchased furniture during the sampling of indoor air. All the selected homes were
                                        occupied during the experiment, and both the kitchen and living room air was collected for
                                        investigation. The results of the investigation indicated that compared to the living room,
                                        the concentration of CO2 and PM10 were 14% and 67% higher in the kitchen, respectively.
                                        Similarly, the count of mean total bacteria was also 23% higher in the kitchen. Insufficient
                                        ventilation was indicated as the major reason for elevated CO2 level in the kitchen, whereas
                                        the impact of outdoor air infiltration, infrequent housekeeping, and mode of cleaning
                                        were found to have significant relation with higher PM10 level. The influence of cooking
Int. J. Environ. Res. Public Health 2021, 18, 3276                                                                            11 of 25

                                        using liquefied natural gas was considerably higher in the case of VOC release when
                                        compared to natural gas-based cooking. Both new and established dwellings were assessed
                                        in Melbourne, Australia, to determine the VOC and HCHO levels [60]. Although the
                                        results indicated lower concentrations of VOCs in established homes; however, compared
                                        to the outdoors, these concentrations were four times higher. Moreover, attached garages,
                                        faulty wool carpeting, and site contamination were highlighted as sites of higher VOC
                                        concentration inside homes. New or renovated buildings yielded one- or two-orders higher
                                        VOC emission as compared to established buildings.
                                             A study was conducted in Singapore to determine the relationship between the air
                                        quality inside bedrooms and sick building syndrome (SBS) for both naturally ventilated
                                        (NV) and air-conditioned (AC) systems [61]. The measured CO2 levels in NV bedrooms
                                        were lower than that in AC bedrooms. However, an opposite trend was observed in the
                                        case of particulate levels because NV bedrooms were found to have higher particulate
                                        levels. Another part of the assessment revealed higher SBS symptoms for residential
                                        occupants sleeping in AC bedrooms. As a part of the periodic assessment of building
                                        rules and regulations in England and Wales, several air quality parameters were examined
                                        in 37 homes [51]. This detailed study indicated gas cooking systems, occupancy, and
                                        location of the house as the three major contributors to a high level of inorganic gas
                                        emission. In accordance with the Canadian Environmental Protection Act (CEPA), a study
                                        was performed that investigated residential homes in Ottawa, Canada [58]. Compared to
                                        outdoor air, all targeted VOCs were present at a significant level in indoor air; however,
                                        their values were lower than that in the results of a study conducted in the previous year.
                                             To determine the relationship between indoor PM10 and oxidative damage to plas-
                                        mid DNA, a study was performed in China [62]. Houses with smokers and those with
                                        non-smokers were selected for air sampling. An investigation employing different tech-
                                        nologies revealed that the PM10 generated in the living rooms and kitchens of smokers
                                        was more toxic and could cause 50% plasmid DNA damage, whereas the homes of non-
                                        smokers contained lesser bio-reactive PM10 . The investigation determined that soot and
                                        unknown fine particles were responsible for plasmid DNA damage. To collect data on
                                        indoor pollutants, the Observatory on Indoor Air Quality in France examined a total of
                                        567 dwellings and focused on over 30 different pollutants; they published two separate
                                        research studies [46,63]. The major VOCs found in these dwellings were formaldehyde,
                                        toluene, acetaldehyde, m/p-xylenes, and hexaldehyde. Simultaneous measurement of
                                        20 VOCs in both indoor and outdoor spaces revealed that for a majority of the compounds,
                                        the median levels were considerably higher than those in outdoor spaces. Later in 2017,
                                        assessment of the same sampling size (567 dwellings) in mainland France was conducted
                                        to observe the relationship between measured air pollutants concentration and perceived
                                        IAQ [64]. In 2018, another study was conducted by OQAI (mandated by the French govern-
                                        ment) to assess the IAQ in energy-efficient buildings, which included both newly built and
                                        retrofitted buildings, based on standard quantification methods and questionnaires [47].
                                        These energy-efficient buildings have been defined as consuming 40–75 kWh/m2 of energy
                                        per year in the case of newly built housing and 64–120 kWh/m2 per year in the case of
                                        retrofitted buildings. An analysis of the experimental data revealed higher concentrations of
                                        hexaldehyde, alpha-pinene, and limonene as compared to those from the abovementioned
                                        French studies. IAQ assessment in selected urban slams in Delhi, India for all three seasons
                                        (summer, rainy season, and winter) revealed 10 times higher air pollutants concentration
                                        during the winter period compared to the permissible limit [65]. Household characteristics
                                        such as occupants age, family size, types of kitchen and fuel, window opening facilities
                                        have been described in this study. However, the information related to building structures
                                        and arrangements (e.g., flooring type, furniture used) were not mentioned.
                                             Despite the progress of the Korean government in the IAQ sector, a consumer agency
                                        survey reported that 14.5% of participants experienced SBS. Thus, a study was conducted to
                                        investigate the effects of several environmental factors on the IAQ of newly built apartments
                                        before and after occupancy, including construction characteristics, temperature, humidity,
Int. J. Environ. Res. Public Health 2021, 18, 3276                                                                              12 of 25

                                        and occupation duration [54]. This investigation concluded that the average pollutant
                                        levels were in accordance with the guidelines set by the Ministry of Environment, except for
                                        the levels of formaldehyde and toluene. The study also attempted to correlate the pollutant
                                        behavior with temperature and humidity and strongly suggested evaluating the IAQ based
                                        on the load ratio of major pollutant sources. Finally, the study observed a reduction in
                                        the pollutant levels to approximately half of the initial values after one year of occupancy.
                                        A comparative study on aromatic VOCs was performed for residential houses in China
                                        and Japan during the period from 2006 to 2007 [66]. Smoking-related investigations were
                                        not the focus of this study, which was a limitation because smoking is a major source of
                                        indoor VOCs. The concentrations of investigated indoor VOCs were considerably higher in
                                        China as compared to those in Japan and the outside VOCs, indicating higher indoor VOC
                                        concentrations than those outdoors in the case of China; however, the Japan case study
                                        yielded consistent results for both indoor and outdoor VOCs. The carcinogenic analysis
                                        conducted in this study revealed an alarming 10 times higher exposure risk in China as
                                        compared to that in Japan. IAQ assessment in highly populated and polluted Lodi Province,
                                        Italy was performed for both gaseous pollutants and particulate matters [67]. Investigation
                                        in both summer and winter seasons concluded crossing the threshold value set by WHO
                                        for PM and NO2 for some cases, where CO and O3 level were found satisfactory. Although,
                                        reduction of pollutants produced through indoor sources was highlighted. However, no
                                        clear information about household characteristics was provided. Indoor Air Pollution
                                        and Health (IAPAH) study in Ireland and Scotland focused on IAQ assessment in homes
                                        with open combustion source [68]. Households with four different heating fuel were
                                        assessed including peat, coal, wood, and cooking gas, along with households with no open
                                        combustion source but having smoker occupants. Analysis of the air parameters concluded
                                        satisfactory level of pollutants in the households using gas stoves or solid fuels according to
                                        the WHO guideline values. However, poor IAQ occurred in the households with cigarette
                                        smokers. To characterize the patterns of airborne VOCs, an extensive study was performed
                                        in Leipzig, Germany; this study measured 60 different VOCs using a survey [56]. They
                                        used two different methods to allocate VOC compounds to their source of origin. An
                                        analysis of the enormous amount of sampling data concluded that occupant behavior,
                                        furnishing materials, ventilation, natural activities, and/or a combination of these factors
                                        significantly influence IAQ. To study the IAQ in harsh desert climates, an evaluation of
                                        gaseous and particulate matters was performed in Emirati houses in the UAE [69]. An
                                        attached garage (
Int. J. Environ. Res. Public Health 2021, 18, 3276                                                                                                13 of 25

                                          in terms of their ventilation systems and current operations [59]. The small amount of
                                          sample data has been listed as a limitation of this study. The overall assessment concluded
                                          that passive houses mostly correspond with the threshold radon limit and perform better
                                          compared to conventional houses.
                                               Both quantitative and qualitative investigations of IAQ in rural communities (low-
                                          income families) were conducted to assess the impact of cooking fuels on PM2.5 and CO
                                          concentration in Paraguay [72]. A much higher concentration of PM2.5 and CO were found
                                          in houses using charcoal and wood compared to the houses using electricity and LPG for
                                          cooking, exceeding the recommended value by WHO. Impact of building retrofitting activ-
                                          ity on IAQ was assessed in multifamily housing in Lithuania and Finland [73]. Significant
                                          reduction in both fungal and bacterial concentration was found after retrofitting activity
                                          in Finnish housing, where the opposite trend was found for selected VOCs. Investigation
                                          in Lithuanian housing concluded significant increase in radon concentration as a result of
                                          retrofit. To assess the IAQ in both new and renovated housing with gas cooking burners,
                                          a study was performed in California where the resident density was higher [74]. This
                                          comparative study indicated 165% increase in NO2 , 18% increase in CO2 , 25% decrease in
                                          formaldehyde, and 4% decrease in PM2.5 when compared to a recent study performed in
                                          code-compliant ventilated California buildings. The later study was performed in 70 de-
                                          tached buildings in California and resulted in a significant decrease in formaldehyde and
                                          PM2.5 compared to the study conducted for the new homes in California for the period
                                          2006–2007 [75]. Although having limitations, these results are invaluable for the improved
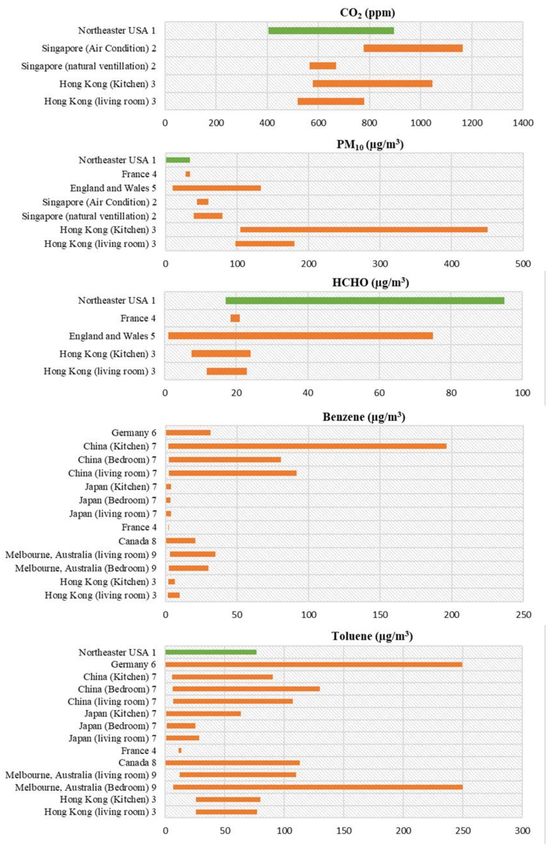
                                          IAQ in future retrofit housing. Figure 3 represents the range for five different indoor air
                                          pollutants concentration in residential buildings for selected countries discussed above,
                                          while Table 4 has summarized different aspects of residential IAQ studies.

                                     Table 4. Summary of the residential IAQ research in different locations.

      Investigation              Sample                     Study                                                                    Parameters
                                                                               Indoor Material            Ventilation
        Location                 Number                     Area                                                                     Examined
                                                                                                                                 CO2 , HCHO, PM10 ,
                                                                                Plastering wall,
                                                                                                                                   Bacteria, C6 H6 ,
       Hong Kong                                                                   wallpaper,          Natural ventilation
                                     6               Living room, Kitchen                                                     C6 H5 CH3 , C6 H5 CH2 CH3 ,
       (2002), [49]                                                            tile/wood/vinyl        with air conditioning
                                                                                                                                C6 H5 (CH3 )3 , CHCl3 ,
                                                                                     floor
                                                                                                                                       CH2 Cl2
        Australia               27 (ED) *                Living room,
                                                                                      NA                      NA                    VOC, HCHO
       (2002), [60]             & 4 (NB) *                 bedroom
                                                                                                                                CO2 , RH, particulate
        Singapore                                                                                      Natural ventilation
                                     3                    Bedroom                     NA                                       profile, bacteria, fungi,
       (2004), [61]                                                                                   with air conditioning
                                                                                                                                    temperature
                                                                                timber framed
                                                                                                       mechanical extract
                                                                                 construction,                                 NO2 , CO, HCHO, VOC,
    England & Wales                                  Living room, kitchen,                              ventilation and
                                    37                                             traditional                                           RH
      (2005), [50]                                       other rooms                                     passive stack
                                                                              brick/block frame,                              particulates, temperature
                                                                                                          ventilators
                                                                             cavity wall insulation
    Ottawa, Canada                                     Living room and
                                    75                                                NA                      NA                      37 VOCs
      (2005), [58]                                       family room
          China
                                     6               Living room, Kitchen             NA                      NA                        PM10
       (2007), [62]
                                                     Rooms, attached or                                                        CO, VOC, particles, Rn,
        France                                       integrated garages                                                        dog, cat and dust mite
                                    567                                               NA                      NA
     (2008), [46,63]                                   and outside the                                                          allergens, radon and
                                                         dwellings                                                                gamma radiation
Int. J. Environ. Res. Public Health 2021, 18, 3276                                                                                                   14 of 25

                                                                           Table 4. Cont.

      Investigation              Sample                     Study                                                                      Parameters
                                                                                  Indoor Material           Ventilation
        Location                 Number                     Area                                                                       Examined
                                                                                                                                   particulate matter
          India
                                     5                Kitchen, bedroom                  NA              Natural Ventilation      (RSPM), CO2 , CO, SO2 ,
       (2008), [65]
                                                                                                                                       and NO2
                                                                                   Wall & ceiling:                                 HCHO, VOC, C6 H6 ,
                                                     Living room, kitchen,
          Korea                                                                  Silk/Balpo, floor:                             C6 H5 CH3 , C6 H5 CH2 CH3 ,
                                    158               master room, other                                        NA
       (2009), [54]                                                                 PVC/wood,                                    (CH3 )2 C6 H4 , C6 H4 Cl2 ,
                                                             room
                                                                                  furniture: MDF                                     C6 H5 CH=CH2
                                                                                                                                 VOC (C6 H6 , C6 H5 CH3 ,
     China & Japan                                   Living room, kitchen,       Wallpaper (Japan);                                 C6 H5 CH2 CH3 ,
                             57 (Jp) & 14 (Ch)                                                                  NA
      (2009), [66]                                         bedroom                paint (China)                                      (CH3 )2 C6 H4 ,
                                                                                                                                     C6 H5 (CH3 )3
          Italy
                                    60                   Living room                    NA                      NA                  PM, NO2 , CO, O3
       (2011), [67]
   Ireland & Scotland
                                    100                  Living room                    NA                      NA                PM2.5 , CO, CO2 , NO2
       (2011), [68]
        Germany                                        Living or child’s
                                   2246                                                 NA                      NA                      60 VOC’s
       (2013), [56]                                         room
          UAE                                                                                                                    CO, HCHO, H2 S, NO2 ,
                                    628                  Family room                    NA                   Sealed AC
       (2014), [69]                                                                                                                SO2 , PM2.5 , PM10
                                                                                                                                     CO2 , CO, RH,
      United States                                                              Hardwood floors,        Natural ventilation
                                    17                       NA                                                                 temperature, particulate
       (2015), [70]                                                                  carpets            with air conditioning
                                                                                                                                  matter, VOC, HCHO
                                                                                  Low VOC carpet,
      United States                                    Living room and
                                    86                                          flooring, carpet pad,      HVAC system              PM, HCHO, VOC
       (2015), [71]                                         kitchen
                                                                                   zero VOC paint
         France                                      Bedroom and living                                     Mechanical          CO2 , RH, VOCs, HCHO,
                                    567                                                 NA
       (2017), [64]                                        room                                             ventilation               PM2.5 , PM10
                                                                               Lightweight/masonry                                 CO2 , CO, RH, NO2 ,
         France                                      Living room, master          facades, timber       Mechanical or hybrid       VOCs, HCHO, Rn,
                                    72
       (2018), [47]                                       bedroom                 frame, thermal            ventilation             airborne particles,
                                                                                     insulation                                        temperature
       Macedonia                                                                                                                Temperature, RH, TVOC,
                                    25                   Living room                    NA                      NA
       (2017), [6]                                                                                                                       PM
                                                                                                        Balanced mechanical
                                                                                                            heat recovery
    Northern Ireland                                   Main living area,
                                     5                                          Timber & Masonry           ventilation or                   Rn
      (2019), [59]                                        bedroom
                                                                                                         demand-controlled
                                                                                                         ventilation systems
        Paraguay
                                    80                     Kitchen                      NA                      NA                      PM2.5 , CO
       (2019), [72]
                                                                                                            Natural and
  Finland & Lithuania                                                                                                             CO, NO2 , VOCs, Rn,
                                    45                   Living room                    NA                  mechanical
       (2019), [73]                                                                                                                microbial content
                                                                                                            ventilation
                                                       Bedroom, living
    California, USA                                                                                         Mechanical
                                    23                  room, kitchen,                  NA                                      CO2 , NO2 , HCHO, PM2.5
      (2020), [74]                                                                                          ventilation
                                                         dinning area
    California, USA                                    Bedroom, living                                      Mechanical          CO2 , NO2 , HCHO, PM2.5 ,
                                    70                                                  NA
      (2020), [75]                                          room                                            ventilation          NOx, RH, temperature
      Notes: NA = Not available/applicable, ED = Established dwellings, NB = New buildings, C6 H5 CH3 = Toluene, C6 H5 CH2 CH3 =
      Ethylbenzene, C6 H5 (CH3 )3 = Trimethylbenzene, CHCl3 = Chloroform, CH2 Cl2 = Methylene chloride, (CH3 )2 C6 H4 = Xylene, C6 H4 Cl2 =
      1,4-dichlorobenzene, C6 H5 CH=CH2 = Styrene, H2 S = Hydrogen Sulfide.
Int. J. Environ. Res. Public Health 2021, 18, 3276                                                                                                 15 of 25

                                        Figure 3. Range for five different indoor air pollutants concentration in residential buildings for
                                        selected countries. The numbers with each country’s name refer to the references. The indoor air
                                        pollutants concentration data for residential buildings collected for different countries from the
                                        following references: 1: [70]; 2. [61]; 3. [49]; 4. [46,63]; 5. [50]; 6. [56]; 7. [66]; 8. [58]; 9. [60]. The green
                                        color bar represents study results for green building.
Int. J. Environ. Res. Public Health 2021, 18, 3276                                                                             16 of 25

                                        5. Commercial Buildings and IAQ Assessment
                                              The IAQ in schools has been one of the major concerns among researchers, because
                                        children are more susceptible to air pollutants than adults, and children spend a significant
                                        amount of time in schools. Similarly, the IAQ in office buildings has also been of particular
                                        concern because it significantly affects the productivity of workers. Realizing the research
                                        gap in this field, in 2003, a large number of commercial buildings (20 offices, 4 schools,
                                        1 hospital, and 1 nursing home), as well as dwellings and building products, were assessed
                                        to investigate the presence of indoor VOCs in Australia [76]. A total of 163 VOCs were
                                        identified in indoor environments as well as during the product analysis process, and a
                                        majority of the observed VOCs were released from different indoor building materials
                                        and a few surface finishes and appliances. The Korean government has also expended
                                        significant effort for improving educational conditions; as a part of these efforts, a few
                                        studies have been performed to characterize IAQ. To assess the severity of indoor air
                                        pollutants based on the age of school buildings, a study focusing on 55 different schools
                                        was conducted in Korea [51]. The factors that contributed to indoor air pollution in
                                        schools were listed as emissions of chemicals from building materials or furnishings
                                        and unsatisfactory ventilation. The HCHO concentration was found to be significantly
                                        higher than the standard value established by the Korean government. Considering
                                        the higher susceptibility of younger kids as compared to higher grade children, another
                                        study focusing on preschools was conducted in Korea [55]. The study concluded that
                                        preschools in urban areas have considerably higher indoor pollution levels as compared
                                        to the outside and rural preschool environments in Korea. In naturally ventilated office
                                        space inspection, influencing factors for indoor particulate matters were indicated as the
                                        nearby construction activity, indoor human movement, tobacco smoke, and computer
                                        operation [77]. Investigation of school IAQ in West Macedonia, Greece highlighted the
                                        presence of many times higher PM10 concentration compared to the outdoor in normal
                                        operation period [78]. To determine the correlation between indoor pollutant levels in
                                        several primary schools, a study was conducted in Belgium [79]. This study investigated 7–
                                        8-year-old school kids for exposure to NO2 , SO2 , O3 , BTEX (benzene, toluene, ethylbenzene,
                                        xylene isomers), and PM2.5 . Higher benzene concentrations were observed in lower level
                                        classrooms, and the carpet in classrooms was determined to be responsible for the higher
                                        PM2.5 concentrations.
                                              The impact of airborne fungi on the IAQ inside AC offices was assessed in compliance
                                        with the new IAQ policy of 2003 in Hong Kong [80]. The assessment yielded satisfactory
                                        results that indicated a decrease in the count of airborne fungi after applying the new
                                        IAQ policy, except for the CO and NO2 emission rates. To investigate ammonia (NH3 )
                                        contamination in an office located in Beijing, a study combining standard experiments
                                        and a questionnaire was conducted [42]. The results of this study were compared to
                                        the results gathered from the office of the same company located in Stockholm. This
                                        comparative study revealed a significantly higher concentration of NH3 (3–6 ppm) in the
                                        Beijing office, whereas its concentration was
Int. J. Environ. Res. Public Health 2021, 18, 3276                                                                           17 of 25

                                        role of humans in IAQ was assessed based on a university classroom in Boulder, Colorado,
                                        USA by a continuous VOC measurement process [57]. The VOC measurement analysis
                                        confirmed that respiratory emissions from human beings and reaction of O3 with their
                                        skin lipids affects the indoor VOC concentration. These human activities were found to be
                                        responsible for 40% of the daytime VOC. To investigate the IAQ for a range of climates in
                                        the US, another research group performed a simulation study using the building energy
                                        model “EnergyPlus,” and it was found that PM2.5 was mostly affected by changing weather
                                        patterns and ventilation systems, where CO2 , HCHO, NO3 , and O3 concentrations were
                                        independent of ventilation patterns [82].
                                              Particulate matters (PM) are considered as critical pollutants in most parts of India;
                                        this was determined while investigating a school in Chennai, India [45]. The significant
                                        concentrations of PMs were found to exceed the National Ambient Air Quality Standards in
                                        India. Rather than indoor pollution sources, outdoor sources, including ambient particles
                                        emitted by traffic, were found to be responsible for these concentrations. Another study
                                        focused on non-commercial buildings (offices and educational institutes) and IAQ was
                                        conducted in Delhi, India [52]. This study highlighted the significant impact of occupant
                                        density on indoor air pollution in the case of non-residential buildings. The CO2 concentra-
                                        tions in two office buildings were significantly higher than the ASHRAE baseline; moreover,
                                        the measured concentrations of pollutants in educational buildings were lower than those
                                        in office buildings. Ductless air conditioning systems and ineffective air circulation sys-
                                        tems were the primary contributors to the higher PM2.5 in the office buildings. A study
                                        conducted in two states of the UAE revealed the poor IAQ conditions in 16 elementary
                                        grade classrooms [83]. The measured concentrations of TVOC, CO2 , and particles were
                                        815 µg/m3 , 1605 ppm, and 1730 µg/m3 , respectively, whereas the recommended values
                                        for these concentrations established by the Dubai Municipality were 300 µg/m3 , 800 ppm,
                                        and 150–300 µg/m3 , respectively.
                                              To understand the influence of children’s activity on IAQ, an evaluation was per-
                                        formed in nursery schools located in Poland [84]. Investigated indoor pollutant concen-
                                        trations were found to be higher compared to the outside ones, such as PM2.5 and PM10
                                        that were in the ranges of 41.17–106.06 µg/m3 and 68.26–149.81 µg/m3 , respectively, ex-
                                        ceeding WHO indoor guidelines. The effect of increased ventilation on classroom IAQ
                                        was investigated in 18 classrooms in the Netherlands [85]. Results indicated a much
                                        lower concentration of endotoxin, b(1,3)-glucan, and PM10 because of increased ventilation,
                                        whereas there was no such effect on PM2.5 and NO2 levels. However, analysis of Italian
                                        classrooms concluded that greater manual airing resulted in higher sub-micrometric partic-
                                        ulate penetrations in indoor classroom environments [43]. An investigation of indoor air
                                        in office environments focused on PM2.5 and PM10 on both normal and dusty days over
                                        a 2-month period in Qatar [86]. The study concluded that significant concentrations of
                                        PMs in indoor spaces are mainly caused by ventilation, faulty building envelopes, and
                                        windows. In comparison with the ASHRAE and US EPA IAQ standards, concentration
                                        of CO2 and particulate matters were much higher during a study of Qatari schools, and
                                        outdoor PM levels were identified as the main reason for high indoor particulate matter
                                        levels [87]. A study of Turkish university classrooms concluded higher CO2 and PM lev-
                                        els and observed a radon concentration that was lower than the standard value set by
                                        the International Commission on Radiological Protection, but it was higher than other
                                        worldwide values [88]. To increase the knowledge about IAQ in modern offices, a project
                                        was performed in Europe that focused on newly built and refurbished office buildings
                                        in Europe [53]. All the indoor pollutants, except xylene, showed significant variations
                                        for different seasons (summer and winter). The association between human health and
                                        IAQ assessment indicated a higher PM2.5 concentration, whereas formaldehyde, ozone,
                                        acrolein, α-pinene, and D-limonene concentrations were in acceptable ranges. This study
                                        recommended to perform a pollution assessment in at least two different time periods
                                        during a year along with an assessment of both ground and highest floors. Under the same
Int. J. Environ. Res. Public Health 2021, 18, 3276                                                                                  18 of 25

                                        project, another study showed a correlation between aldehyde, VOC levels, and factors
                                        associated with building structures and resident behavior [89].
                                             Recently, new low-energy regulations for new buildings in the European Union
                                        stipulated that all new schools built in this region should follow airtight and energy-efficient
                                        envelope. To investigate the IAQ of these newly built low-energy preschools in Sweden,
                                        a comparative study was performed [48]. A strong relationship was found between IAQ
                                        and the functioning level of the ventilation system. The comparative study concluded
                                        that the preschool manufactured with Swan eco-labeled materials emitted fewer initial
                                        TVOCs compared to preschools made with conventional materials. In compliance with this
                                        trend, seven low-energy schools in Sweden were also investigated, and analysis of the data
                                        confirmed a satisfactory temperature and CO2 level as set by the Swedish guidelines [90].
                                        Investigation of IAQ in schools located in a highly polluted area of southern Italy was
                                        performed, which resulted in higher CO2 , NO2 , PM 2.5 , and endotoxin levels, whereas
                                        the Der p 1 allergen level was found to be below the threshold limit [91]. Table 5 has
                                        summarized the IAQ studies in different locations.

                              Table 5. Summary of the commercial buildings IAQ research in different locations.

     Investigation                 Sample               Seasonal              Indoor                                     Parameters
                                                                                                  Ventilation
       Location                    Number               Variation             Material                                   Examined
                            20 office, 4 schools,
       Australia
                               1 hospital &                NA                   NA                    NA                    VOC
      (2003), [76]
                                1 old home
                                                                           Pressed wood                               CO, CO2 , PM10 ,
         Korea                    55 schools,        Summer, autumn,                            Mainly naturally
                                                                           desks, chairs,                              TBC, TVOCs,
      (2007), [51]               30 std/class           winter                                    ventilated
                                                                            furnishings                                   HCHO
                                                                           Concrete, floor
                                                                                                                      TSPs, RSPs, lead,
         Korea                 17 pre-schools        Late spring and        covered with           Naturally
                                                                                                                      asbestos, TVOCs,
      (2011), [55]            (71 classrooms)           summer            linoleum/wood,           ventilated
                                                                                                                      HCHO, and CO2
                                                                              no carpet
                                                                          glazed windows.
        Greece                         3                                  Painted gypsum
                                                          Spring                               Natural ventilation           PM
      (2007), [77]                  (office)                             board wall, plastic
                                                                           tiles, no carpet
        Greece                         1             Summer, fall, and
                                                                                NA             Natural ventilation     PM10 , O3 , CO
      (2008), [78]                 (school)             winter
                                                                                                                     PM2.5 , K, Ca, Ti, V,
                                                                                                                     Cr, Mn, Fe, Ni, Cu,
                                                                                                                     Zn, Br, Pb, Al, Si, S,
  Antwerp, Belgium                   27              Winter and early                                                Cl, NO2, SO2 , O3 ,
                                                                                NA             Natural ventilation
     (2008), [79]             (primary school)          summer                                                           and C6 H6 ,
                                                                                                                         C6 H5 CH3 ,
                                                                                                                       C6 H5 CH2 CH3 ,
                                                                                                                      and (CH3 )2 C6 H4
                                                                                                 mechanically
      Hong Kong                        82                                                                              Airborne fungi
                                                           NA                   NA              ventilated and
      (2008), [80]                  (office)                                                                               count
                                                                                                air-conditioned
                                                                                                                     RH, HCHO, VOCs,
        Beijing                        2             Spring and early                             Mechanical
                                                                                NA                                    NH3 , CO2 , mold
      (2009), [42]                  (office)             summer                                   ventilation
                                                                                                                       and bacteria
                                                                                                                      Ventilation rates,
                                                                                                                         VOCs and
    Michigan, USA                     64             Spring and early                             Mechanical
                                                                               Carpet                                 bioaerosols, CO2 ,
     (2007), [44]                  (school)              summer                                   ventilation
                                                                                                                          RH, and
                                                                                                                        temperature
Int. J. Environ. Res. Public Health 2021, 18, 3276                                                                                    19 of 25

                                                                  Table 5. Cont.

     Investigation                 Sample               Seasonal               Indoor                                      Parameters
                                                                                                   Ventilation
       Location                    Number               Variation              Material                                    Examined
                                                                                                 Rooftop heating,        Black carbon,
   California, USA                    37
                                                          NA                       NA           ventilation, and air    PM2.5 , PM2.5-10 ,
     (2012), [81]             (office & others)
                                                                                                conditioning units           PM10
  Colorado Boulder,
                                      1                                                           Dedicated air
        USA                                              Spring           Latex paint in wall                                 VOC
                                 (university)                                                     handling unit
     (2016), [57]
                                                                                                  2 Mechanical
         USA                                                                                                           CO, CO2 , HCHO,
                                       14              All seasons                 NA            ventilation & 2
      (2016), [82]                                                                                                      NO2 , O3 , PM2.5
                                                                                                natural ventilation
                                                                                                                       PM10 , PM2.5 , PM1 ,
    Chennai, India                     1
                                                     Winter & summer               NA           Natural ventilation      CO, HCHO,
     (2012), [45]                  (school)
                                                                                                                         bioaerosols
      Delhi, India                     3
                                                        June-July          Concrete flooring      Air condition        CO2 , PM2.5 , VOC
      (2017), [52]            (2 office & 1 EB*)
  Dubai & Fujairah,                   16                                                                                TVOC, CO2 , O3 ,
       UAE                       (elementary         Summer & winter               NA                   NA                CO, particle
    (2014), [83]                    school)                                                                              concentration
                                                                                                 Stack ventilation     VOC, PM, bacterial
   Gliwice, Poland                   2
                                                         Winter                    NA               and airing            and fungal
     (2015), [84]             (Nursery school)
                                                                                                                        bioaerosol, CO2
                                                                                                                          Endotoxin,
      Netherland,                    17                                                             Naturally
                                                         Winter                    NA                                   b(1,3)-glucans,
      (2015), [85]            (Primary school)                                                      ventilated
                                                                                                                       PM10 , PM2.5 , NO2
                                                                            Single/double
         Italy                  7 school (16                                                                            CO2 , particulate
                                                     Winter & spring        glazed Al/Fe          Manual airing
      (2016), [43]              Classrooms)                                                                            concentration, Rn
                                                                               window
         Qatar                        1
                                                        Summer                     NA                 HVAC                PM10 , PM2.5
      (2017), [86]            (Office Building)
                                                                                                                        temperature, RH,
         Qatar                      16                                      Floor: vinyl or        Mechanically           CO, CO2 and
                                                         Winter
      (2017), [87]            (urban schools)                                ceramic tile           ventilated         particulate matters
                                                                                                                       (PM10 and PM2.5 )
                                                                          Desk & table: MDF
                                                                                                                       Temperature, RH,
                                       4                                      veneered
        Turkey                                                                                       Natural            CO2 , Rn, PM0.5 ,
                                 (university         Winter & summer         compressed
      (2018), [88]                                                                                  ventilation          PM1.0 , PM2.5 ,
                                 classrooms)                              chipboards, Door:
                                                                                                                       PM5.0 , and PM10
                                                                             woodwork
        Europe                         37                                                       Mostly mechanical      VOC, HCHO, O3 ,
                                                     Winter & summer               NA
      (2016), [53]                  (office)                                                       ventilation           NO2 , PM2.5
                                                                            Synthetic floor
                                                                                covering,
                                                                             dispersion or
                                                                             emulsion wall                                HCHO, VOC,
        Europe,                   37 office                                                     Mostly mechanical
                                                     Winter & summer        paint, furniture:                            PM2.5 , O3 , NO2 ,
      (2019), [89]            (140 office room)                                                    ventilation
                                                                               wood and                                 temperature, RH
                                                                           derivatives (45%)
                                                                            or metal (31%),
                                                                           ceiling: synthetic
Int. J. Environ. Res. Public Health 2021, 18, 3276                                                                              20 of 25

                                                                Table 5. Cont.

     Investigation                 Sample               Seasonal             Indoor                                   Parameters
                                                                                                Ventilation
       Location                    Number               Variation            Material                                 Examined
                                                                                                                   Temperature, RH,
                                                                                                Heat recovery         particle-size
        Sweden                        4                                    Low emitting
                                                       All seasons                            ventilation & heat   distribution, CO2 ,
      (2019), [48]               (preschool)                                 materials
                                                                                             recovery with DCV     NO2 , HCHO and
                                                                                                                         TVOC
                                                                                                Mechanical
                                                                                              ventilation with
        Sweden                    7 school
                                                     Summer & winter             NA              DCV and           Temperature, CO2
      (2019), [90]            (145 classrooms)
                                                                                               centralized air
                                                                                               handling units
                                                                                                                   Temperature, RH,
                                                                                                                   CO2 , NO2 , PM2.5 ,
                                    12                                                                                 biological
    Southern Italy
                             (lower secondary        Summer & winter             NA          Natural ventilation      pollutants in
     (2019), [91]
                                 schools)                                                                             indoor dust
                                                                                                                    (endotoxins and
                                                                                                                        Der p 1)

                                        6. Conclusions and Future Scope
                                             This paper, which discusses the last 20 years of indoor air research, aimed to review the
                                        IAQ sector from different aspects to understand the interaction between IAQ and building
                                        environments, which were mainly residential and a few commercial buildings. Since
                                        people spend over 85–90% of their time in different buildings, the IAQ of different types of
                                        building can have a major impact on human health. Therefore, this paper has done a review
                                        on the current state of the art and knowledge related to the IAQ of different residential and
                                        commercial buildings. Moreover, to understand the progress in IAQ research around the
                                        world, studies from different countries were reviewed. Region/location-specific review
                                        can also be beneficial to identify the major indoor air pollutant in each location, which
                                        need to be addressed for long term solutions. Hence, this review aimed to benefit building
                                        professionals when creating new indoor air regulations, considering major air pollutants, all
                                        indoor contaminant sources, and related health impacts, to create healthy and sustainable
                                        building environments.
                                             Most of the developed countries consider and follow IAQ regulations during the
                                        design and maintenance phase of building environments through appropriate measures.
                                        However, this scenario is not similar in developing or underdeveloped countries, where
                                        poor IAQ disproportionately affects children, women, and elderly persons [92]. Despite the
                                        severe impact of exposure to indoor air pollutants, there is still a lack of proper scientific
                                        research on IAQ in most developing and underdeveloped countries/regions. Analysis
                                        of peer-reviewed journals during this review indicated that primarily developed and a
                                        few developing countries are more interested in exploring IAQ in terms of the human
                                        health impact, whereas underdeveloped countries still lack IAQ-focused research. The
                                        pattern of indoor air pollutants in developing and underdeveloped countries and the
                                        consequences to health should be studied more, which can provide a baseline to determine
                                        more beneficial IAQ policies in these regions. Therefore, more research is needed in these
                                        regions to ensure healthy and sustainable building environments worldwide. Along with
                                        indoor pollution sources, the situation of IAQ is worse in some regions because of outdoor
                                        climatic conditions, such as high humidity, temperature, and dust intensity, such as in GCC
                                        countries. However, studies that have focused on the IAQ situation in GCC countries have
                                        mostly excluded detailed VOC evaluations.
                                             The reviewed studies commonly examined some parameters, such as PM, volatile
                                        matters, carbon dioxide, and carbon monoxide; however, most have focused on selected
Int. J. Environ. Res. Public Health 2021, 18, 3276                                                                                   21 of 25

                                        VOCs. Although a few studies have analyzed VOCs in detail, most limited their studies to
                                        estimating TVOC, benzene, toluene, xylene, and ethylbenzene. Most studies have preferred
                                        to use gas chromatography-mass spectrometry to analyze VOCs, showing that it is the most
                                        popular detection method for VOCs. Among the reviewed studies, analysis of carcinogenic
                                        air pollutants, such as radon, was rare. Additionally, few studies have clearly reported
                                        the building materials in walls or floors, whereas others did not mention the finishing
                                        type, furniture material, cleaning agent, household activities, which are highly critical
                                        elements for analyzing IAQ. Similarly, most studies focusing on commercial building’s
                                        IAQ have not specified the specific detail of the indoor materials that has the most impact
                                        on the air pollution. However, building structure and/or materials, surface finishes, and
                                        resident’s activity in general have been indicated as the major reasons for the elevated VOC
                                        concentration in the reviewed commercial buildings. Similarly, outside PM level and/or
                                        nearby construction process, tobacco smoke, presence of carpet, human movement have
                                        been identified for rise in indoor PM level where concrete additives has been indicated
                                        as the responsible element for higher indoor NH3 concentration. Moreover, inter-relation
                                        model or equation between pollutants concentration and pollution source inside building
                                        environment was not clearly presented in the reviewed studies. Therefore, this study
                                        recommends more studies focusing on detailed assessment of exposure concentration
                                        along with the identification of responsible sources in each type of building environment.
                                             Of note, direct comparison of indoor air pollutant levels is difficult and not straightfor-
                                        ward because evaluations have been conducted over different time periods, using different
                                        instruments and sampling techniques, and in different indoor environments. Thus, it
                                        is highly recommended that more detailed scientific studies be conducted by following
                                        standardized regulations, which will allow for an inter-comparison of IAQ from studies in
                                        the future to close the existing knowledge gaps regarding IAQ.

                                        Author Contributions: Conceptualization, M.M. and S.G.A.-G.; Formal analysis, M.M. and S.G.A.-G.;
                                        Funding acquisition, S.G.A.-G.; Investigation, M.M.; Methodology, M.M. and S.G.A.-G.; Project
                                        administration, S.G.A.-G.; Supervision S.G.A.-G.; Writing—original draft, M.M.; Writing—review &
                                        editing S.G.A.-G. All authors have read and agreed to the published version of the manuscript.
                                        Funding: This research received no external funding.
                                        Institutional Review Board Statement: Not applicable.
                                        Informed Consent Statement: Not applicable.
                                        Data Availability Statement: No new data were created or analyzed in this study. Data sharing is
                                        not applicable to this article.
                                        Acknowledgments: This research was supported by a scholarship (210004673) from Hamad Bin
                                        Khalifa University (HBKU) a member of Qatar Foundation (QF). Any opinions, findings, and
                                        conclusions or recommendations expressed in this material are those of the author(s) and do not
                                        necessarily reflect the views of HBKU or QF.
                                        Conflicts of Interest: The authors declare no conflict of interest.

References
1.    Klepeis, N.E.; Nelson, W.C.; Ott, W.R.; Robinson, J.P.; Tsang, A.M.; Switzer, P.; Behar, J.V.; Hern, S.C.; Engelmann, W.H. The
      National Human Activity Pattern Survey (NHAPS): A resource for assessing exposure to environmental pollutants. J. Expo. Anal.
      Environ. Epidemiol. 2001, 11, 231–252. [CrossRef]
2.    Sundell, J. On the history of indoor air quality and health. Indoor Air Suppl. 2004, 14, 51–58. [CrossRef] [PubMed]
3.    EPA. Indoor Air Pollution and Health. Report Series No. 104. 2013. Available online: https://www.epa.ie/pubs/reports/
      research/health/IndoorAirPollutionandHealth.pdf (accessed on 23 March 2020).
4.    Sisask, M.; Värnik, P.; Värnik, A.; Apter, A.; Balazs, J.; Balint, M.; Bobes, J.; Brunner, R.; Corcoran, P.; Cosman, D.; et al. Teacher
      satisfaction with school and psychological well-being affects their readiness to help children with mental health problems. Health
      Educ. J. 2014, 73, 382–393. [CrossRef]
5.    Jones, A.P. Indoor air quality and health. Atmos. Environ. 1999, 33, 4535–4564. [CrossRef]
You can also read